How to use the Stochastic Oscillator
The Stochastic Oscillator is among the most popular basic MT4 indicators, included in many strategies along with CCI, MACD, RSI, and other signal confirming instruments. Combined indicators are developed based on specialized strategies. In this review, you will learn how to calculate the stochastic indicator, what signals it gives and how to interpret them. The review also describes several strategies with the oscillator, demonstrating its effectiveness. Bottom line: It is quite useful!
Stochastic Oscillator review
The author of stochastics is one of the most successful traders, George Lane. In the mid-50s he offered a tool that analyzes the speed of the market. According to the legend, he developed formulas for oscillators, consistently naming them with letters of the Latin alphabet. Two formulas turned out to be highly successful, forming the oscillator's flagship tools.
Pros
Advantages of a stochastic oscillator:
-
Ease of setup and use. The fewer settings, the easier it is to optimize the indicator for a strategy. The lack of settings is the second extreme, but the stochastic oscillator has enough of them for a beginning trader to understand and configure the tool.
-
The logic of the signals is clear. There are relatively few signals. There are clear rules defining the presence or absence of a signal.
-
Flexibility. The indicator can work effectively on any timeframe and most assets, including securities and cryptocurrencies.
The indicator is basic, so it can be found on any platform.
Cons
The main drawback is the false signals. The indicator itself gives a lot of false signals because it outpaces the speed of price movement. Especially when the settings are not selected for the current market situation and the volatility of the trading asset. Therefore, it is used only together with other instruments, trend indicators, or oscillators with a fundamentally different calculation formula. There is a variant of using several stochastic iterations with different settings. This strategy will be analyzed below.
Try Stochastic Oscillator Now!How does the Stochastic Oscillator work?
A stochastic oscillator is a leading indicator of the rate of a price change or momentum. For example, with a period of 21, the indicator determines where the price is relative to its maximum and minimum value for 21 candles.
The indicator consists of 2 lines — the main line %K and an additional dashed line %D, which is the standard deviation. Formulas for calculating the lines:
%К = (Close — MinLow(n))/(MaxHigh(n) — MinLow(n)) * 100%
Close is the closing price of the current candle.
MinLow(n) — is the price minimum for n periods.
MaxHigh(n) — is the price maximum for n periods.
%D = moving average of %K
The moving average %D period is specified in the settings. If it is equal to 1, the dashed line coincides with the main line.
The oscillator is placed below the price chart and moves between 0 and 100.
Stochastic Oscillator
The value of the main indicator line is close to the "100" level, and the price is near the price maximum for the specified period. The level "50" means that the price at the moment is equidistant from the maximum and minimum of the specified interval. The key levels set in default settings are "20" and "80". Zones "80-100" and "20-0" are called overbought and oversold zones (hereinafter referred to as key zones).
Interpretation of indicator signals:
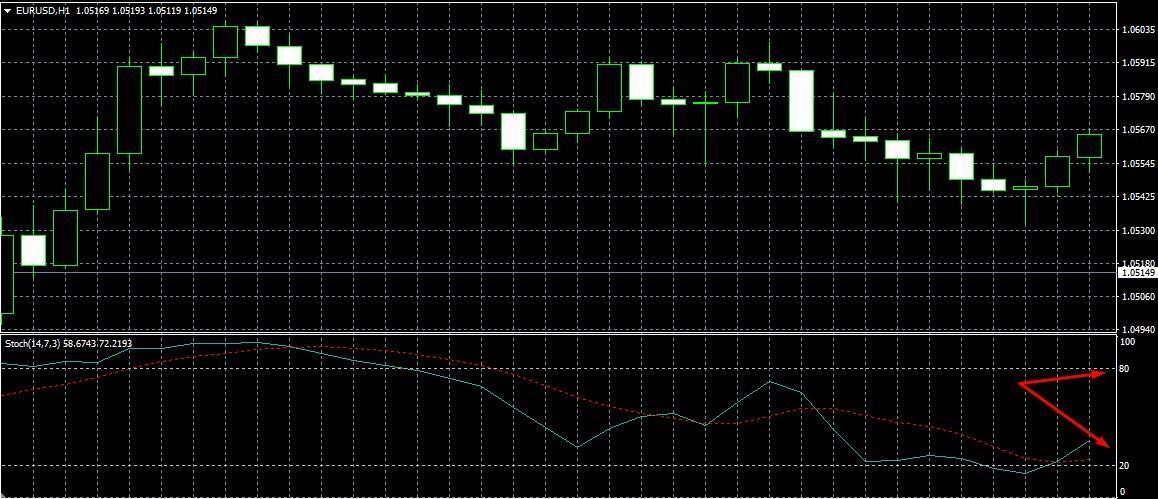
Divergence. This signal shall be considered the most accurate. Divergence is a divergence between the directions of the price movement and one of the oscillator lines (most often the main stochastic line). The price draws a lower minimum on the chart, the stochastic draws a higher minimum (bullish divergence). Price draws a higher maximum, and stochastics draw a lower maximum (bearish divergence). Since a stochastic signal represents a leading indicator, it is a determinant of price direction.
An example of divergence:
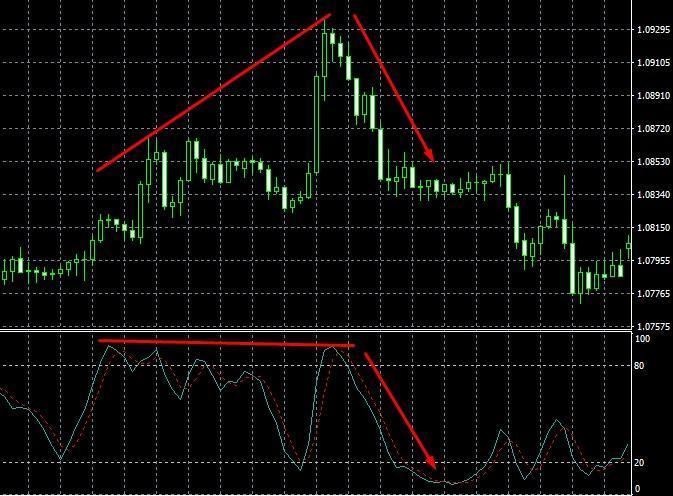
An example of divergence
Divergence is often observed at the moment of a sharp price movement, after which a reversal occurs. It is best to look for divergence on a scaled-down chart. The most accurate signals are when stochastic extrema are in key areas.
Key Areas. If the current closing price is approaching the high or low of the time interval, it indicates that a reversal is very likely to occur. The approach of the main indicator line to the "100" level indicates the rapid growth of the price and that the purchasing power will soon go down. The signal for opening a deal is considered to be the exit of both lines from the key zone.
Crossing the 50% level. The 50% level is a median level — the price is equidistant from its extrema. If the stochastic indicator is in the "50-100" range most of the time, we can talk about an uptrend, per contra, "50-0" is a downtrend. The signal is used more for preliminary analysis than for finding entry points. But stochastic indicators that cross the 50% level at an angle close to 90° can be regarded as a signal to open a deal.
The intersection of the main line and the signal (dashed) line. Intersections are considered only in the key zones. For example, a signal to open a trade is the crossing of the main line of the dashed line in the oversold area from bottom to top at an angle close to the straight line.
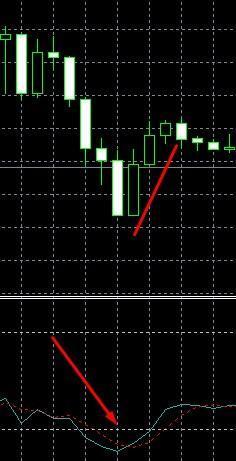
The intersection of the main line and the signal (dashed) line
In this case, the crossing of the dotted line by the main line turned out to be a leading signal. A trade can be opened without waiting for the stochastics to move out of the "0-20" zone.
Based on the stochastic oscillator, modifications have been developed that can be used in combination with both trend indicators and basic stochastics:
Stochastic Momentum Index (SMI). A composite indicator consisting of stochastic and trending Momentum underlying instruments. The indicator gives more accurate signals at the moments of exiting a flat, and when it is less affected by price noise.
DS Stochastic is one in which the smoothing is performed with an exponential moving average.
ADX + Stochastic_alerts. Attempts to combine a trend indicator showing the strength and direction of price movement with a stochastic. When the signals coincide, the indicator gives an audible alert.
ZeroLag Stochs true. The formula for calculating stochastics allows generating signals on 1-2 candles quicker than the more basic version.
OnChart Stochastic. This version is placed directly on the price chart.
It is impossible to say which version of the oscillator is better or worse. All of them have their advantages and disadvantages and work effectively at certain moments in the market.
Stochastic Oscillator settings
The indicator settings menu has four tabs. The first is the main one. On the other three tabs, the colors and thickness of the lines on the chart, and the values of the key zone levels, are where separate timeframes are set and displayed.
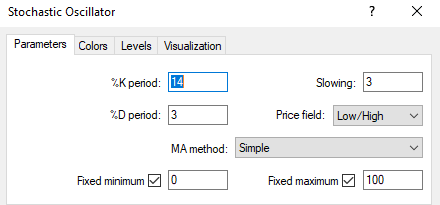
Stochastic Oscillator settings
The main parameters of the indicator:
-
Period %K - period of the main line of the indicator. The period means the number of candlesticks that take part in the calculation. By default, it is indicated by a solid line.
-
Period %D is the period of the additional line. By default, it is indicated by a dashed line.
-
Deceleration - smoothing of lines %K and %D. Increasing this parameter reduces the sensitivity of the indicator and is used mainly for sifting out market noise so that the indicator does not react too sharply to each change in quotations.
-
Prices are the type of price that is used in the calculation. For example, the closing price (Close/Close).
-
MA method is a type of moving average from the %D line calculation formula. Simple moving average, exponential, etc.
Fixing levels is at the user's discretion. The option fixes the oscillator levels on the chart.
Stochastic Oscillator indicators | Best strategies
In this block, you will get acquainted with examples of simple strategies for novice traders, the main feature of which is a minimum level of risk.
Triple acknowledgment
The strategy is based on three basic oscillators such as CCI, RSI, and stochastics. If separately they give a lot of false signals, the combination allows them to sift out most of them. Trend indicators are not needed here since the strategy is based on the fact that a potential reversal signal is confirmed simultaneously by three oscillators, which have changed the signal zones to reduce risk. If all three signals coincide — the trade opens in the direction of the reversal.
Introductory terms:
-
Asset. Any liquid currency pairs. The strategy is well suited for EUR/USD, but you can experiment with other major currencies as well.
-
The timeframe is from M15. Lower intervals are not recommended because of price noise.
-
Indicator settings: CCI (14), RSI (period 14 — levels 35 and 65), stochastic (14, 1, 1).
In these settings, the RSI levels are slightly extended. For different assets, you can "play" with the levels of stochastics as well. The more narrowed the key zones are, the less frequent the signals will be.
The conditions for opening a long position:
-
The RSI has been below the 35th level for some time, reverses upwards, and crosses the 35th level.
-
The CCI has been in the oversold area for some time and goes up, crossing the "-100" level.
-
stochasticity has been in the oversold area for some time, going up, crossing the "20" level.
The deal is opened on the next candle after the signal candle. The basic principle is that all three indicators should enter the oversold zone for at least one candle and simultaneously exit it. The gap between the signals is allowed 1-2 candles, no more.
Example:
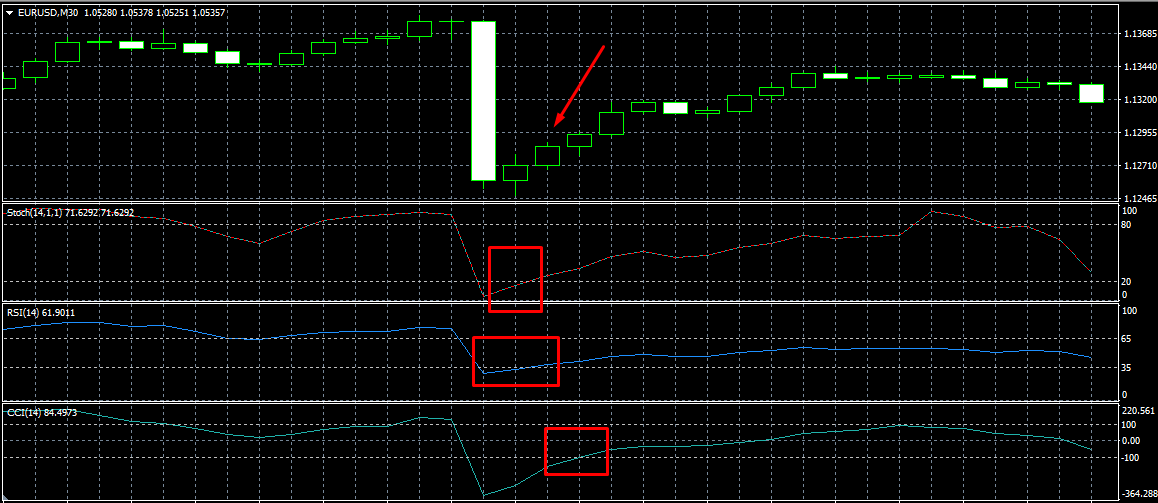
Triple acknowledgment
On the signal candlestick stochastic and RSI cross target levels, the CCI lags by 2 candlesticks. Since before the signal there was a strong downward candle, the trade can be opened without waiting for the signal CCI.
The deal is not opened if at least one of the indicators has not turned around, remaining in the oversold area if the indicators have moved in the oversold area chaotically and in the moments of the appearance of strong fundamental factors in the market following the economic calendar.
The conditions for exiting the market are individual. For example, when one of the oscillators reaches the opposite range. Or ensuring 50% of the position with a trailing bar after making a profit of 20 pips.
For a short position, the conditions are mirrored in the same way. The strategy gives over 70% of accurate signals. It has one drawback, which is that the signals rarely appear.
Stochastic threads
The strategy is based on the combined indicator SpudStochastic (Threads of Spud). It includes 8 stochasticities, which have the same deceleration parameter and %D line, but different %K values. The principle of obtaining signals is to find the moment of stochastic divergence from one point in the signal zones. If all threads converge at one point in the key zones, it indicates consolidation and a reversal is imminent. As soon as the threads start to diverge, a signal appears. SpudStochastic is an arrow indicator, which prompts the candle to open a deal. You can download it for free at the MQL5 website.
Introductions:
-
Assets are any currency pairs, except exotic.
-
The timeframe is from M30 and above.
-
The indicator settings are by default. There are almost none. The %K parameter in stochastics is in the range from 6 to 24 and is already embedded in the code.
Opening of the deal on the arrow. The exit conditions are individual.
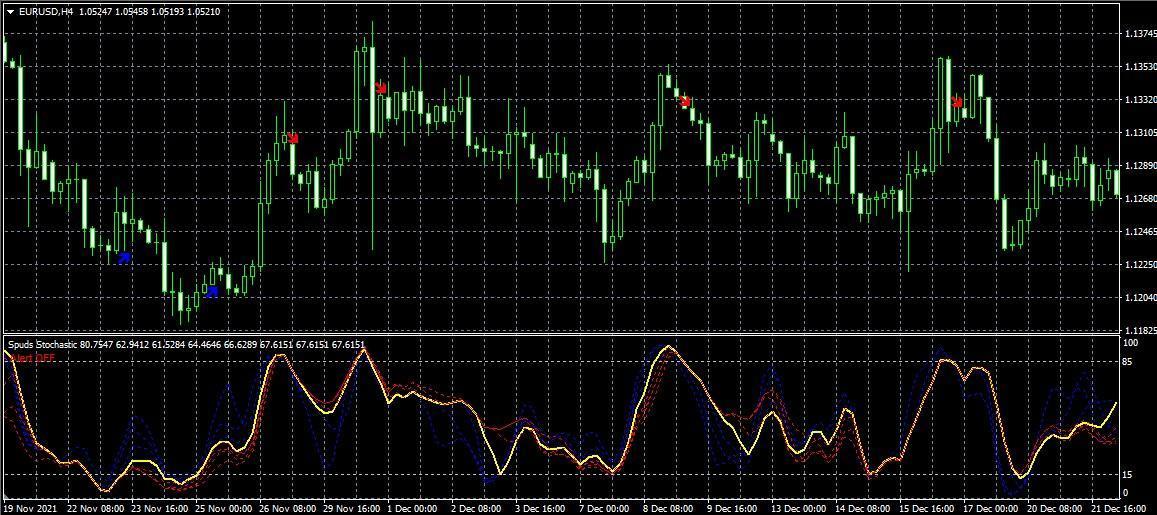
Stochastic threads
Although the strength of the market trends is different, 5 out of 6 signals turned out to be successful. The indicator based on stochastics shows the exact entry points and the trader's task is to determine the best moments to close the deal.
Should I use a Stochastic Oscillator?
The stochastic oscillator allows you to assess how overbought or oversold the market is. One of the most common strategies is to use a trend indicator to find the beginning of a trend and confirm the signal from the oscillator. For example, a reversal pattern and a trend indicator indicate the beginning of an upward movement. If the stochastic is below the "20" level in the oversold area and turns upwards, this is a confirmation signal of an uptrend.
Stochastic signals can also be used to determine the most likely price reversal zone in which to close the trade. For example, after opening a long position, the stochastic goes up. The best time to close a trade is when the oscillator enters the key zone (crossing the "80" level).
Whether or not to use the stochastic is up to you. Try out the oscillator on a demo account, see how comfortable you are working with it and try to find its optimal combination with other instruments.
Conclusion. A stochastic signal is an auxiliary leading indicator, which allows for predicting possible price reversal points. It is used to determine the beginning and the end of a trend. In some cases, it helps to estimate the strength of a trend. Despite its relatively significant disadvantages, stochastics remain one of the most frequently used indicators. Dozens of derivative instruments for professional strategies have been developed on its basis. Therefore, the question is not so much about the disadvantages of the indicator, as about the ability to apply it. Use a demo account and the strategy tester of MT4 and MT5 platforms to find the best settings.
FAQs
With which indicators are the stochastic oscillator best combined?
It depends on the strategy used. Most often, stochastics are used in strategies as an additional confirmatory indicator, showing the location of the price relative to key levels. Trend indicators, trend-force indicators, and graphical analysis are used as basic tools. Less common are strategies that combine stochastics with other oscillators or use a set of stochasticities with different settings.
On which timeframes do stochastics show the best results?
The indicator is almost universal so it can be used in any timeframe. But it gives more accurate signals at longer stable intervals. On timeframes M1-M5 the oscillator is rarely used because of the large number of false signals, the reason for which is price noise and local "shaking" of the market by market makers.
What stochastic settings can be considered optimal?
There is no single answer because it depends on several parameters, for example:
On the type of asset. Each asset has its own volatility, liquidity, and factors affecting the quotes. That's why the line period settings will be different for each asset.
On the timeframe. The price behavior is different for different timeframes. Accordingly, the indicator settings will be different.
On the current market situation and fundamental factors. The currently selected settings may not be suitable in the future due to changes in the factors affecting investor activity.
Optimal settings are selected by testing the trading system on a demo account in the strategy tester MT4/MT5. The system with the best performance is run on a real account. If the actual results deviate from the testing statistics, trading stops, and the strategy is optimized.
What are the basic signals of stochastics?
The basic signals are:
Finding both indicator lines above level 80 or below level 20 and the subsequent reversal of the lines. The presence of the indicator in the key zones indicates an oversaturation of the market with long/short positions and warns of a possible trend reversal.
Divergence. Divergent directionality of the indicator and the price. Since the oscillator belongs to the leading ones, the signal indicates that the price will soon change its direction towards the stochastics.
Stochastic crosses key levels "20-50-80". If the oscillator crosses the 20% level and exits the oversold zone, it is very likely to reach the 50% level. Crossing this level will be a confirmation of a trend movement. Crossing the 80% level on an uptrend suggests that the trend is about to end.
Mutual crossing of the main line and the dashed line in key areas. This weak signal can be used as an additional confirmatory signal. The sharper and faster crossing of both lines as it leaves the key zones represents a strong signal.
The effectiveness of the signals depends on the settings, which are selected on a demo account.
Glossary for novice traders
-
1
Forex indicators
Forex indicators are tools used by traders to analyze market data, often based on technical and/or fundamental factors, to make informed trading decisions.
-
2
Investor
An investor is an individual, who invests money in an asset with the expectation that its value would appreciate in the future. The asset can be anything, including a bond, debenture, mutual fund, equity, gold, silver, exchange-traded funds (ETFs), and real-estate property.
-
3
Cryptocurrency
Cryptocurrency is a type of digital or virtual currency that relies on cryptography for security. Unlike traditional currencies issued by governments (fiat currencies), cryptocurrencies operate on decentralized networks, typically based on blockchain technology.
-
4
Long position
A long position in Forex, represents a positive outlook on the future value of a currency pair. When a trader assumes a long position, they are essentially placing a bet that the base currency in the pair will appreciate in value compared to the quote currency.
-
5
Index
Index in trading is the measure of the performance of a group of stocks, which can include the assets and securities in it.
Related Articles


Team that worked on the article

Andrey Mastykin is an experienced author, editor, and content strategist who has been with Traders Union since 2020. As an editor, he is meticulous about fact-checking and ensuring the accuracy of all information published on the Traders Union platform. Andrey focuses on educating readers about the potential rewards and risks involved in trading financial markets.
He firmly believes that passive investing is a more suitable strategy for most individuals. Andrey's conservative approach and focus on risk management resonate with many readers, making him a trusted source of financial information.
Also, Andrey is a member of the National Union of Journalists of Ukraine (membership card No. 4574, international certificate UKR4492).

Dr. BJ Johnson is a PhD in English Language and an editor with over 15 years of experience. He earned his degree in English Language in the U.S and the UK. In 2020, Dr. Johnson joined the Traders Union team. Since then, he has created over 100 exclusive articles and edited over 300 articles of other authors.

Mirjan Hipolito is a journalist and news editor at Traders Union. She is an expert crypto writer with five years of experience in the financial markets. Her specialties are daily market news, price predictions, and Initial Coin Offerings (ICO).
