Best Time Frame for Day Trading - Intraday Charts Settings


Editorial Note: While we adhere to strict Editorial Integrity, this post may contain references to products from our partners. Here's an explanation for How We Make Money. None of the data and information on this webpage constitutes investment advice according to our Disclaimer.

When choosing the best chart time frames for day trading, learn that they will depend not only on your trading style and preferred time, but also on the liquidity of the instrument you are trading. The lower the liquidity, the larger time frame should be used to avoid random price fluctuations due to low liquidity.
Day trading requires nimble footwork to keep up with the ever-changing tempo of price movements over the course of a single trading session. While some traders glide smoothly between timeframes, fluidly adapting to the market's tune, others find their groove by focusing on a preferred beat.
In this article, we explore how to find the charting rhythm that best matches your individual trading style. Just as dancers excel at different speeds, different timeframes facilitate alternative approaches. By understanding the rhythmic qualities of periodic charts, you can choose the tempo at which you trade most profitably.
We’ll break down the qualities that distinguish popular intraday periodicities and will help you select the time frame allowing your trading to flow in harmony with the market.
Key points from the article
Shorter timeframes like 1-minute charts require maximum concentration but allow for more trades.
5-minute charts are good for determining short term momentum changes.
15-minute charts are ideal for spotting the intraday trend and key entry points. Trader can profit from larger price movements throughout the day focusing on this timeframe.
30-minute charts are used by traders who do daily analysis after market close and want to spend less time on trading execution.
Lower liquidity assets are better traded on larger timeframes to avoid random price fluctuations.
Why Day Trading Time Frame is Better?
Day trading focuses on relatively small price movements within a trading day. Similar to scalpers, day traders will typically leverage their market exposure through margin trading. They have more options, however, when it comes to choosing their time frames, depending on how long they plan to hold their positions.
Traders use day trading to exploit movements over a few minutes to hours, provided that all positions are closed by the end of the day. Because of this, they usually use small time frames, such as 15-minute or hourly charts.
In day trading, the objective is to earn a tiny profit on each trade and add to those earnings over time. When things go wrong, customer service is essential, as well as fast and reliable trade execution.
With day trading, there are more opportunities for trades and there is less risk of losing months' worth of investments overnight. You can also have tighter stop losses and better margin use with shorter time frames. A shorter time frame is ideal for scalpers and momentum traders who seek to take advantage of sharp movements in price.
Typical Time Frames in Trading Strategy
Hourly time frames are used by short-term traders, who hold trades from several hours to a week. In the following table, we highlight some of the most popular time frames in which day traders hold their positions.
While shorter time frames are most popular, some traders feel most comfortable with longer-term charts like the 1-hour charts. The longer time frame allows for more time to analyze the market without feeling rushed.
| Trading Strategy | Position holding time | |
|---|---|---|
| 1-minute | Scalping, Day Trading | 1-15 minutes |
| 5-minute | Scalping, Day Trading | 5-60 minutes |
| 15 minute | Day Trading, Swing Trading | 60 minutes - 2 swings |
| 30 minutes | Day Trading, Swing Trading | 60 minutes - few swings |
| 1 Hour | Swing Trading | 1 Day - Few days |
| 2, 4 Hours | Swing Trading, Positional trading | 1 Few days - few weeks |
| 1 Day | Swing trading, Positional trading, Long-term investing | Few weeks - Few months |
| 1-week | Positional trading, Long-term investing | Few weeks - few years |
Best Time Frames in Day Trading
The most important thing to remember when trading any time frame is that it should be suitable to your personality. It’s for this reason that we recommend that you practice demo trading on a few different timeframes for a while to find your comfort zone. Identifying the best fit will enable you to make the best trading decisions.
In the below screenshot, you can see different time frames for the EUR/USD currency pair (1-minute, 5-minute, 15-minute, and 30-minute).
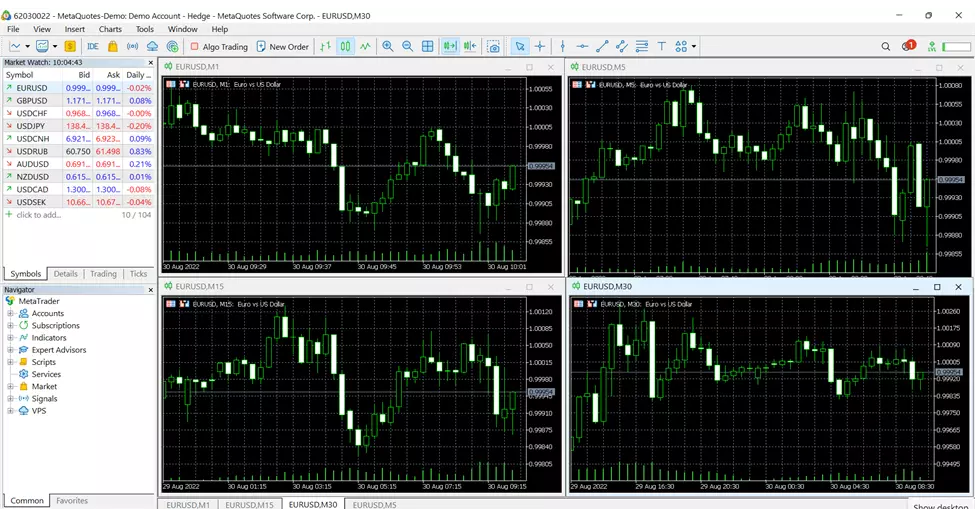 Different time frames for the EUR/USD currency pair
To help you decide the best time frames in day trading, we’ve provided an overview of the different time frames and their advantages.
1-minute
It takes discipline and an excellent understanding of the market structure to trade in short-term time frames such as the 1-minute chart. It's important to know what you're looking for. If a highly volatile instrument breaks its previous day high with high momentum, then there is a good chance you can open a trade with low risks and high potential if the next higher low occurs in the 1-minute time frame.
A 1-minute scalping strategy involves using the 1-minute chart to analyze and execute trades. Every bar in a 1-minute chart represents 1 minute, so you’ill see the bars move in real-time.
This timeframe is best suited for scalpers and professionals because it requires maximum concentration and a large number of transactions.
5-minute
5 minutes is a typical working time frame for a day trader. Trading with the 5-minute time frame allows traders to play reversals and stay in their positions when prices trend in a new direction. This strategy is ideal for traders looking to capitalize on short-term momentum changes. This allows traders to profit from short bursts of momentum while protecting profits with solid exit rules.
To profit from a reversal, traders use risk management tools - like trailing stops - to identify the move and open a position as it happens. Results will vary depending on the market conditions, as they do with many systems using technical indicators.
When it comes to trading high volatility instruments, the 5-minute time frame is frequently used by traders who make just a few trades each day. In the first 60 minutes of a trading day, the 5-minute chart is particularly useful. There is enough time between candles for the trade to be analyzed and orders to be prepared.
15-minute
Day traders who focus on multiple trades throughout the day are most likely to use the 15-minute time frame. A longer watchlist should have a higher chart interval. Having a realistic chance to scan and analyze the current market behavior is crucial. A low timeframe and too many symbols screened at once increase the chance of missing the best possible entry.
The 15-minute time frame is ideal for determining the intraday trend and key entry points. Traders can profit from larger price movements throughout the day by focusing on the 15-minute chart. When trading the 15-minute chart, there are usually one or two profitable opportunities per day, except on holidays and quiet trading days.
In general, traders that prefer the 15-minute time frame have a good understanding of support and resistance and how to read candlesticks.
30-minute
Traders who trade within the 30-minute timeframe often do their daily analysis after the market closes. In their daily trading decisions, these traders spend approximately 30 minutes analyzing the markets.
Traders can benefit from a lower-frequency, lower-involvement approach to trading. A trader's chances of making money over the long-term can be increased by trading less and focusing on daily charts. Additionally, it enables them to spend 30 minutes or less on trading per day. Having fewer trades also reduces transaction costs.
What Are the Best Day-Trading Brokers?
The best day-trading brokers meet the following criteria:
High trading volumes ensure liquidity, allowing traders to enter and exit positions quickly without significant price changes. This is crucial for day traders who rely on quick transactions to capitalize on short-term market movements.
ECN accounts with market spreads offer tighter spreads, reducing trading costs.
Features for trade automation, such as algorithmic trading and advanced trading platforms as MT5 and cTrader, are important because day trading is increasingly moving towards automated trading bots
VPS provides traders with a stable and high-speed internet connection, reducing latency and ensuring that trades are executed swiftly and reliably. This is particularly important for automated trading strategies and for traders who need to maintain constant connectivity to the markets.
| zForex | Plus500 | Trading.com USA | |
|---|---|---|---|
|
ECN Spread EUR/USD |
0.1 | No | No |
|
ECN Commission |
7 | No | No |
|
Daily volume, $ bn |
No | No | 5,000 |
|
Free VPS |
Yes | No | No |
|
cTrader |
No | No | No |
|
MT5 |
Yes | No | Yes |
|
Trading bots (EAs) |
Yes | No | Yes |
|
Open account |
Go to broker Your capital is at risk.
|
Go to broker 80% of retail CFD accounts lose money. |
Go to broker Your capital is at risk. |
15-Minute vs. 5-Minutes Charts: What Should I Use?
15-minute and 5-minute day trading charts are the most popular when it comes to trading time frames. If you’ve narrowed down your strategy to these two time frames, which one is better? Which one has the best potential to offer the most success?
When deciding on the best time frame, it’s important to consider how much time you want to commit to trading every day. A lower time frame means longer screentime. A longer screen time and higher trading frequency increase the chances of making mistakes. Because of this, it’s crucial to choose the charting time frame based on the time and frequency of your trades.
A 15-minute chart is used to determine the trend and key points, and a 5-minute chart is used to set a stop loss and track a position. Also, a 5-minute chart tracks price movement in 5-minute increments, giving you more visibility into price movements as they happen in real-time. So, while you’ll be able to see more of what’s going on in the market with 5-minute charts, you’ll likely spend more time trading.
On the other hand, 15-minute charts are more long-term and give you the ability to trade from a mobile device with less time commitment.
Therefore, the best time frame to choose will depend on what best suits your trading strategy, personality, and preferred time commitment.
Best Day Trading Time Frames in Forex, Crypto, and Stock Market
The day trading time frame that you choose will not only depend on your trading style and preferred time commitment, but it’ll also depend on the liquidity of the instrument you’re trading. For example, in forex, it’s logical to use the smallest timeframes such as 1- and 5-minutes in the euro/dollar pair, in the stock market in pairs of bitcoin/dollar and ether/dollar. The lower the liquidity, the larger timeframe should be used to avoid random price fluctuations due to low liquidity.
Due to the lower liquidity of some crypto assets in comparison to other instruments, some timeframes won't be useful. For example, 1-minute or 1-hour charts aren't very useful for an asset that trades every few days. You should therefore consider liquidity when choosing crypto assets to trade.
Crypto assets can also be event-driven in some cases, such as when hard forks take place or algorithm changes occur, which can complicate technical analysis. It’s important to consider the upcoming events that will drive the market's risk. As a result, you may want to stay out of the market if don’t want to incur additional directional risk.
How To Use Multiple Time Frames in Trading
Incorporating multiple time frames in trading analysis can yield crucial insights and enhance decision-making processes. It involves studying the behavior of the same currency pair across various time frequencies or compressions. Traders who successfully employ this technique can significantly improve their odds of conducting profitable trades. This guide will walk you through how to seamlessly integrate multiple time frames into your trading analysis.
Determining Your Main Time Frame
Your main or primary time frame forms the backbone of your trading decisions. It's the time frame in which you feel most comfortable and have ample experience. The analysis you perform in this time frame will guide your trading actions.
Selecting Auxiliary Time Frames
Auxiliary or supporting time frames assist in confirming the trend and identifying points of entry and exit. These time frames ought to be shorter than your primary time frame. For instance, if your main time frame is the daily chart, you might select the 4-hour and 1-hour charts as your supporting time frames.
Synchronizing Time Frames
Achieving alignment or synchronization among your chosen time frames is vital. This implies that the trends across different time frames should exhibit similar directional movement. Discrepancies in trend direction could result in confusion and misjudged trading decisions.
Recognizing Trends
Trend recognition plays a significant role in multi-time frame analysis. The trend within your primary time frame should mirror that within your supporting time frames. This will help you confirm potential points of entry and exit.
Searching for Confluence
Confluence refers to the phenomenon when multiple technical indicators or analysis methods validate each other. When using multi-time frame analysis, it's crucial to seek confluence among different time frames. This further solidifies trend confirmation and pinpoints potential points of entry and exit.
Use Higher Time Frames for Direction, Lower Time Frames for Timing
Higher time frames are instrumental in determining the trend direction, while lower time frames find entry and exit points. For example, if the daily chart indicates an upward trend, you should look for buying signals on the 4-hour and 1-hour charts.
Ensuring Consistency
Maintaining consistency when utilizing multiple time frames is crucial. This means you should use the same set of time frames for all your trades. Doing so will help in formulating a trading strategy that is both consistent and reliable.
Is Technical Analysis Using Multiple Timeframes a Good Idea?
Using technical analysis in multiple timeframes is indeed a good idea when it comes to Forex trading. This method, known as Multiple Time Frame Analysis (MTFA), gives traders a more comprehensive view of the market and enhances the quality of trading decisions. Below are several reasons why MTFA can be beneficial.
Confirmation of Trends
One of the primary benefits of using multiple timeframes in technical analysis is trend confirmation. By viewing the trend over multiple timeframes, you can better identify the overall direction of the market. For example, if the trend appears to be going upward on both the daily and hourly charts, that gives you more confidence that an uptrend is indeed occurring. This multi-frame confirmation can help you avoid false signals that may appear in a single timeframe.
Enhanced Entry and Exit Points
Using multiple timeframes can also help you optimize your entry and exit points. Let's say the daily chart shows an upward trend, but you're unsure of the best point to enter the trade. You can then check the hourly or 15-minute chart to identify shorter-term retracements (temporary price reversals) within the longer-term uptrend and use these as opportunities to enter the trade at a better price.
Risk Management
Another advantage of MTFA is improved risk management. By looking at longer timeframes, you can get a better sense of the bigger picture and avoid getting caught in harmful short-term volatility. For example, you might see a selling opportunity on a 15-minute chart, but a look at the daily or weekly chart could show a strong uptrend that indicates it's actually not a good time to sell.
Identifying Support and Resistance Levels
Support and resistance levels are key elements in technical analysis. Using multiple timeframes can help you identify these levels more accurately. The more times a price touches a support or resistance level in different timeframes and bounces back, the stronger that level is.
Filtering Out Market Noise
Finally, using multiple timeframes helps filter out 'noise'. Market noise refers to random price fluctuations that can mislead a trader into believing a trend or reversal is happening when it's not. By using multiple timeframes, you're able to smooth out this noise and better focus on the real trends and patterns.
Day Trading Chart Time Frame Alternatives
Day traders often look for alternative charting methods to capture the nuances of intraday price movements. Two such methods are Renko charts and Tick charts:
Renko Charts
Renko charts focus solely on price movement and filter out time and volume, which can provide a cleaner look at the price trends. A new Renko "brick" (the equivalent of a candle in a candlestick chart) is drawn in a new column if the price moves a predefined amount, either up or down. The size of the movement (brick size) is set by the trader. If the price moves less than the set amount, no brick is drawn. This provides a smoothed view of the price action, eliminating minor price fluctuations or 'noise', and makes it easier to identify trends and reversals.
Tick Charts
Unlike conventional time-based charts that print a new candlestick every minute or every hour, tick charts print a new bar or candle after a specified number of trades (or 'ticks') have been completed, regardless of time. For example, a 100-tick chart will plot a new bar after every 100 trades. Tick charts offer a detailed view of the trading activity because they show every transaction (or tick). They can be very useful for day traders, especially in fast-moving markets where the number of trades can provide information about market sentiment and potential reversals.
Expert Opinion

There are a few key points I want to highlight to help optimize your timeframe selection.
First, it's important to remember that no single timeframe is inherently "best" - it depends entirely on your individual strategy, preferences, and how much time you have to dedicate each day. The best timeframe is the one that works best for you after rigorous testing.
I recommend starting with the 15-minute chart, as it offers a nice balance between capturing short-term movements while not requiring constant monitoring. However, be sure to also check the 5-minute and 1-hour periodically to confirm trends and find optimal entry points.
Using multiple timeframes in your analysis is extremely valuable. Look for confluence between the timeframes - only take trades that are supported by the behavior seen on longer duration charts as well. This will help filter out noise and false signals.
Always remember that liquidity varies between assets. Lower liquidity pairs or stocks may require sticking to larger intervals like the 30-min or 1-hour charts to avoid whipsaws.
No matter which timeframe you choose, focus on strict risk management. The timeframe is less important than consistency in your trading approach.
Methodology for compiling our ratings of Forex brokers
Traders Union applies a rigorous methodology to evaluate brokers using over 100 quantitative and qualitative criteria. Multiple parameters are given individual scores that feed into an overall rating.
Key aspects of the assessment include:
-
Regulation and safety. Brokers are evaluated based on the level/reputation of licenses and regulations they operate under.
-
User reviews. Client reviews and feedback are analyzed to determine customer satisfaction levels. Reviews are fact-checked and verified.
-
Trading instruments. Brokers are evaluated on the range of assets offered, as well as the breadth and depth of available markets.
-
Fees and commissions. All trading fees and commissions are analyzed comprehensively to determine overall costs for clients.
-
Trading platforms. Brokers are assessed based on the variety, quality, and features of platforms offered to clients.
-
Other factors like brand popularity, client support, and educational resources are also evaluated.
Find out more about the unique broker assessment methodology developed by Traders Union specialists.
Conclusion
Choosing the best time frame for day trading hinges on your personal trading style and objectives. As revealed in the article, the 1-minute chart caters to scalpers seeking rapid trades but can overwhelm with noise, while the 15-minute chart provides clearer trend signals suited to more patient traders, albeit with fewer opportunities. The 5-minute timeframe often strikes the ideal balance, offering actionable signals and manageable volatility. Ultimately, mastering one time frame and understanding its personality can significantly boost trading consistency and confidence. Remember: success in day trading comes not from chasing every tick, but from aligning your strategy with the rhythm of your chosen chart.
FAQs
How can day traders effectively balance screen time with trading opportunities when choosing intraday chart time frames?
What role does risk management play in selecting the best time frame for intraday trading?
How does the use of multiple chart time frames help in identifying stronger support and resistance levels?
Are there any particular time frames that are better suited for traders who prefer a lower-frequency, less hands-on approach to intraday trading?
Editors' Top Picks and Insights

Bitcoin mining is getting greener, but the debate isn't over

Asia's largest IPO: How CXMT became China's most valuable company

Global fintech in 2026: Three trends that matter

From Jesus Christ to aliens: Polymarket's most absurd prediction markets

Hunting crypto owners: Why criminals have gone offline

BitMEX is shutting down: Why Trump could not save the exchange
Related Articles
Team that worked on the article
Johnathan M. is a U.S.-based writer and investor, a contributor to the Traders Union website.
Dan Blystone began his trading career in 1998 as an arbitrage clerk on the floor of the Chicago Mercantile Exchange (CME). He later traded bond and Eurex futures at proprietary firms such as Altea Trading, gaining valuable experience in high-frequency trading and risk management.
Chinmay Soni is a financial analyst with more than 5 years of experience in working with stocks, Forex, derivatives, and other assets. As a founder of a boutique research firm and an active researcher, he covers various industries and fields, providing insights backed by statistical data.
Algorithmic trading is an advanced method that relies on advanced coding and formulas based on a mathematical model. However, compared to traditional trading methods, the process differs by being automated.
Volatility refers to the degree of variation or fluctuation in the price or value of a financial asset, such as stocks, bonds, or cryptocurrencies, over a period of time. Higher volatility indicates that an asset's price is experiencing more significant and rapid price swings, while lower volatility suggests relatively stable and gradual price movements.
An ECN, or Electronic Communication Network, is a technology that connects traders directly to market participants, facilitating transparent and direct access to financial markets.
Scalping in trading is a strategy where traders aim to make quick, small profits by executing numerous short-term trades within seconds or minutes, capitalizing on minor price fluctuations.
A Trailing Stop Order is a type of order that automatically adjusts the stop-loss level as the market price moves in a favorable direction, helping to protect profits.

-
 Afghanistan
-
 Albania
-
 Algeria
-
 Angola
-
 Argentina
-
 Armenia
-
 Australia
-
 Austria
-
 Azerbaijan
-
 Bahamas
-
 Bahrain
-
 Bangladesh
-
 Belarus
-
 Belgium
-
 Bolivia
-
 Botswana
-
 Brazil
-
 Brunei
-
 Bulgaria
-
 Cambodia
-
 Cameroon
-
 Canada
-
 Chile
Chile
-
 China
China
-
 Colombia
-
 Congo
Congo
-
 Costa Rica
-
 Cote d'Ivoire
-
 Croatia
-
 Cuba
Cuba
-
 Cyprus
-
 Czechia
-
 DR Congo
-
 Denmark
-
 Dominican Republic
-
 Ecuador
-
 Egypt
Egypt
-
 El Salvador
-
 Estonia
-
 Eswatini
-
 Ethiopia
-
 Finland
-
 France
-
 Georgia
-
 Germany
-
 Ghana
Ghana
-
 Greece
-
 Haiti
Haiti
-
 Hong Kong
-
 Hungary
-
 India
India
-
 Indonesia
-
 Iran, Islamic republic
-
 Iraq
Iraq
-
 Ireland
-
 Israel
-
 Italy
Italy
-
 Jamaica
-
 Japan
Japan
-
 Jordan
-
 Kazakhstan
-
 Kenya
Kenya
-
 Korea
Korea
-
 Kuwait
-
 Kyrgyzstan
-
 Laos
Laos
-
 Latvia
-
 Lebanon
-
 Lesotho
-
 Libya
Libya
-
 Lithuania
-
 Luxembourg
-
 Madagascar
-
 Malaysia
-
 Malta
Malta
-
 Mauritius
-
 Mexico
-
 Moldova
-
 Mongolia
-
 Montenegro
-
 Morocco
-
 Mozambique
-
 Myanmar
-
 Namibia
-
 Nepal
Nepal
-
 Netherlands
-
 New Zealand
-
 Nigeria
-
 North Macedonia
-
 Norway
-
 Oman
Oman
-
 Pakistan
-
 Palestine
-
 Panama
-
 Papua New Guinea
-
 Paraguay
-
 Peru
Peru
-
 Philippines
-
 Poland
-
 Portugal
-
 Puerto Rico
-
 Qatar
Qatar
-
 Reunion
-
 Romania
-
 Rwanda
-
 Saudi Arabia
-
 Serbia
-
 Singapore
-
 Slovakia
-
 Slovenia
-
 Somalia
-
 South Africa
-
 Spain
Spain
-
 Sri Lanka
-
 Sweden
-
 Switzerland
-
 Syria
Syria
-
 Taiwan
-
 Tajikistan
-
 Tanzania
-
 Thailand
-
 Trinidad and Tobago
-
 Tunisia
-
 Turkey
-
 UAE
UAE
-
 Uganda
-
 Ukraine
-
 United Kingdom
-
United States
-
 Uruguay
-
 Uzbekistan
-
 Venezuela
-
 Vietnam
-
 Yemen
Yemen
-
 Zambia
-
 Zimbabwe
- Forex
- Crypto
- Why is the Day Trading Time Frame Better?
- Typical Time Frames
- Best Time Frames
- Best Day-Trading Brokers
- 15-Minute vs. 5-Minutes Charts
- Best Time Frames in different markets
- How To Use Multiple Time Frames in Trading
- Is Technical Analysis Using Multiple Timeframes a Good Idea?
- Day Trading Chart Time Frame Alternatives
- Expert Opinion
- Conclusion
- FAQs
