How To Use Renko Chart In Trading?


Editorial Note: While we adhere to strict Editorial Integrity, this post may contain references to products from our partners. Here's an explanation for How We Make Money. None of the data and information on this webpage constitutes investment advice according to our Disclaimer.
Renko charts are a specialized charting method for financial trading that focuses on significant price movements. Basic capabilities: visual trends, simplified analysis, noise filtering. Allows clear trend identification, better support/resistance levels, works with other indicators.
This article explores the practical use and applications of Renko charts in financial trading. It explains how Renko charts differ from traditional chart types like candlestick and bar charts, with a focus on their ability to filter out market noise and highlight clear trends. It also covers how traders can use Renko charts to identify support and resistance levels, spot entry and exit points, and implement stop-loss strategies. In additon, the article examines the benefits and drawbacks of Renko charts, trading strategies built around them, and ways to combine them with other technical indicators to improve decision-making.
What Is Renko chart and how does it work?
 Renko chart
A Renko chart is a type of chart used in financial trading that represents price changes in a different way compared to more traditional charts like candlestick or bar charts. Here's how it works in simple terms:
Bricks: Renko charts are made up of "bricks" that represent price movement. Each brick is the same size and shows a fixed amount of price change. The size of each brick is called the "box size" and can be adjusted according to your preference or trading strategy.
Price Movement: A new brick is added to the chart when the price moves a certain amount (equal to the box size) from the previous brick's closing price. For example, if the box size is set to 10 points and the price goes up or down by 10 points, a new brick will be added.
Direction: Bricks are added in columns, either up or down. If the price increases by the box size, a new brick is added above the previous one. If the price decreases by the box size, a new brick is added below the previous one.
No Time Factor: Unlike other charts that consider time intervals (such as minutes, hours, or days), Renko charts focus only on price movement. This means a Renko chart can appear to move slowly during times of low volatility or rapidly during high volatility.
Smoothing Out Noise: Renko charts are great for filtering out market noise and focusing on significant price movements. They provide a clear visual of the market's trends and can help identify support and resistance levels.
Visual Trends: Because of the way Renko charts represent data, they make it easy to see trends and changes in market direction. This can be helpful for traders who want to identify strong trends without being distracted by short-term fluctuations.
 Nifty 50 index chart ( Traditional chart)
This traditional Nifty chart makes it harder to detect support and resistance levels compared to Renko charts. Price movements appear choppy and unclear, which can make identifying trends and reversals challenging. This can lead to difficulties in making trading decisions based on visual cues.
 Nifty 50 Index Chart ( Renko charts)
On the other hand this Nifty index chart shows clear trends and support/resistance levels when compared to above traditional charts for the same period, Renko charts help identify price reversals and make it easier to spot trends and changes in direction.
Renko chart settings
Renko charts help traders identify trends, support, and resistance levels more clearly than traditional price charts. Key settings for Renko charts include:
Brick Size: This is the fixed price movement needed to create a new brick (or block) on the chart. Choose a brick size based on a fixed value (e.g., 10 points) or a percentage of the current price (e.g., 1%). Larger brick sizes smooth out noise and focus on longer trends, while smaller sizes capture more details.
Calculation Method: Typically, closing prices are used to determine when a new brick is added, but other methods like high/low prices are options.
Time Frame: Renko charts can be used with any time frame (e.g., daily, weekly), but the chosen time frame can influence perceived trends.
Reversal Setting: This controls how many bricks must reverse direction to confirm a trend reversal, often set to one brick.
How to install a Renko chart
Renko charts can offer traders a clear view of trends, helping to identify support and resistance levels. Most modern trading platforms provide built-in functionality to create Renko charts. In some cases, though, additional actions may be required, such as downloading specific charting plugins or indicators. To install a Renko chart, you should first check your trading platform's charting tools to see if Renko is an available option. If it is, you can simply choose it and adjust the settings according to your preferences. If not, you might need to download an external Renko chart plugin or indicator and follow the installation instructions provided by the developer.
How do I get Renko charts on TradingView?
| Step | Description |
|---|---|
| 1. Subscription | Have a Pro subscription to TradingView for access to Renko charts (also Renko available for Daily charts for free) |
| 2. Choose Instrument | Select the trading instrument you want to analyze. |
| 3. Open Chart | Open the price chart for the chosen instrument. |
| 4. Change Chart Type | In the chart type dropdown menu, select "Renko." |
| 5. Configure Settings | Adjust the settings to your preference, choosing either Average True Range (ATR) or Fixed Size. |
| 6. Set Brick Size & Time Frame | Specify brick size in pips or points for fixed size, and set base time frame for the chart. |
How to create a Renko chart in MT4?
| Step | Description |
|---|---|
| 1. Download Indicator | Download the Renko chart indicator file. |
| 2. Open Data Folder | In MT4, go to "File" => "Open Data Folder." |
| 3. Follow Path | Navigate to the "MQL4" folder, then "Experts" folder. |
| 4. Copy File | Copy the downloaded file into the "Experts" folder. |
| 5. Restart MT4 | Close and restart MetaTrader 4 for the changes to take effect. |
| 6. Add Renko Indicator | Use the Quantum Live Renko Charts indicator, which utilizes MT4's Offline Charts feature. |
| 7. Choose Mode | Select either "Compute Best Box Size" or "Fixed Box Size" mode. |
| 8. Apply Multiple Instances | You can add the Quantum Live Renko Charts indicator multiple times to the same chart. |
How to install a Renko chart on Thinkorswim?
| Step | Description |
|---|---|
| 1. Open New Chart | Launch Thinkorswim and navigate to the "Charts" tab. |
| 2. Select Instrument | Choose the security you want to analyze in the top left corner of the chart. |
| 3. Access Chart Settings | Click the gear icon in the top right corner to open the "Settings" menu. |
| 4. Configure Time Axis | Locate the "Time Axis" tab within the settings menu. |
| 5. Enable Renko Bars | Under "Aggregation Type," choose "Range" and then select "Renko Bars" under "Range Type." |
| 6. Set Brick Size | Enter the desired brick size in the "Price range" field. |
| 7. Apply Changes | Click "OK" to apply the changes and view your Renko chart. |
How to use Renko charts
| Task | Description |
|---|---|
| Set a Block Size | Choose the block size (either a fixed dollar amount or a percentage of the asset's price). |
| Identify Trends | Look for patterns in consecutive blocks moving in the same direction, indicating an uptrend or downtrend. |
| Spotting Entry and Exit Points | Look for buying signals after upward blocks follow downward ones, and selling signals after downward blocks follow upward ones. |
| Use Stop Loss | Use the block size to set stop loss levels to limit potential losses. |
| Combine with Other Indicators | Use technical indicators such as moving averages, RSI, or stochastic oscillator to confirm trading signals. |
| Adjust the Block Size | Modify the block size if the chart is too sensitive or not sensitive enough. |
| Monitor Regularly | Keep an eye on the Renko chart regularly to stay updated on market changes and adjust positions accordingly. |
| Tips | Practice using Renko charts and stick to your trading strategy to focus on significant price movements and avoid impulsive trades. |
Before applying Renko-based trading strategies, it’s essential to choose a reliable broker that provides stable platforms, accurate charting tools, and fast execution. The table below compares trusted brokers that support Renko chart setups and offer solid trading conditions for both beginners and professionals. These platforms ensure that your technical analysis runs smoothly and without delays, allowing you to focus on market trends rather than technical issues.
| zForex | Plus500 | OANDA | Trading.com USA | FOREX.com | |
|---|---|---|---|---|---|
|
Demo |
No | No | No | No | No |
|
Min. deposit, $ |
10 | 100 | No | 50 | 100 |
|
Max. leverage |
1:1000 | 1:300 | 1:200 | 1:50 | 1:50 |
|
Standard EUR/USD spread |
0.3 | 0.7 | 0.3 | 1.1 | 1.0 |
|
ECN Spread EUR/USD |
0.1 | No | 0.15 | No | 0.2 |
|
Max. Regulation Level |
Not regulated | Tier-1 | Tier-1 | Tier-1 | Tier-1 |
|
TU overall score |
8.05 | 7.57 | 6.89 | 6.15 | 6.87 |
|
Open an account |
Go to broker Your capital is at risk.
|
Go to broker 80% of retail CFD accounts lose money. |
Go to broker Your capital is at risk. |
Go to broker Your capital is at risk. |
Study review |
Strategies for trading with Renko charts
Renko charts are a valuable tool for traders seeking a clear visual representation of price movements. Unlike traditional charts, Renko charts focus on significant price changes rather than time-based fluctuations. This makes them useful for identifying trends and potential trading opportunities. Experts have discussed below some strategies for trading with Renko charts.
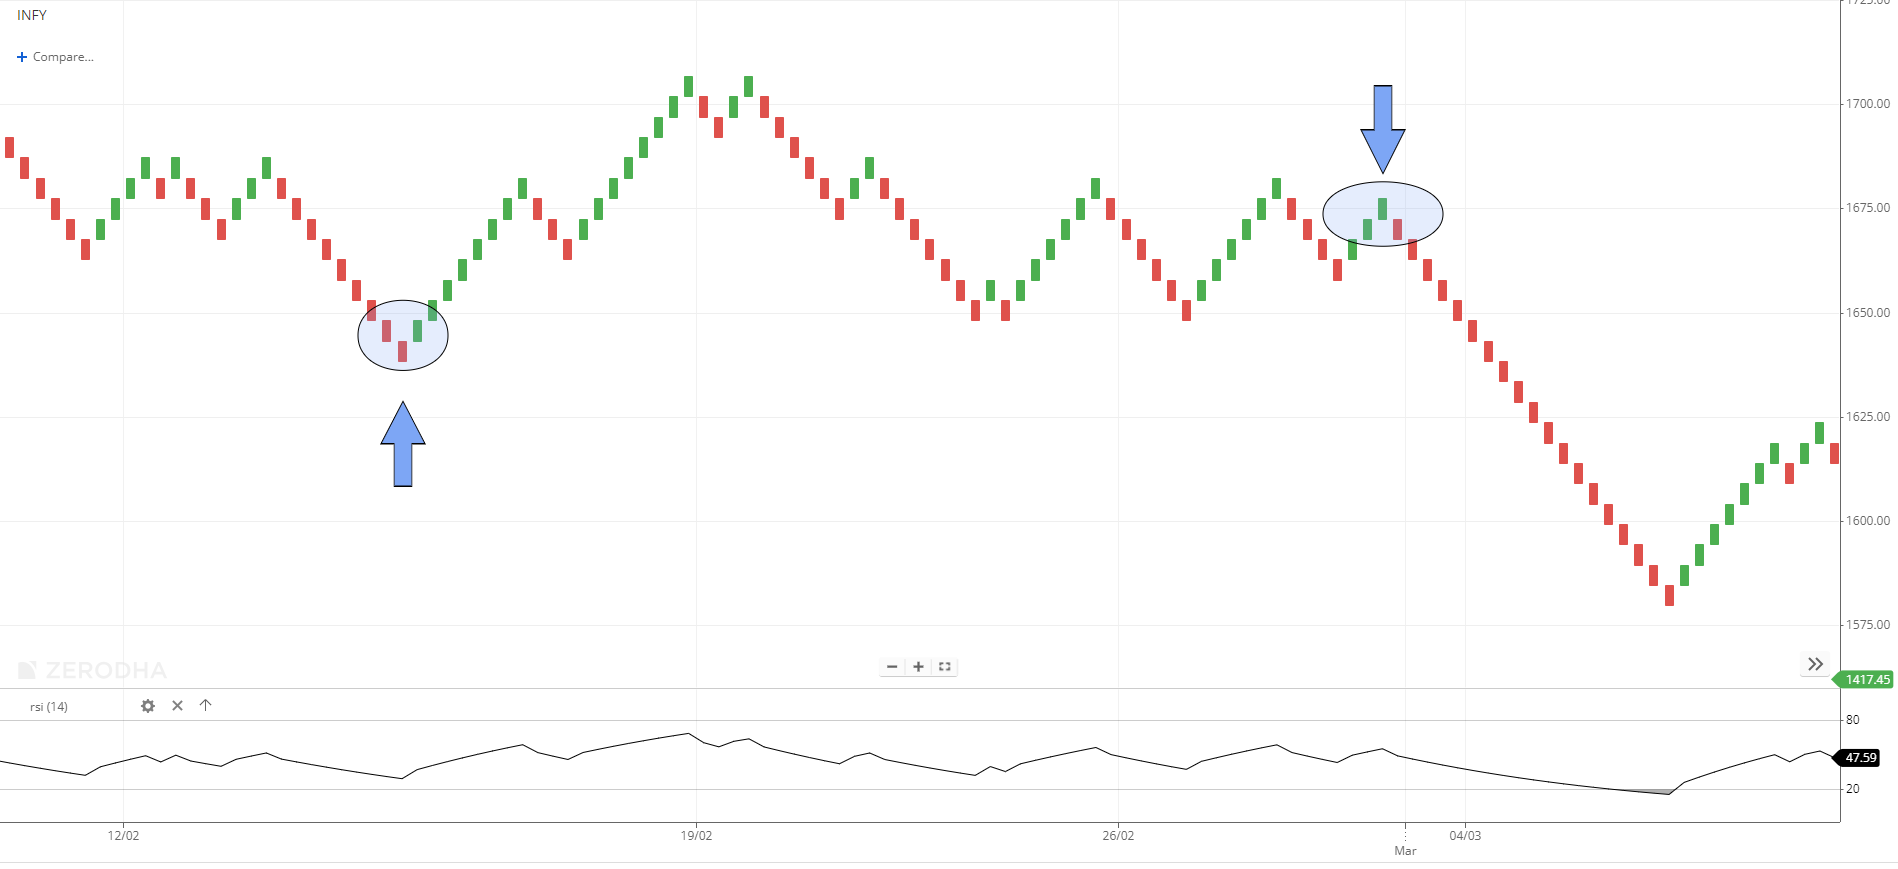
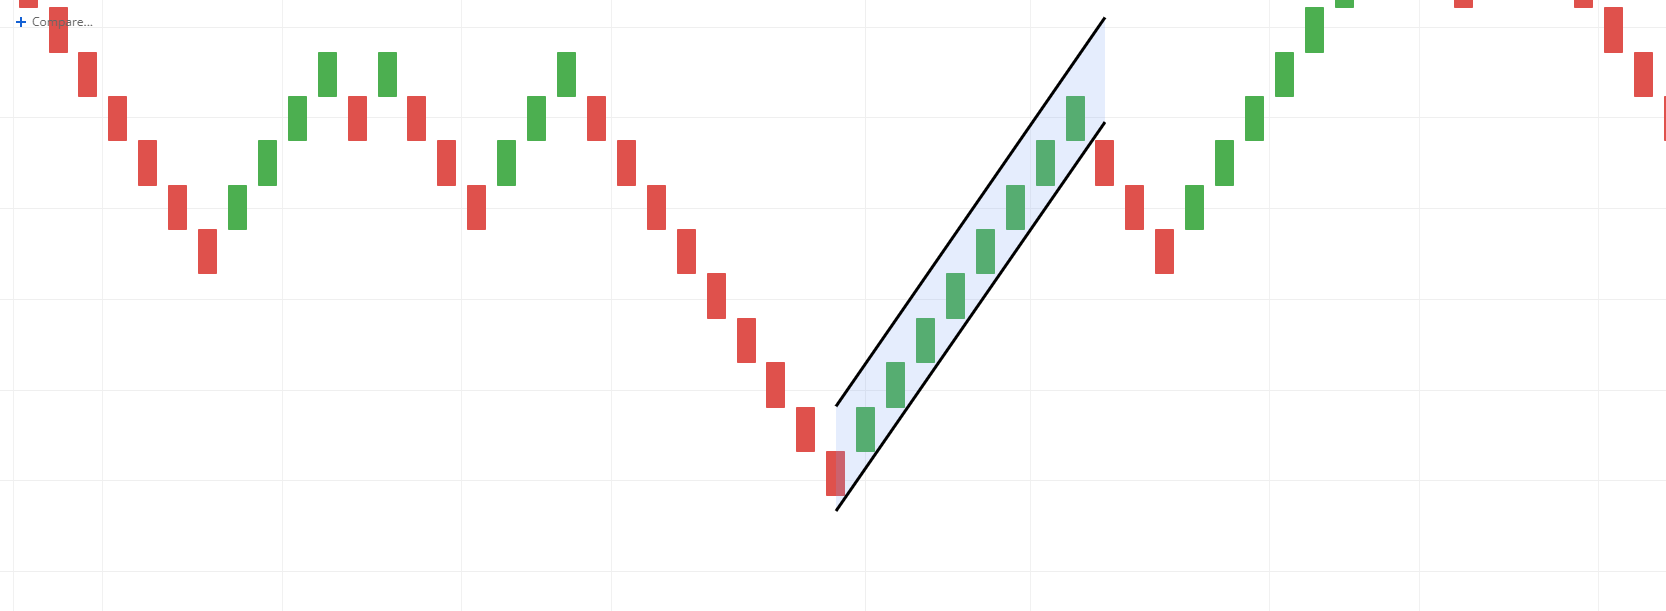
Follow the trend
Renko charts excel at highlighting trends. One effective strategy is to enter trades in the direction of the prevailing trend.
For long trades, wait for Renko bricks to turn from red to green (indicating an upward trend). Enter a trade once the trend is confirmed, typically after a few green bricks.
For short trades, wait for Renko bricks to turn from green to red (indicating a downward trend). Enter a trade once the trend is confirmed, typically after a few red bricks.
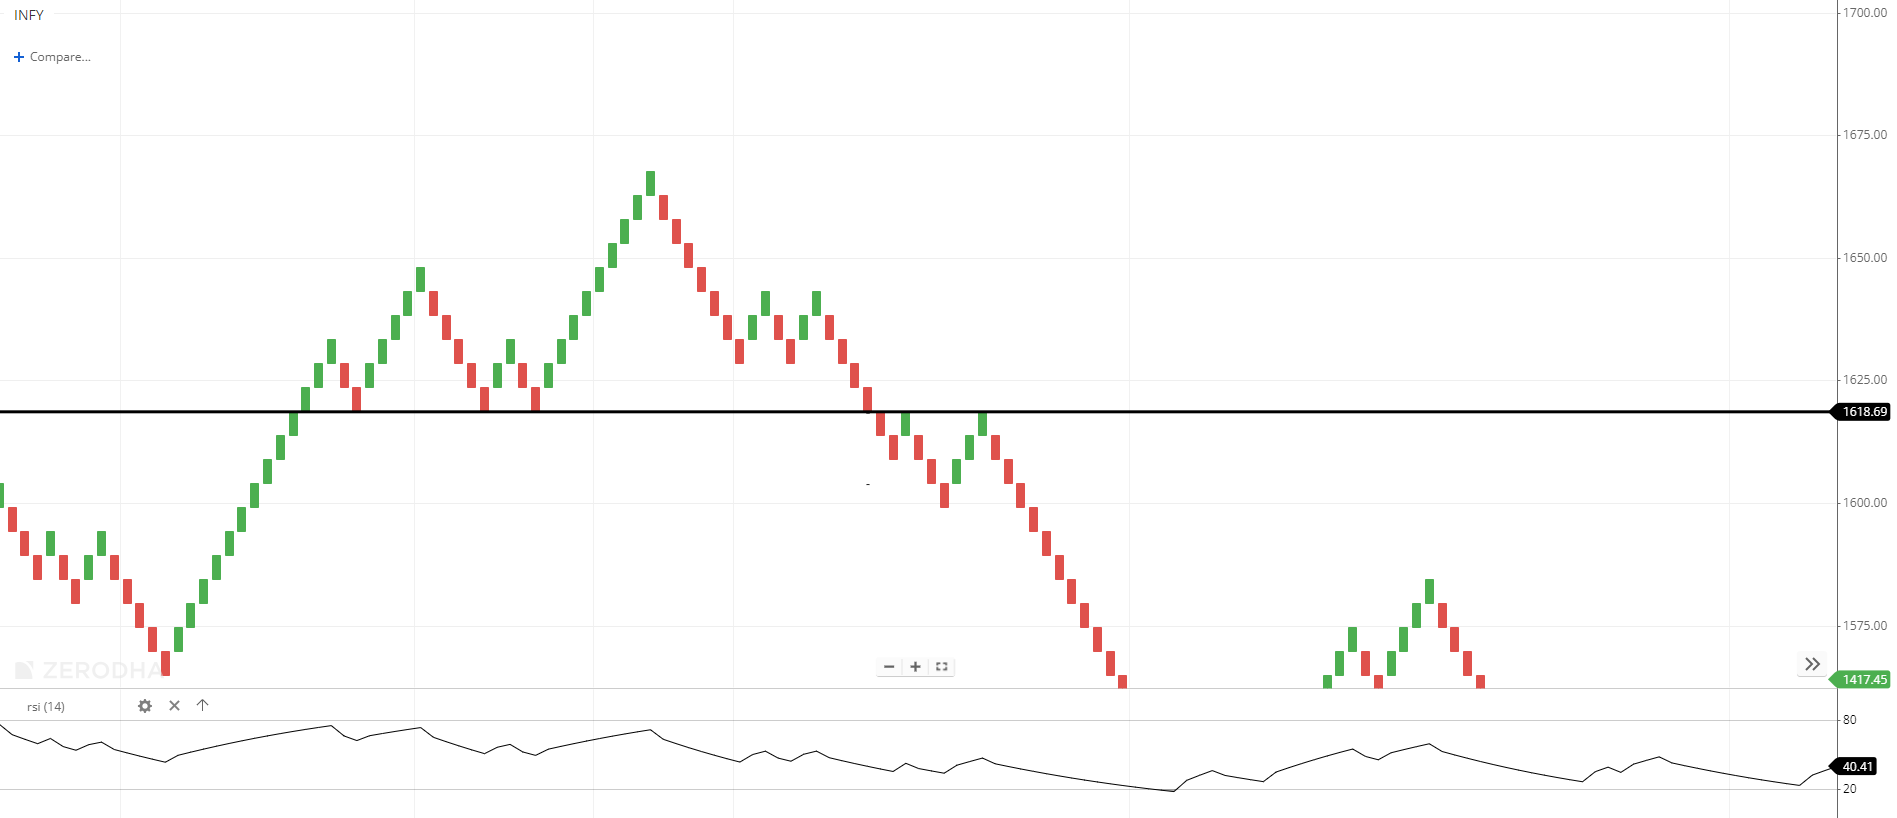
 Infosys chart (NSE)
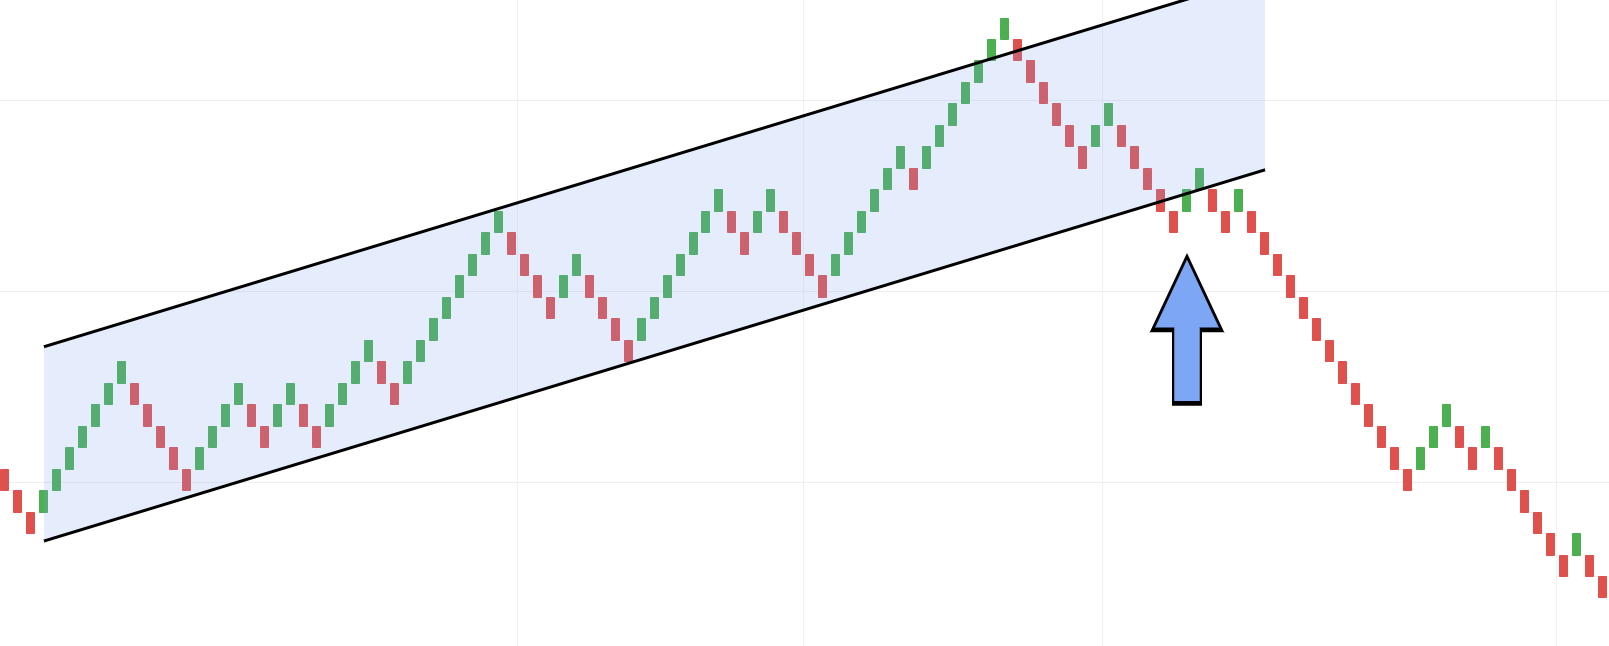
Support and resistance breakouts
Look for Renko bricks to break through established support or resistance levels.
When this happens, it can signal a potential trade opportunity in the direction of the breakout.
Determining stop loss on Renko chart
Below/Above the Previous Brick:
For long trades, set a stop loss below the previous red brick.
For short trades, set a stop loss above the previous green brick.
ATR-based Stop Loss:
Some traders use the Average True Range (ATR) to determine their stop loss levels.
Multiply the ATR value by a factor (such as 1 or 1.5) and use that to set your stop loss above/below the most recent Renko brick.
This can help account for volatility and provide a more dynamic stop loss level.
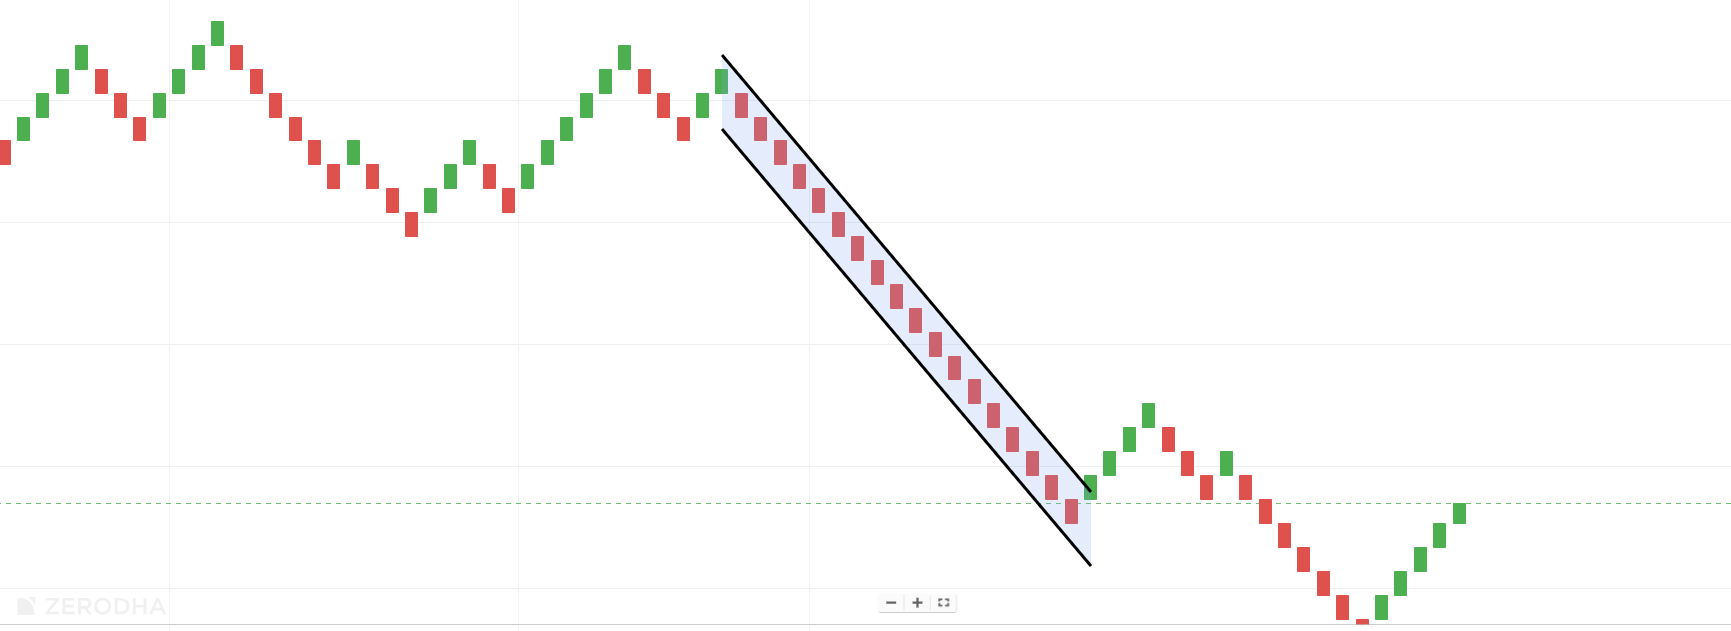
Renko charts are unique in their simplicity and ability to filter out market noise, making them ideal for identifying clear price trends and reversal patterns. There are several patterns to watch for when using Renko charts:
Trend Continuation
In an uptrend, a series of consecutive green bricks indicates a strong upward movement.
In a downtrend, a series of consecutive red bricks signifies a strong downward movement.
Reversal patterns
A reversal pattern occurs when the color of the bricks changes from green to red (or vice versa).
This pattern suggests a potential change in trend direction and can be an entry or exit point.
Double brick reversal
A strong reversal is confirmed when there are two bricks in the opposite direction from the current trend.
For example, in an uptrend, if two consecutive red bricks form, it indicates a potential downward reversal.

Breakouts
When the price breaks through a key support or resistance level on the Renko chart, it can indicate a breakout.
This can be a signal to enter a trade in the direction of the breakout.
What is the best indicator to use with Renko chart for trading?
The best indicator to use with Renko charts for trading is subjective and depends on your trading style and objectives. However, a few popular indicators work well with Renko charts:
Moving Averages
Moving averages help smooth out price data and provide insight into the market's trend direction.
With Renko charts, using short-term and long-term moving averages can help identify entry and exit points when crossovers occur.
Relative Strength Index (RSI)
RSI is a momentum oscillator that measures the speed and change of price movements.
It changes with Renko charts because Renko charts filter out small price fluctuations, so RSI reflects clearer signals based on the underlying price action.
MACD (Moving Average Convergence Divergence)
MACD combines moving averages and measures the relationship between two exponential moving averages (EMA).
It can confirm trends identified on Renko charts and provide trade signals.
Parabolic SAR
Parabolic SAR helps identify potential reversals and can be effective with Renko charts to spot changes in market direction.
It works differently with Renko and Heikin Ashi charts due to the smoothing effects of these charts. Renko and Heikin Ashi charts filter price data differently, so the Parabolic SAR signals may vary depending on the chart type.
Can you backtest Renko?
Backtesting trading strategies on Renko charts can be tricky because the way Renko charts are constructed differs significantly from traditional candlestick charts. Here are the main problems that history testing on Renko charts can produce skewed results:
Time Insensitivity
Renko charts are based on price movements, not time intervals.
This can lead to misinterpretations, as the same historical price data may present different patterns on Renko and candlestick charts.
Data Availability
Reliable and detailed historical data for Renko charts can be hard to find, particularly from free sources.
Inaccurate or incomplete data can lead to skewed backtesting results.
Overfitting
Strategies that perform well on Renko charts may not perform as well on traditional candlestick charts due to the charts' different constructions.
Overfitting occurs when a strategy is too finely tuned to a particular dataset, resulting in poor performance in real-time trading.
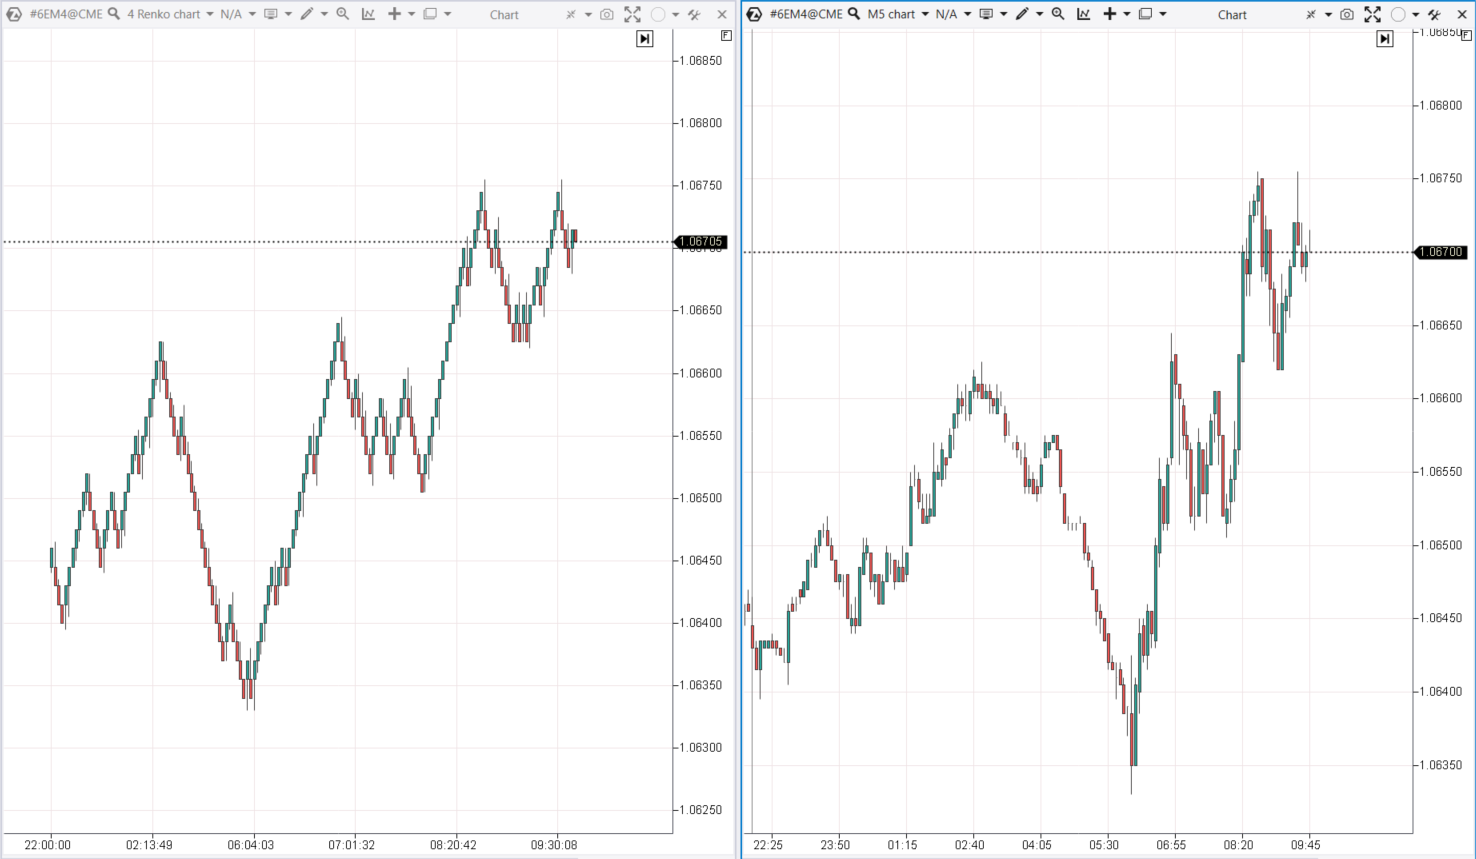
SuperTrend Strategy Example
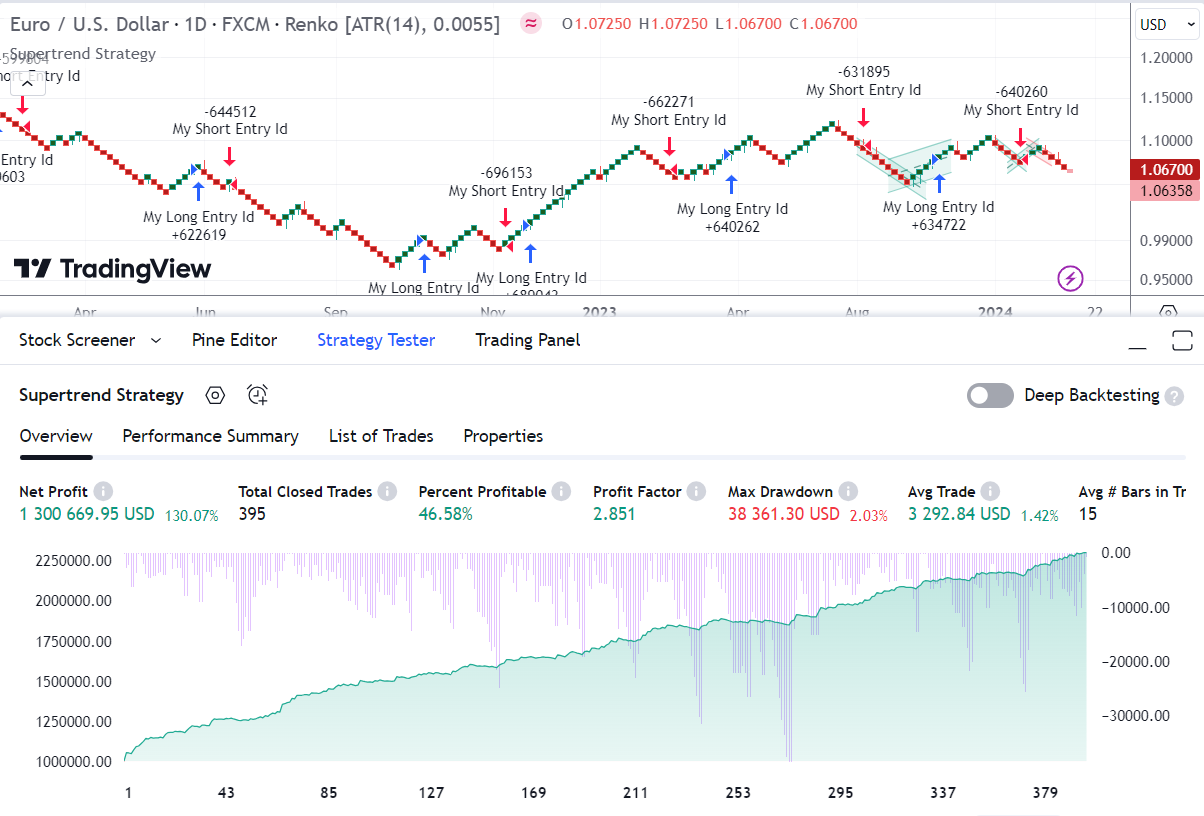 Supertrend strategy example
As shown in the example images, a simple SuperTrend strategy that appears profitable on Renko charts (above), may result in losses when applied to traditional candlestick charts (below).
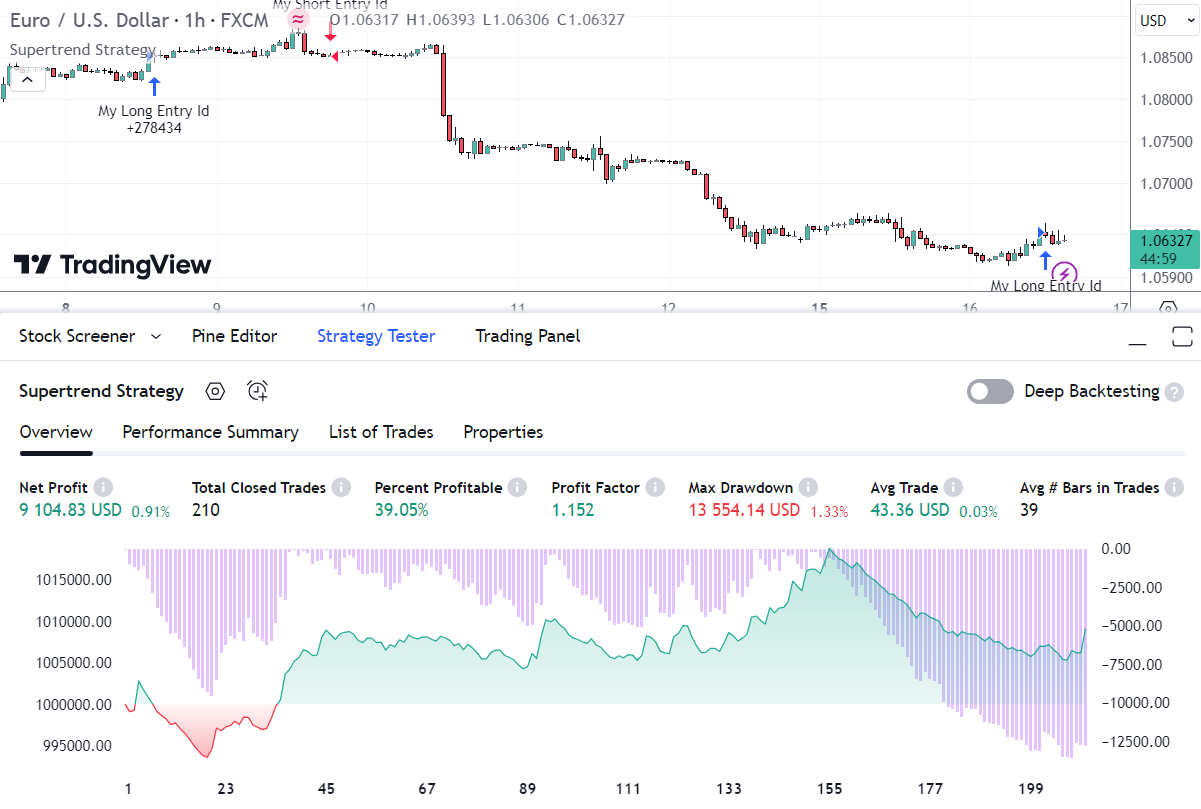 Supertrend strategy example
This disparity can lead traders to believe they have a profitable strategy when, in reality, it may not work in other trading contexts.
Do professional traders use Renko charts?
Professional traders may use Renko charts as one of their tools in their trading strategy, but they're not a replacement for other methods of technical analysis. Renko charts offer a simplified view of price movement, which can help traders focus on the trend and reduce noise. Traders use Renko patterns like double tops and double bottoms to spot possible trend reversals, and consolidation zones to identify periods of sideways movement. Breakouts, where price pushes through support or resistance levels, are also key for traders. However, many professionals also rely on traditional candlestick charts or combine Renko charts with other chart types for a more comprehensive view of market conditions.
What are the advantages and disadvantages of the Renko chart?
- Pros
- Cons
- Simplified chart view: Easier to understand price action and trends without noise.
- Clear trend identification: Easy to spot long-term trends due to the chart's design.
- Better support and resistance levels: Helps identify key levels where price may reverse.
- Filters out market noise: Removes small, insignificant price fluctuations.
- Provides clearer entry and exit points: Helps traders make decisions based on visual trends.
- Works well with other indicators: Can be combined with traditional indicators like RSI and moving averages for a more comprehensive analysis.
- Delays in showing trends: There can be a lag in updating the chart as it needs a significant price movement to form a new brick.
- Lacks detailed price data: Omits minor price movements, potentially missing important intraday swings.
- Not suitable for precise entries: Lacks the exact timing provided by traditional charts.
- Limited real-time data: Not as effective for short-term trading decisions.
- May require manual box size adjustments: Traders may need to fine-tune settings for specific assets or markets.
- Less common in trading platforms: Not all platforms offer Renko chart functionality, limiting accessibility.
A few practical remarks
Renko blocks can take quite a long time to form, for example, several hours or days, until the price passes the necessary distance. Because of this, it is extremely difficult to see the beginning of a sideways trend and fix an open position in time. The situation is similar with the trend reversal: while the reversal block is formed, you can be in a serious loss.
The Renko chart does not take into account volumes and does not show the volatility of the instrument. Renko charts give many false signals in volatile markets, especially during flat periods.
The block size should be periodically adapted to the current volatility. A particular block size may be optimal for past data, but that does not make it suitable for future prices. Blocks that are too large will show trend changes with a lag, blocks that are too small will draw attention to minor price changes.
As a rule of thumb, the size of a Renko block should not exceed 1.5-2 ATR. If there is a significant difference with traditional trend indicators, it is better to adjust the block size.
The Renko chart is a calculated visual representation of price information and should be used only as an indicator of trend direction and strength. A reversal on Renko requires mandatory confirmation by additional indicators, both trend and momentum. It is not possible to determine the entry point from this chart.
Renko charts can be a valuable tool for experienced traders

Renko charts can be a valuable tool for experienced traders who want a simplified view of market trends and movements. They can offer clearer visualizations of trends and support/resistance levels, which can aid in making trading decisions. However, due to their focus on larger price movements and lack of time-based data, Renko charts may not be the best option for traders seeking precision in entry and exit points. Integrating Renko charts with other indicators and traditional chart types can help traders make more informed decisions and improve overall strategy effectiveness.
Conclusion
Renko charts offer traders a distinct advantage by filtering out market noise and highlighting the most critical price movements. Unlike traditional candlestick or bar charts, Renko charts focus solely on price changes, allowing for clearer trend identification and more confident trading decisions. For instance, traders frequently use Renko charts to pinpoint support and resistance levels or to confirm trend reversals with greater accuracy. Embracing Renko charts as part of a broader technical analysis toolkit can empower traders to navigate volatile markets with greater clarity and conviction. Ultimately, those who master Renko chart interpretation can transform uncertainty into actionable insight, making smarter, more decisive trades.
FAQs
How does the choice of brick size affect trading signals on Renko charts?
Can Renko charts be combined with other technical indicators for enhanced analysis?
What types of market conditions are Renko charts best and least suited for?
Are there any risks in relying solely on Renko charts for trading decisions?
Editors' Top Picks and Insights

Tokenized stocks in the spotlight: How do they work and are they worth trading?

Do politicians make the best stock traders?

Crypto test drive: How automakers are exploring digital assets

Lindsey Graham death: U.S. senator’s crypto legacy

Tether under pressure: USDT in Europe, audit questions, and the fight for trust

Lean Ethereum: Why Buterin wants to rebuild the network
Related Articles
Team that worked on the article
Parshwa is a content expert and finance professional possessing deep knowledge of stock and options trading, technical and fundamental analysis, and equity research. As a Chartered Accountant Finalist, Parshwa also has expertise in Forex, crypto trading, and personal taxation.
Dr. BJ Johnson is a PhD in English Language and an editor with over 15 years of experience. He earned his degree in English Language in the U.S and the UK.
Mirjan Hipolito is a journalist and news editor at Traders Union. She is an expert crypto writer with five years of experience in the financial markets.
Forex leverage is a tool enabling traders to control larger positions with a relatively small amount of capital, amplifying potential profits and losses based on the chosen leverage ratio.
Fundamental analysis is a method or tool that investors use that seeks to determine the intrinsic value of a security by examining economic and financial factors. It considers macroeconomic factors such as the state of the economy and industry conditions.
The Stochastic Oscillator is a technical indicator used in financial analysis to gauge the momentum of a security's price and identify overbought or oversold conditions by comparing the closing price to a specified price range over a defined period.
Uptrend is a market condition in which prices are generally rising. Uptrends can be identified by using moving averages, trendlines, and support and resistance levels.
Bitcoin is a decentralized digital cryptocurrency that was created in 2009 by an anonymous individual or group using the pseudonym Satoshi Nakamoto. It operates on a technology called blockchain, which is a distributed ledger that records all transactions across a network of computers.

-
 Afghanistan
-
 Albania
-
 Algeria
-
 Angola
-
 Argentina
-
 Armenia
-
 Australia
-
 Austria
-
 Azerbaijan
-
 Bahamas
-
 Bahrain
-
 Bangladesh
-
 Belarus
-
 Belgium
-
 Bolivia
-
 Botswana
-
 Brazil
-
 Brunei
-
 Bulgaria
-
 Cambodia
-
 Cameroon
-
 Canada
-
 Chile
Chile
-
 China
China
-
 Colombia
-
 Congo
Congo
-
 Costa Rica
-
 Cote d'Ivoire
-
 Croatia
-
 Cuba
Cuba
-
 Cyprus
-
 Czechia
-
 DR Congo
-
 Denmark
-
 Dominican Republic
-
 Ecuador
-
 Egypt
Egypt
-
 El Salvador
-
 Estonia
-
 Eswatini
-
 Ethiopia
-
 Finland
-
 France
-
 Georgia
-
 Germany
-
 Ghana
Ghana
-
 Greece
-
 Haiti
Haiti
-
 Hong Kong
-
 Hungary
-
 India
India
-
 Indonesia
-
 Iran, Islamic republic
-
 Iraq
Iraq
-
 Ireland
-
 Israel
-
 Italy
Italy
-
 Jamaica
-
 Japan
Japan
-
 Jordan
-
 Kazakhstan
-
 Kenya
Kenya
-
 Korea
Korea
-
 Kuwait
-
 Kyrgyzstan
-
 Laos
Laos
-
 Latvia
-
 Lebanon
-
 Lesotho
-
 Libya
Libya
-
 Lithuania
-
 Luxembourg
-
 Madagascar
-
 Malaysia
-
 Malta
Malta
-
 Mauritius
-
 Mexico
-
 Moldova
-
 Mongolia
-
 Montenegro
-
 Morocco
-
 Mozambique
-
 Myanmar
-
 Namibia
-
 Nepal
Nepal
-
 Netherlands
-
 New Zealand
-
 Nigeria
-
 North Macedonia
-
 Norway
-
 Oman
Oman
-
 Pakistan
-
 Palestine
-
 Panama
-
 Papua New Guinea
-
 Paraguay
-
 Peru
Peru
-
 Philippines
-
 Poland
-
 Portugal
-
 Puerto Rico
-
 Qatar
Qatar
-
 Reunion
-
 Romania
-
 Rwanda
-
 Saudi Arabia
-
 Serbia
-
 Singapore
-
 Slovakia
-
 Slovenia
-
 Somalia
-
 South Africa
-
 Spain
Spain
-
 Sri Lanka
-
 Sweden
-
 Switzerland
-
 Syria
Syria
-
 Taiwan
-
 Tajikistan
-
 Tanzania
-
 Thailand
-
 Trinidad and Tobago
-
 Tunisia
-
 Turkey
-
 UAE
UAE
-
 Uganda
-
 Ukraine
-
 United Kingdom
-
United States
-
 Uruguay
-
 Uzbekistan
-
 Venezuela
-
 Vietnam
-
 Yemen
Yemen
-
 Zambia
-
 Zimbabwe
- Forex
- Crypto
