How To Trade Using The Hanging Man Candlestick Pattern

The Hanging Man is a bearish reversal candlestick pattern. It features a small upper body with a long lower shadow.
-
Typically, it requires confirmation from the next candlestick's bearish close
-
Stop loss is recommended above the Hanging Man's high
-
Exit strategy should consider subsequent price action and support levels
-
Statistically, the success rate of this pattern is extremely variable. According to various studies, the Hanging Man pattern can give a 56% success rate as a bullish continuation pattern and an 86% probability of a bearish reversal
In the intricate world of trading, both novices and veterans alike often grapple with deciphering the myriad of patterns that can forecast market movements. One such pattern, elusive yet significant for its predictive value, is the hanging man candlestick. This article aims to demystify the hanging man candlestick pattern, offering traders a clearer understanding of its implications and how it can be harnessed to refine trading strategies.
By elucidating this pattern, we seek to equip traders with the knowledge to spot potential market downturns, enhancing their decision-making arsenal.
-
Is a hanging man bullish or bearish?
A hanging man is bearish, suggesting that despite bullish efforts during an uptrend, bears may be gaining control.
-
Why is it called hanging man?
It is called a hanging man because the pattern resembles a figure with dangling legs, reflecting the market's failed attempt to push the price higher.
-
What is a double hanging man candlestick pattern?
A double hanging man candlestick pattern involves two consecutive hanging man patterns, which can indicate an even stronger signal of a potential bearish reversal.
What is the meaning of the hanging man in trading?
At its core, the hanging man candlestick is a bearish reversal pattern that emerges in an uptrend, hinting at a potential swing in momentum towards the downside. It is characterized by a small body at the upper end of the trading range, with a significant lower shadow or wick that is at least twice the length of the body.
The TradingView platform contains an indicator to identify the Hanging Man pattern
This configuration suggests that, despite the buying pressure during the trading period, sellers managed to push the price down substantially before the close, signaling weakening buyer momentum.
How to identify
To accurately identify a hanging man pattern, traders should look for a candlestick with a small upper body, which indicates a narrow range between the opening and closing prices. The presence of a long lower shadow signifies that the sellers have attempted to drive the price down, a key characteristic of this pattern. Importantly, for a candlestick to qualify as a hanging man, it must appear after an uptrend, as its predictive power is derived from signaling a potential reversal of bullish momentum. Identifying this pattern can be a critical skill for traders aiming to anticipate market shifts and adjust their strategies accordingly.
Best Forex Brokers


Market psychology and the Hanging Man pattern
The most confident signal occurs when the pattern is formed on the D1 timeframe.
It is assumed that on the day of pattern formation, trading starts in the zone of price highs, but further on during the day there is a strong volume pressure of bears on the price. Buyers are trying to fight, as they believe that this is just a technical correction.
After active selling by the end of the trading session there is a strong counterattack of buyers, and outwardly it seems that the bulls have regained their positions. But bears have already completely controlled the market, and the strength of bulls is exhausted.
If the next day trades open below the body of the pattern, it means that the main part of the positions of the "market plankton" (small traders) is already at a loss.
On the background of the growing panic there is a cascade closing of positions to buy, which leads to a strong fall in price. This is a real price reversal, after which the market potential finally becomes bearish.
How to Use The Hanging Man Candlestick Pattern For Trading
The hanging man candlestick pattern serves as a red flag to traders, signaling potential price declines. However, to capitalize on its insights effectively, it's crucial to understand not just its appearance, but also how to confirm its validity and strategically act on it.
-
Confirmation is Key: Before making any trading decision based on a hanging man pattern, wait for confirmation. This usually comes in the form of a bearish candlestick closing below the hanging man's closing price on the following day. This confirmation suggests that the sellers are indeed taking control and that the pattern wasn't a false signal of a market downturn
-
Entry Points: Once the pattern is confirmed, traders may consider entering a short position. The logic here is straightforward: with the trend potentially reversing from bullish to bearish, entering a short position can allow traders to capitalize on the anticipated decline in prices
-
Stop Loss Placement: To manage risk effectively, placing a stop loss just above the high of the hanging man candlestick is advisable. This placement ensures that if the price unexpectedly moves against the anticipated direction, losses can be minimized, protecting the trader's capital
-
Exit Strategy: Deciding when to exit a trade is as critical as knowing when to enter. Traders might set a target based on key support levels below the hanging man or adjust their exit strategy based on the price action that follows. If the market shows signs of reversing back to a bullish trend, it may be wise to close the position to avoid potential losses
Examples from Forex and Crypto
Hanging Man pattern in the Forex market: The picture below shows an example of the Hanged Man (HM) pattern on the EUR/USD hourly chart.
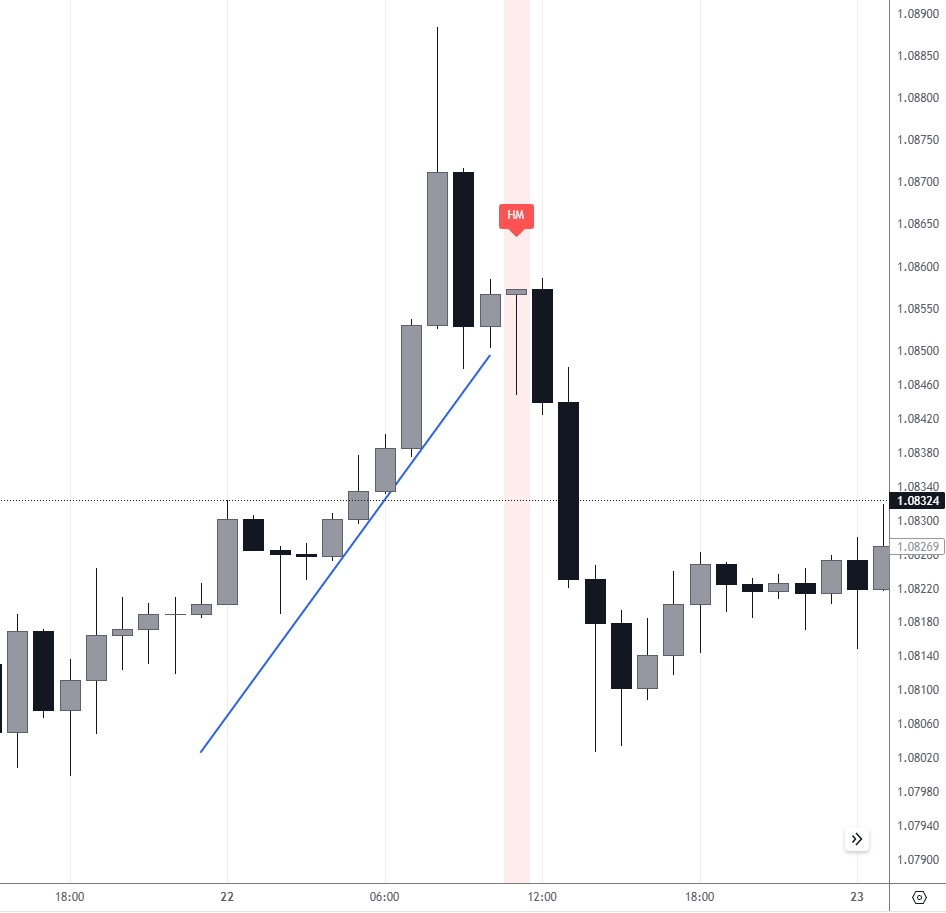
Hanged Man pattern on the EUR/USD hourly chart
In this case, the HM pattern appeared after a bearish engulfment pattern amid a period of rising prices. The pattern reflects the activity of sellers, who are trying to break the trailing line (shown in blue color).
This could be a signal to enter a short position, with a stop loss placed above the high of the hanging man and a target set at the next significant support level.
Note that the pattern appeared at the beginning of the European session and became an important factor that determined the intraday trend.
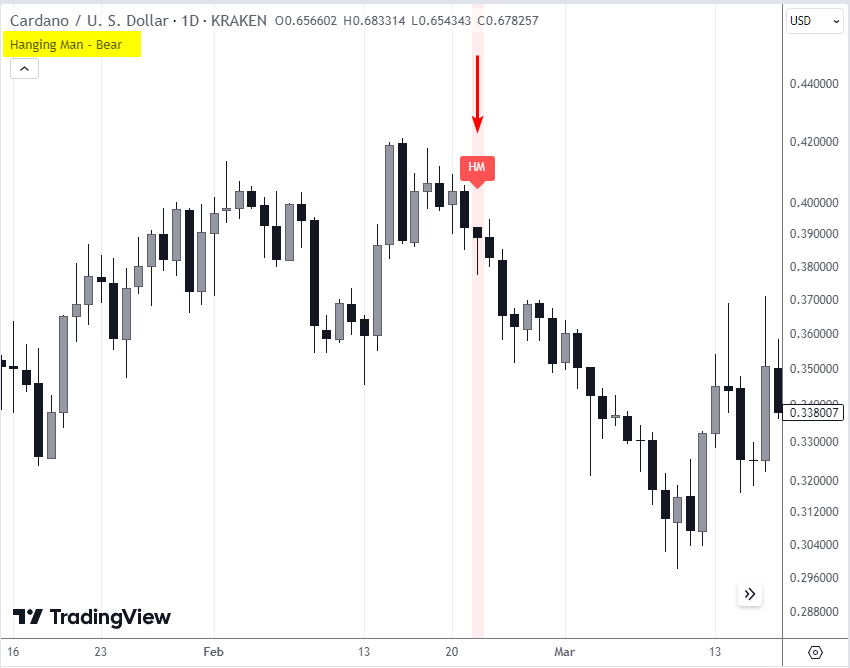
Hanging Man pattern in the Cryptocurrency market: The picture below shows an example of a pattern from a daily Bitcoin price chart.
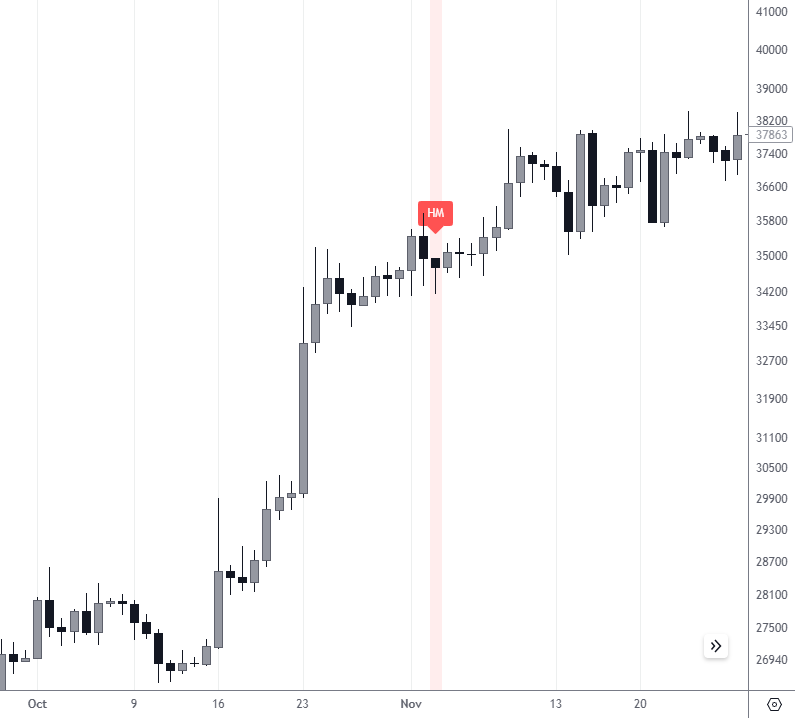
The failed pattern
This example reflects the importance of getting confirmation when trading using the Hanging Man pattern. The danger is that by opening a short position in this case, you are trading against the main up-warding trend, which means increased risk.
The conclusion may not only be to use stop losses on a mandatory basis, but that a failed bearish pattern can be used as a bullish pattern - the bears have failed in their attempt to push the price down and this candle has become a support area for BTC/USD price.
How accurate is the hanging man candlestick pattern?
The Hanging Man candlestick pattern is considered a bearish reversal indicator in Forex trading, but its accuracy can vary depending on market conditions and other technical indicators used in conjunction with the pattern.
-
According to the information provided by thepatternsite.com, the Hanging Man pattern actually has a bullish continuation rate of 59%, suggesting that its reliability as a bearish reversal may be questionable. This can be explained by the fact that the HM pattern reflects the completed bearish correction on the lower timeframe within the senior bullish trend
-
On the other hand, according to candlescanner.com, the effectiveness of the Hanging Man bearish pattern on the daily chart of the S&P 500 is quite high: in 20 years, about 20 thousand patterns have been found and only 14% of the time it was false. Which means that in 86% of cases it indicated a price decline of various sizes
So, it should be noted that the accuracy of the Hanging Man pattern, like any other technical analysis tool, is not absolute and should be used in conjunction with other indicators and market analysis. Traders should also be aware that the pattern is not a guarantee of a price reversal and should use risk management strategies such as stop-loss orders to protect their capital.
What is the difference between Hammer and Hanging Man?
The candlestick patterns commonly referred to as the “Hammer” and the “Hanging Man” are both significant indicators in technical analysis. Despite their similar appearance, they occur in different trend contexts and have distinct implications for market sentiment.
| Pattern | Bullish or bearish | Difference |
|---|---|---|
Hanging Man |
Bearish |
Occurs at the end of an uptrend. It signals potential reversal to a downtrend due to selling pressure |
Hammer |
Bullish |
Appears at the end of a downtrend. Indicates potential reversal to an uptrend as buyers step in |
Doji |
Neutral |
Represents indecision. The open and close prices are virtually the same, signaling a tug-of-war between buyers and sellers |
Bearish |
Forms during an uptrend. It predicts a bearish reversal with its small lower body and long upper shadow, indicating a rejection of higher prices |
Expert Opinion:
“When analyzing candlestick patterns like the Hammer and Hanging Man, context is everything. A Hammer signals bullish potential in a downtrend, while a Hanging Man warns of possible bearish reversal after an uptrend. Always look for confirmation with additional patterns and indicators to validate your trades”

Summary
The Hanging Man candlestick pattern is an indicator of potential market reversals, signaling trader caution in an uptrend. Its reliability, while statistically significant, should be bolstered with confirmation and coupled with sound risk management strategies. Comparatively, understanding the nuances between the Hanging Man and its counterparts like the Hammer, Doji, and Shooting Star is crucial for interpreting market sentiment.
A judicious use of these patterns, when confirmed by subsequent price action and integrated with other technical analysis tools, can enhance trading strategies and decision-making, steering traders through the volatile terrains of Forex and crypto markets with greater confidence.
Glossary for novice traders
-
1
Risk Management
Risk management is a risk management model that involves controlling potential losses while maximizing profits. The main risk management tools are stop loss, take profit, calculation of position volume taking into account leverage and pip value.
-
2
CFD
CFD is a contract between an investor/trader and seller that demonstrates that the trader will need to pay the price difference between the current value of the asset and its value at the time of contract to the seller.
-
3
Forex Trading
Forex trading, short for foreign exchange trading, is the practice of buying and selling currencies in the global foreign exchange market with the aim of profiting from fluctuations in exchange rates. Traders speculate on whether one currency will rise or fall in value relative to another currency and make trading decisions accordingly. However, beware that trading carries risks, and you can lose your whole capital.
-
4
Short selling
Short selling in trading involves selling an asset the trader doesn't own, anticipating its price will decrease, allowing them to repurchase it at a lower price to profit from the difference.
-
5
Forex indicators
Forex indicators are tools used by traders to analyze market data, often based on technical and/or fundamental factors, to make informed trading decisions.
Related Articles


Team that worked on the article

Vuk stands at the forefront of financial journalism, blending over six years of crypto investing experience with profound insights gained from navigating two bull/bear cycles. A dedicated content writer, Vuk has contributed to a myriad of publications and projects. His journey from an English language graduate to a sought-after voice in finance reflects his passion for demystifying complex financial concepts, making him a helpful guide for both newcomers and seasoned investors.

Dr. BJ Johnson is a PhD in English Language and an editor with over 15 years of experience. He earned his degree in English Language in the U.S and the UK. In 2020, Dr. Johnson joined the Traders Union team. Since then, he has created over 100 exclusive articles and edited over 300 articles of other authors.

Mirjan Hipolito is a journalist and news editor at Traders Union. She is an expert crypto writer with five years of experience in the financial markets. Her specialties are daily market news, price predictions, and Initial Coin Offerings (ICO).
