How To Use The H-pattern In Trading


Editorial Note: While we adhere to strict Editorial Integrity, this post may contain references to products from our partners. Here's an explanation for How We Make Money. None of the data and information on this webpage constitutes investment advice according to our Disclaimer.
The H-pattern may not be widely used by traders, but it is known for its steep decline, reversals, and buyers' capricious sentiments.
- Features: It signals bearish reversals and is applicable across multiple financial markets
- Pros: It gives clear trading signals and integrates with multiple indicators
- Cons: Its signals may need confirmation by indicators. They are subjective and difficult to detect manually
The H-pattern is an informal chart formation in technical analysis that resembles the letter “h.” It can appear in stocks, Forex, cryptocurrencies, and other markets. Traders usually interpret it as a continuation structure and use it as a signal for further analysis.
Once identified, a trader can open a position or conduct further analysis to confirm the signal before trading.
The H-pattern will be explained with examples. We will also look at how it is traded and discuss its merits and demerits.
Understanding the H-pattern
An H-pattern is formed when price action makes a steep decline, then bounces back to retest recent lows and finally drops beyond the initial lows. The explanation is that bullish market participants move in and start buying a declining asset, but then discover that the demand is not sustainable. As a result, many of them exit their positions. The trading volume decreases and the price also declines until it reaches new lows.
 H-pattern
Follow the steps below to manually identify an H-pattern on a chart:
Identify a steep bearish trend that reaches a support level
The price recovers at the support and starts a bullish rebound
But then it hits a resistance level and reverses
The bearish run resumes and crosses the support level. This confirms the H-pattern
Indicators like Moving Averages (MAs), Moving Average Convergence/Divergence (MACD), Aroon, and many others can also help to recognize H-patterns.
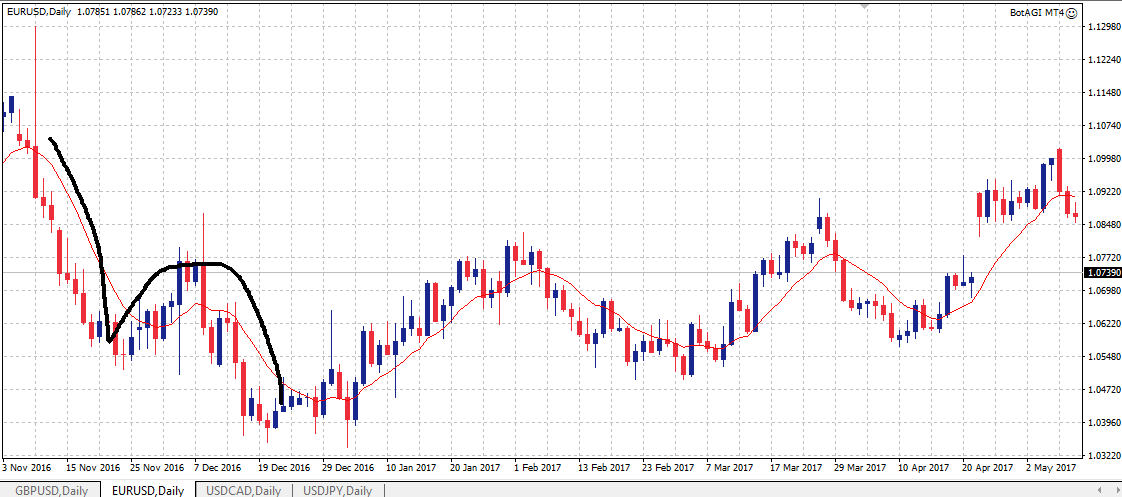 An H-pattern identified by an MA on a EURUSD chart
How do you trade H-patterns?
Generally, H-patterns work better in bearish markets. Some traders short the market right from the bearish reversal at the top of the “h” curve, for example, use an entry point at the Fibo level of 50%. But the most popular way to trade the H-pattern is to open a sell position after the pattern is confirmed.
Below is a daily ETH/USD chart. An H-pattern has been identified and sketched into the chart.
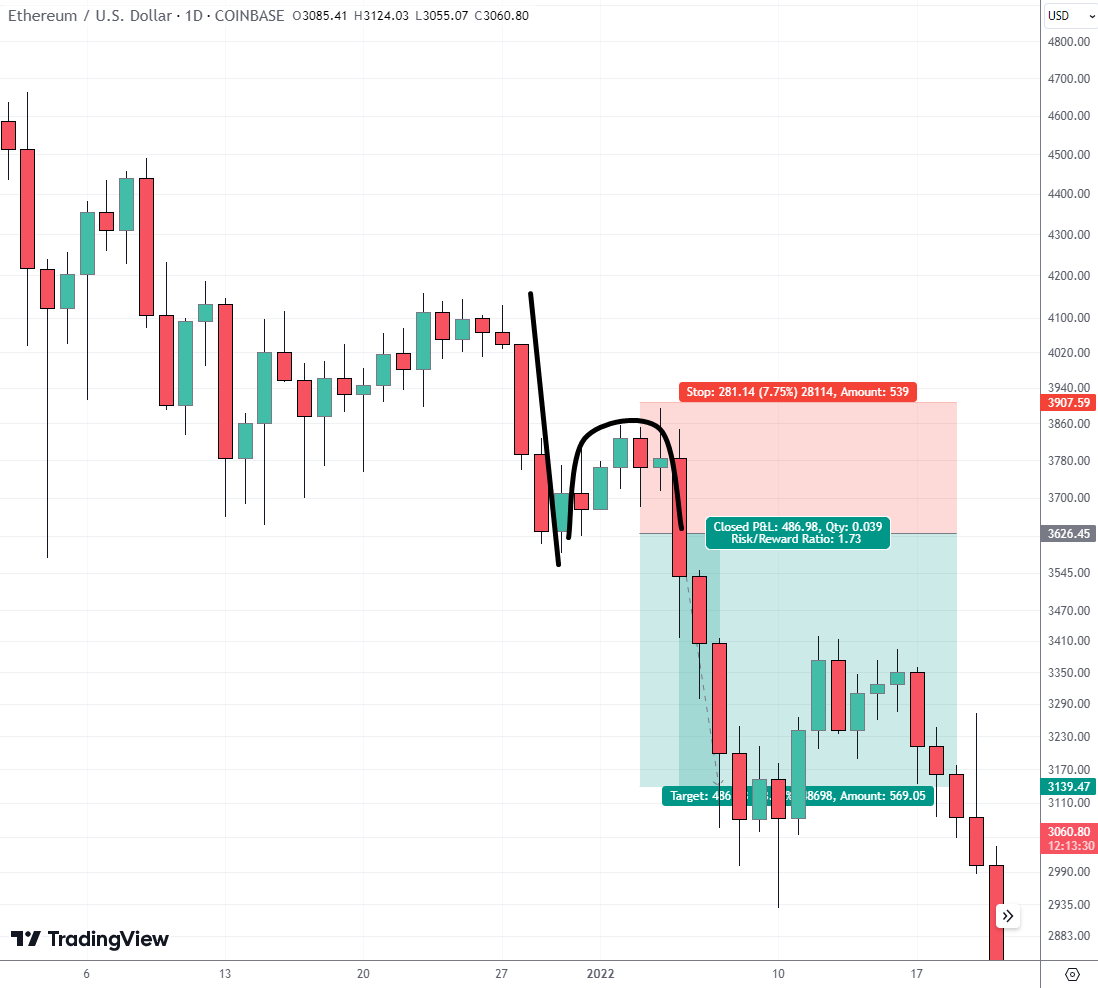 An H-pattern on an ETH/USD chart
The chart segment below displays 3 major points of the H-pattern:
The base of the “h”, which is the lowest price before the reversal to an uptrend
The highest point of the arc made by the “h” before a bearish reversal
The point where the price hits the base again
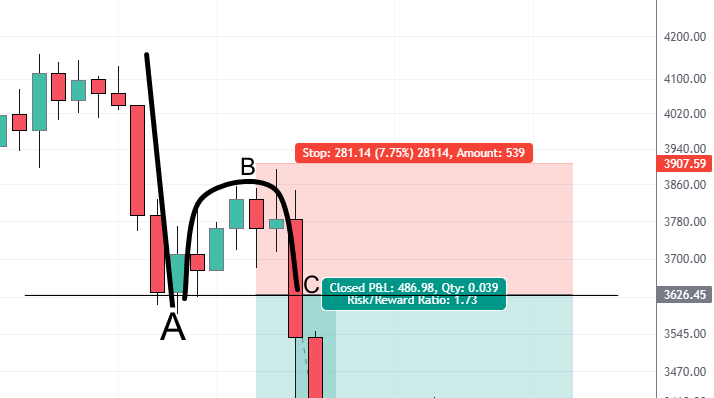 An H-pattern on an ETH/USD chart
On the chart, the H-pattern is confirmed when the price hits the support level again at 3626.45, completing the “h” shape. This should be the entry price for a short position.
The stop loss should be close to the top of the curve (B) depending on the trader’s strategy. We chose a little above it, at a price level of 3907.59.
Risk = 3907.59 – 3626.45 = 281.14
Next, we set the take profit to reflect the price target or risk/reward. Remember that cryptos are volatile and we are using a daily timeframe. So, we can go a little below 1:2
Reward = 3626.45 – 3139.47 = 486.96
So, the risk/reward ratio = 281.14/486.96 = 1:1.73
Of course, we could have set the stop loss at a lower price and risked less than 281.14, thereby increasing the risk/reward ratio. But the problem here is that prices fluctuate a lot and the stop loss might be triggered earlier than expected. If this happens, we end up with a loss. So, setting a wide stop loss increases the chance of success.
Tips to improve the quality of signals
Use indicators: For example, MACD or the Relative Strength Index ( RSI). Apart from helping to confirm H-patterns, they can also help confirm sell signals
Check the fundamentals: Make sure there are no relevant news releases or events before trading
Timeframe: If you use smaller timeframes like M15, H1, or 4-hourly, the signals might easily fail compared to when you trade on daily or weekly timeframes.
Oleg Pylypenko says that a true H-pattern refers to a situation where price is moving in a bear market and meets a support level. And this support is sufficient for the price to form a rebound, but not enough for the market to become bullish. To confirm the pattern, pay attention to the volumes - when the price rises on a bounce, the volumes should decrease, indicating weakness in demand, and when it falls, the volumes should increase, because then the volumes indicate the strength of the sellers' pressure. In my opinion, the H-pattern can also be compared to the ‘dead cat bounce’ pattern.
What is a stop loss for an H-pattern?
Stop loss is an order type that triggers a close order when a preset price is reached. It is a risk management tool used by traders to automatically exit a losing position. For an H-pattern, a stop loss is used to cut off losses in case the market reverses against the trader’s position.
The trader specifies his risk tolerance by inputting the stop-loss price when placing the order. It can also be modified after the order is placed.
In this pattern, stop loss is usually placed above the bend, but this rule should be adapted to specific market conditions, for example, find a level for stop loss on the lower timeframe.
Before applying the H-pattern in real trading, it’s important to select a trustworthy broker that offers fast order execution, stable platforms, and transparent trading conditions. Below is a comparison table of leading Forex and crypto brokers that provide suitable environments for technical trading strategies like the H-pattern.
| zForex | Plus500 | OANDA | Trading.com USA | FOREX.com | |
|---|---|---|---|---|---|
|
Demo |
Yes | Yes | Yes | Yes | Yes |
|
Min. deposit, $ |
10 | 100 | No | 50 | 100 |
|
Max. leverage |
1:1000 | 1:300 | 1:200 | 1:50 | 1:50 |
|
Standard EUR/USD spread |
0.3 | 0.7 | 0.3 | 1.1 | 1.0 |
|
Deposit fee, % |
No | No | No | No | No |
|
Withdrawal fee, % |
No | No | No | No | No |
|
Max. Regulation Level |
Not regulated | Tier-1 | Tier-1 | Tier-1 | Tier-1 |
|
TU overall score |
8.05 | 7.57 | 6.89 | 6.15 | 6.87 |
|
Open an account |
Go to broker Your capital is at risk.
|
Go to broker 80% of retail CFD accounts lose money. |
Go to broker Your capital is at risk. |
Go to broker Your capital is at risk. |
Study review |
Example of an H-pattern in Forex
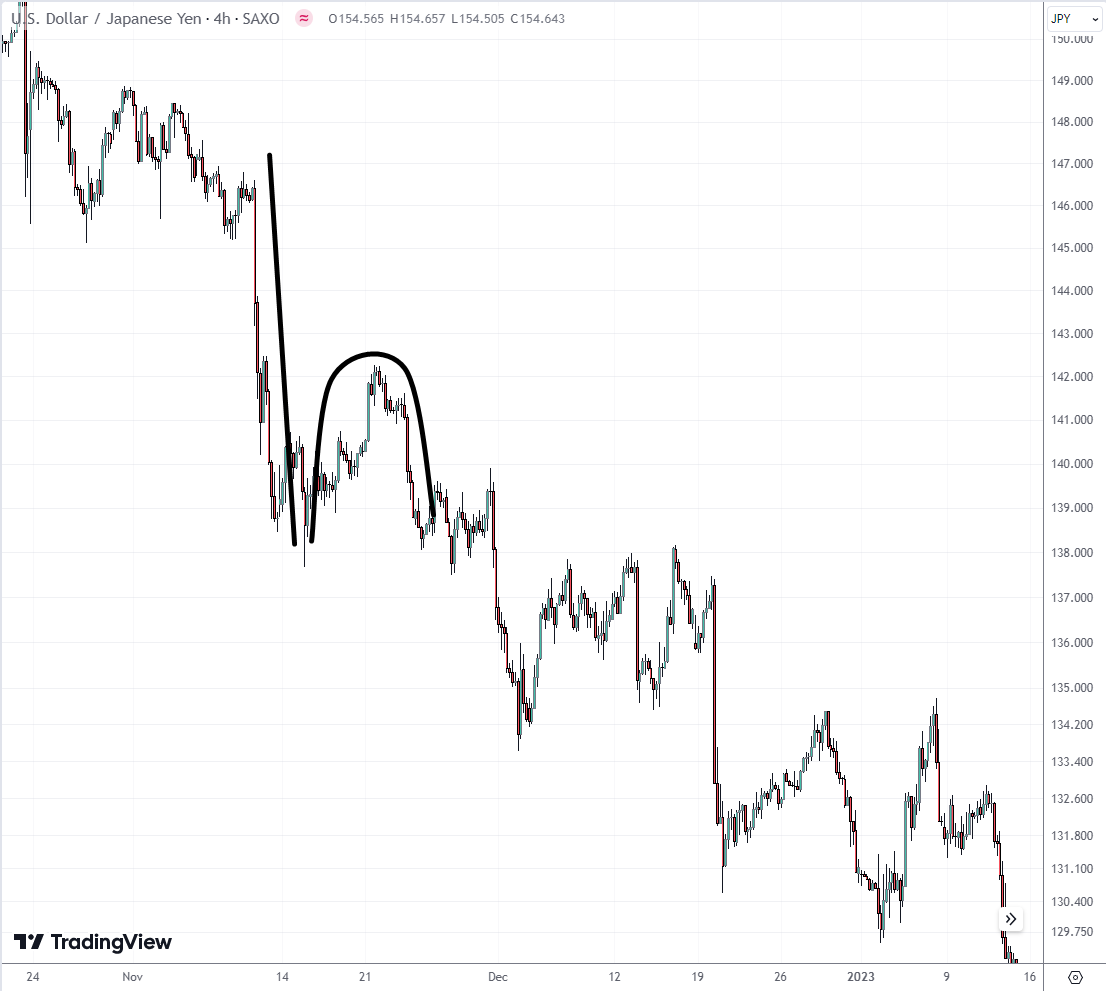
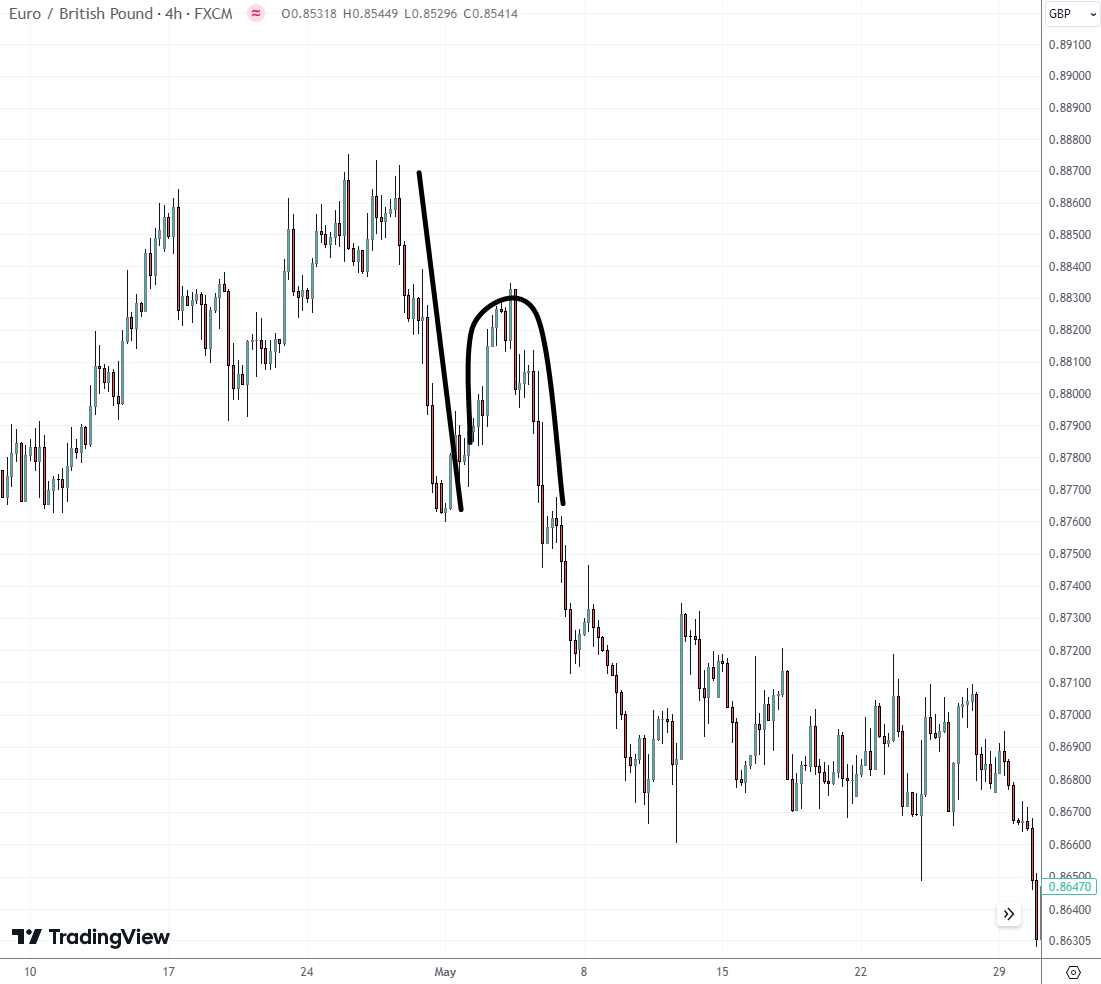
The chart below shows the formation of an H-pattern on a 4-hour chart of the EUR/GBP currency pair. The H-pattern has been identified and sketched into the chart.
 An H-pattern on a EUR/GBP chart
Initially, the trend was moving upwards until a steep decline, which formed the stroke of the emerging H-pattern. Then, there was a rebound as the price rallied upwards for a while before declining again. This time, it dropped below the stroke of the “h”, confirming the pattern. So, traders could quickly go short on the currency pair once the pattern was confirmed.
Note: a bearish breakout of the first low may be formed too quickly, so when planning a trade, you can use a pending sell stop order.
What is the inverse H-pattern?
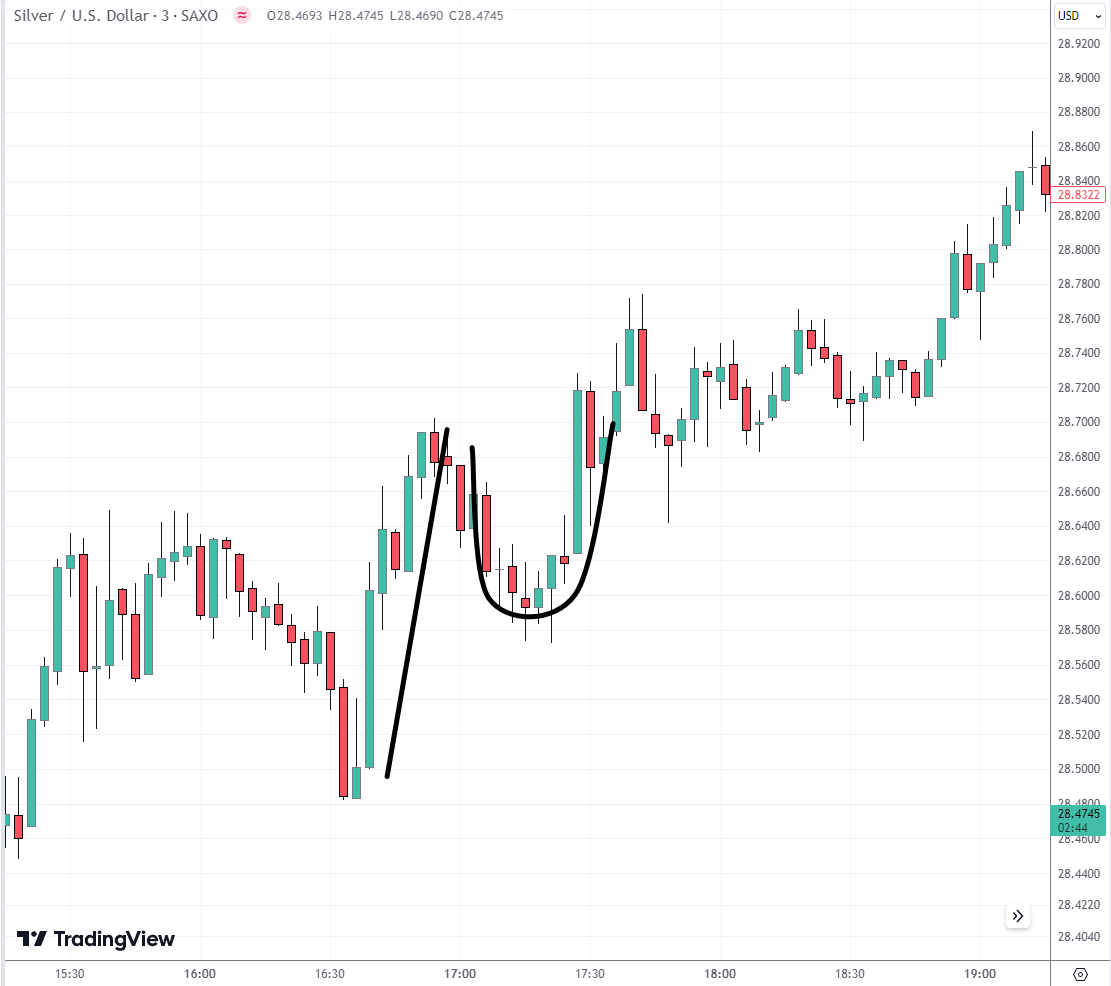
Just as the name sounds, the inverse H-pattern is formed when price action forms a shape that looks like an inverted “h”. It means that the price rose sharply and hit a high point, forming the first resistance level. The price then reversed moderately before making new highs and breaking the first resistance level.
 An inverse H-pattern on an XAG/USD chart
Trading the inverse H-pattern is similar to trading the regular H-pattern, except that the same principles are applied the opposite way.
 An inverse H-pattern on an XAG/USD chart
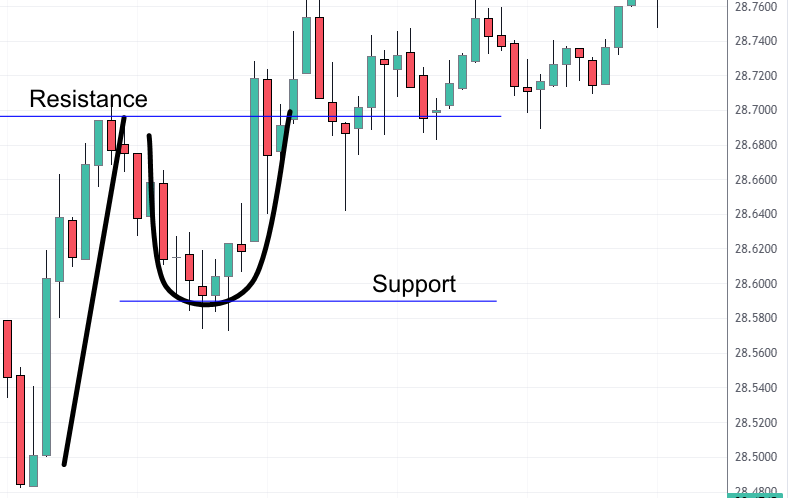
Once the pattern is confirmed as the bullish trend breaks through the initial resistance, we open a buy position. The stop loss can be placed around the support level. Take profit can be set using the trader's reward/risk ratio. Some traders use Fibonacci levels to determine the stop-loss and take-profit prices.
Example of a failed H-pattern
It is very important to accurately determine the H-pattern on a chart before trading it. Often, what seemed like anH-pattern may fail to meet one of the criteria to qualify as the pattern. Note that a failed H-pattern may result in another price action pattern. So, traders usually learn how to use a lot of patterns, especially as many of them are related.
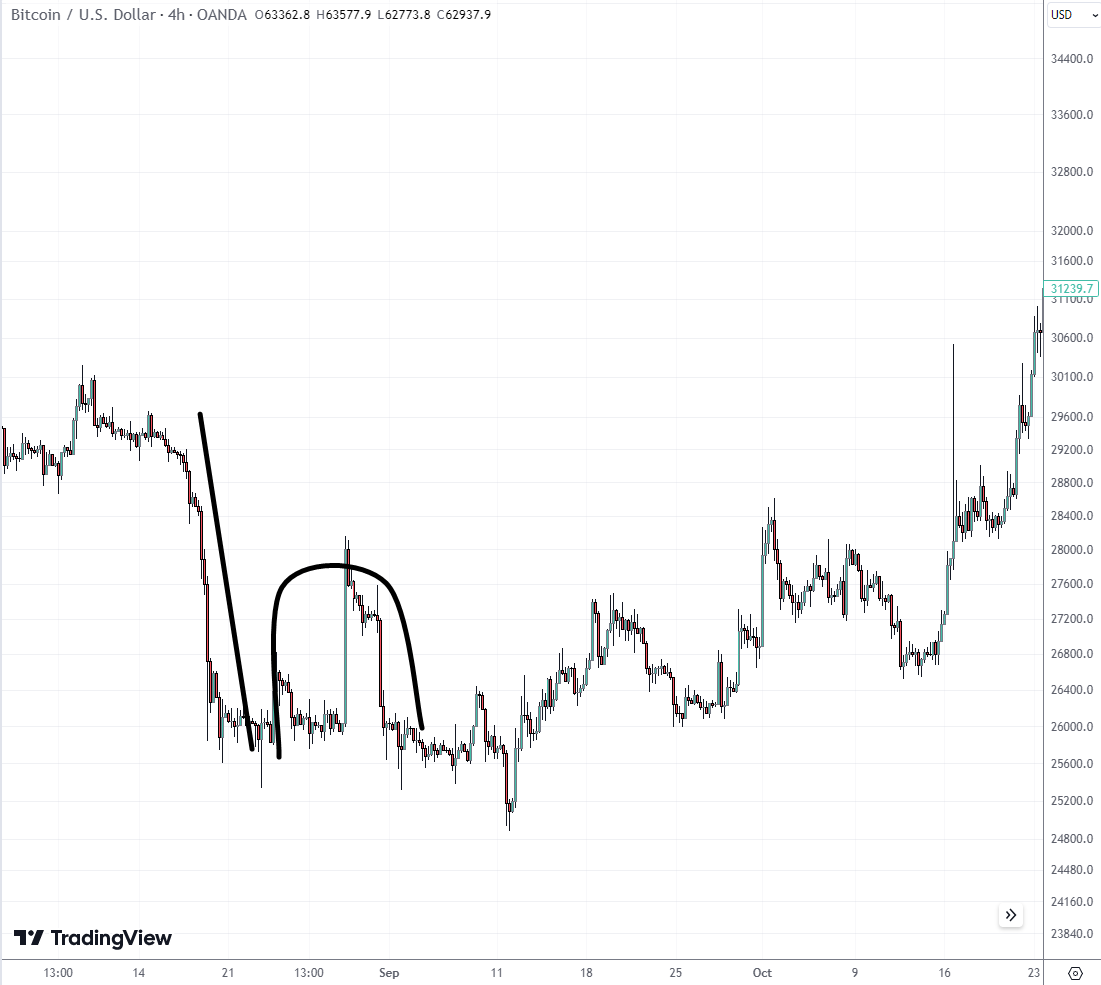 A failed H-pattern on a BTC/USD chart
The chart above has a steep decline, but no immediate reversal because there was a little consolidation period. When the price dropped again, it did not clearly break the initial support at the stroke of the “h”. This "failed H-pattern" can no longer be traded with this strategy because the price went below the first low, but then recovered - then shorts should think that the sellers have failed to resume the downtrend, and continuing to hold the short may not be a good idea.
Should I trade the H-pattern?
Before using the H-pattern, it is best to rigorously test your strategy on a demo or mini account. This way you will see if the strategy fits your personality, gain firsthand experience, and hone your trading skills.
Avoid trading an asset if you don’t know its current fundamentals. The news can affect market sentiments and cause the H-pattern to fail.
If you are a manual trader who relies on technical analysis, then adding the H-pattern to your arsenal is a good idea. However, trading based on signals generated solely from H-patterns is not recommended. It is best to also use other trading tools or indicators like MACD, RSI, etc.
Benefits of using the H-pattern:
It does not depend on the type of financial market, consistently effective on both low-liquid and volatile trading assets - the Forex, stocks, futures, cryptos etc, It works with multiple indicators
It generates signals with a high probability of profit
It indicates bearish continuation in financial markets
Downsides of using the H-pattern:
It can give false signals
Locating it manually on charts can be time-consuming and involve human errors
Expert opinion

After identifying a potential H-pattern, use indicators to confirm the downtrend and patiently wait for the price to hit the support level again before opening a position. You can use a pending order to automate your market entry.
Do not forget that your primary focus is on risk management and preserving your trading capital.
Conclusion
In summary, the H-pattern stands out as a reliable bearish continuation signal in technical analysis, offering traders a clear roadmap for identifying market downtrends. By visually recognizing the characteristic 'H' formation, traders can anticipate further declines and position themselves accordingly. For instance, successful use of the H-pattern can be seen when the pattern forms after a sharp drop, retraces slightly, and then breaks down further—confirming seller dominance. Mastery of this pattern empowers traders to act with conviction, remembering that consistent application of such classic setups can provide a significant edge in navigating ever-volatile markets.
FAQs
In which financial markets can the H-pattern be effectively used?
How do trading volumes help confirm the validity of an H-pattern?
What are common mistakes traders make when identifying the H-pattern?
How does timeframe selection impact the reliability of H-pattern signals?
Editors' Top Picks and Insights

Do politicians make the best stock traders?

Crypto test drive: How automakers are exploring digital assets

Lindsey Graham death: U.S. senator’s crypto legacy

Tether under pressure: USDT in Europe, audit questions, and the fight for trust

Lean Ethereum: Why Buterin wants to rebuild the network

SK Hynix debuts on Nasdaq: Largest U.S. offering by foreign company
Related Articles
Team that worked on the article
Kelechi started as an IT personnel, Network Engineer, and Web Designer. His quest for investments and wealth creation led him to the financial markets.
Dr. BJ Johnson is a PhD in English Language and an editor with over 15 years of experience. He earned his degree in English Language in the U.S and the UK.
Chinmay Soni is a financial analyst with more than 5 years of experience in working with stocks, Forex, derivatives, and other assets. As a founder of a boutique research firm and an active researcher, he covers various industries and fields, providing insights backed by statistical data.
Ethereum is a decentralized blockchain platform and cryptocurrency that was proposed by Vitalik Buterin in late 2013 and development began in early 2014. It was designed as a versatile platform for creating decentralized applications (DApps) and smart contracts.
CFD is a contract between an investor/trader and seller that demonstrates that the trader will need to pay the price difference between the current value of the asset and its value at the time of contract to the seller.
Forex indicators are tools used by traders to analyze market data, often based on technical and/or fundamental factors, to make informed trading decisions.
Cryptocurrency is a type of digital or virtual currency that relies on cryptography for security. Unlike traditional currencies issued by governments (fiat currencies), cryptocurrencies operate on decentralized networks, typically based on blockchain technology.
Take-Profit order is a type of trading order that instructs a broker to close a position once the market reaches a specified profit level.

-
 Afghanistan
-
 Albania
-
 Algeria
-
 Angola
-
 Argentina
-
 Armenia
-
 Australia
-
 Austria
-
 Azerbaijan
-
 Bahamas
-
 Bahrain
-
 Bangladesh
-
 Belarus
-
 Belgium
-
 Bolivia
-
 Botswana
-
 Brazil
-
 Brunei
-
 Bulgaria
-
 Cambodia
-
 Cameroon
-
 Canada
-
 Chile
Chile
-
 China
China
-
 Colombia
-
 Congo
Congo
-
 Costa Rica
-
 Cote d'Ivoire
-
 Croatia
-
 Cuba
Cuba
-
 Cyprus
-
 Czechia
-
 DR Congo
-
 Denmark
-
 Dominican Republic
-
 Ecuador
-
 Egypt
Egypt
-
 El Salvador
-
 Estonia
-
 Eswatini
-
 Ethiopia
-
 Finland
-
 France
-
 Georgia
-
 Germany
-
 Ghana
Ghana
-
 Greece
-
 Haiti
Haiti
-
 Hong Kong
-
 Hungary
-
 India
India
-
 Indonesia
-
 Iran, Islamic republic
-
 Iraq
Iraq
-
 Ireland
-
 Israel
-
 Italy
Italy
-
 Jamaica
-
 Japan
Japan
-
 Jordan
-
 Kazakhstan
-
 Kenya
Kenya
-
 Korea
Korea
-
 Kuwait
-
 Kyrgyzstan
-
 Laos
Laos
-
 Latvia
-
 Lebanon
-
 Lesotho
-
 Libya
Libya
-
 Lithuania
-
 Luxembourg
-
 Madagascar
-
 Malaysia
-
 Malta
Malta
-
 Mauritius
-
 Mexico
-
 Moldova
-
 Mongolia
-
 Montenegro
-
 Morocco
-
 Mozambique
-
 Myanmar
-
 Namibia
-
 Nepal
Nepal
-
 Netherlands
-
 New Zealand
-
 Nigeria
-
 North Macedonia
-
 Norway
-
 Oman
Oman
-
 Pakistan
-
 Palestine
-
 Panama
-
 Papua New Guinea
-
 Paraguay
-
 Peru
Peru
-
 Philippines
-
 Poland
-
 Portugal
-
 Puerto Rico
-
 Qatar
Qatar
-
 Reunion
-
 Romania
-
 Rwanda
-
 Saudi Arabia
-
 Serbia
-
 Singapore
-
 Slovakia
-
 Slovenia
-
 Somalia
-
 South Africa
-
 Spain
Spain
-
 Sri Lanka
-
 Sweden
-
 Switzerland
-
 Syria
Syria
-
 Taiwan
-
 Tajikistan
-
 Tanzania
-
 Thailand
-
 Trinidad and Tobago
-
 Tunisia
-
 Turkey
-
 UAE
UAE
-
 Uganda
-
 Ukraine
-
 United Kingdom
-
United States
-
 Uruguay
-
 Uzbekistan
-
 Venezuela
-
 Vietnam
-
 Yemen
Yemen
-
 Zambia
-
 Zimbabwe
- Forex
- Crypto
