How To Trade Inside Bar Pattern


Editorial Note: While we adhere to strict Editorial Integrity, this post may contain references to products from our partners. Here's an explanation for How We Make Money. None of the data and information on this webpage constitutes investment advice according to our Disclaimer.
The best inside bar pattern trading strategies involve waiting for a breakout from the high or low of the inside bar and entering trades in the direction of the breakout. Traders can use stop-loss orders to manage risk and protect against false signals.
The inside bar pattern is a popular price action pattern used by traders to identify potential breakouts in the market. This pattern forms when the high and low of a candlestick are contained within the high and low of the previous candlestick, creating a consolidation phase. Trading the inside bar pattern involves waiting for the price to break out of the high or low of the inside bar and entering a trade in the direction of the breakout. To manage risk, a stop-loss order is placed below the low or above the high of the inside bar. This article will provide insights and strategies on how to effectively trade the inside bar pattern and capitalize on breakout opportunities in the market.
Best inside bar trading strategies
Inside Bar Pattern refers to a chart pattern where a smaller candle, known as the inside bar, is engulfed within the range of a larger candle, often referred to as the mother bar. This pattern typically occurs after a significant market move and signifies a period of consolidation.
Understanding how to effectively trade the inside bar pattern can provide powerful insights into price action. It is important to note that while matching highs and lows are acceptable, the range of the inside bar should not exceed that of the mother candle by even a single point.
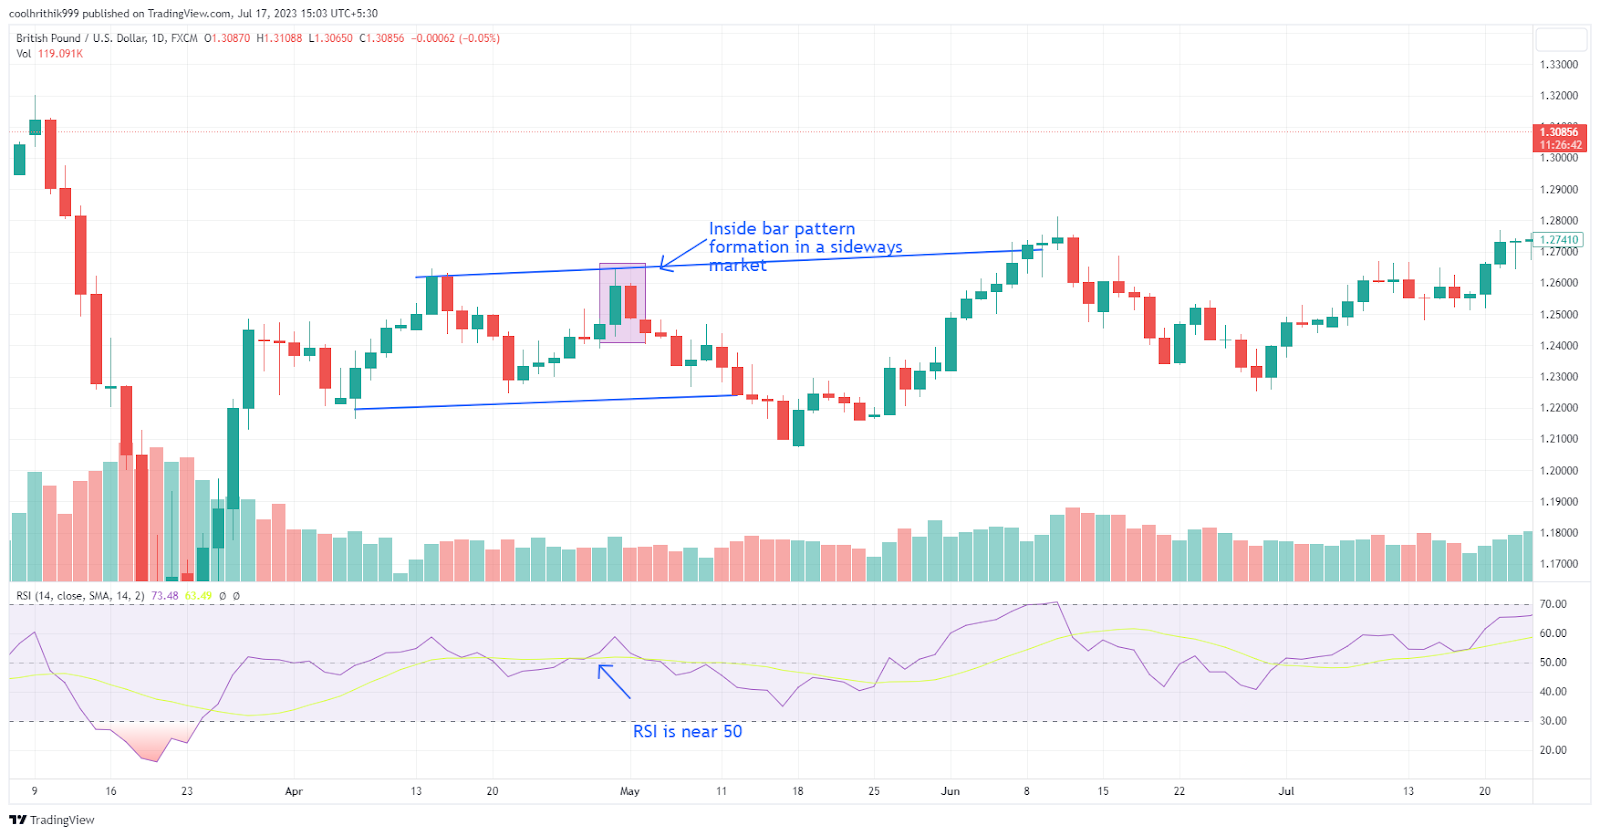
Range Trading: One approach to trading the inside bar pattern is in a ranging market. After a significant price move, the inside bar indicates a potential consolidation phase or market equilibrium. To confirm this setup, you can use the Relative Strength Index (RSI) as a confluence tool, observing the RSI around 40-50, indicating indecision and the likelihood of consolidation. Traders can enter trades targeting small price movements within the established range, focusing on support and resistance levels
 Inside bar pattern
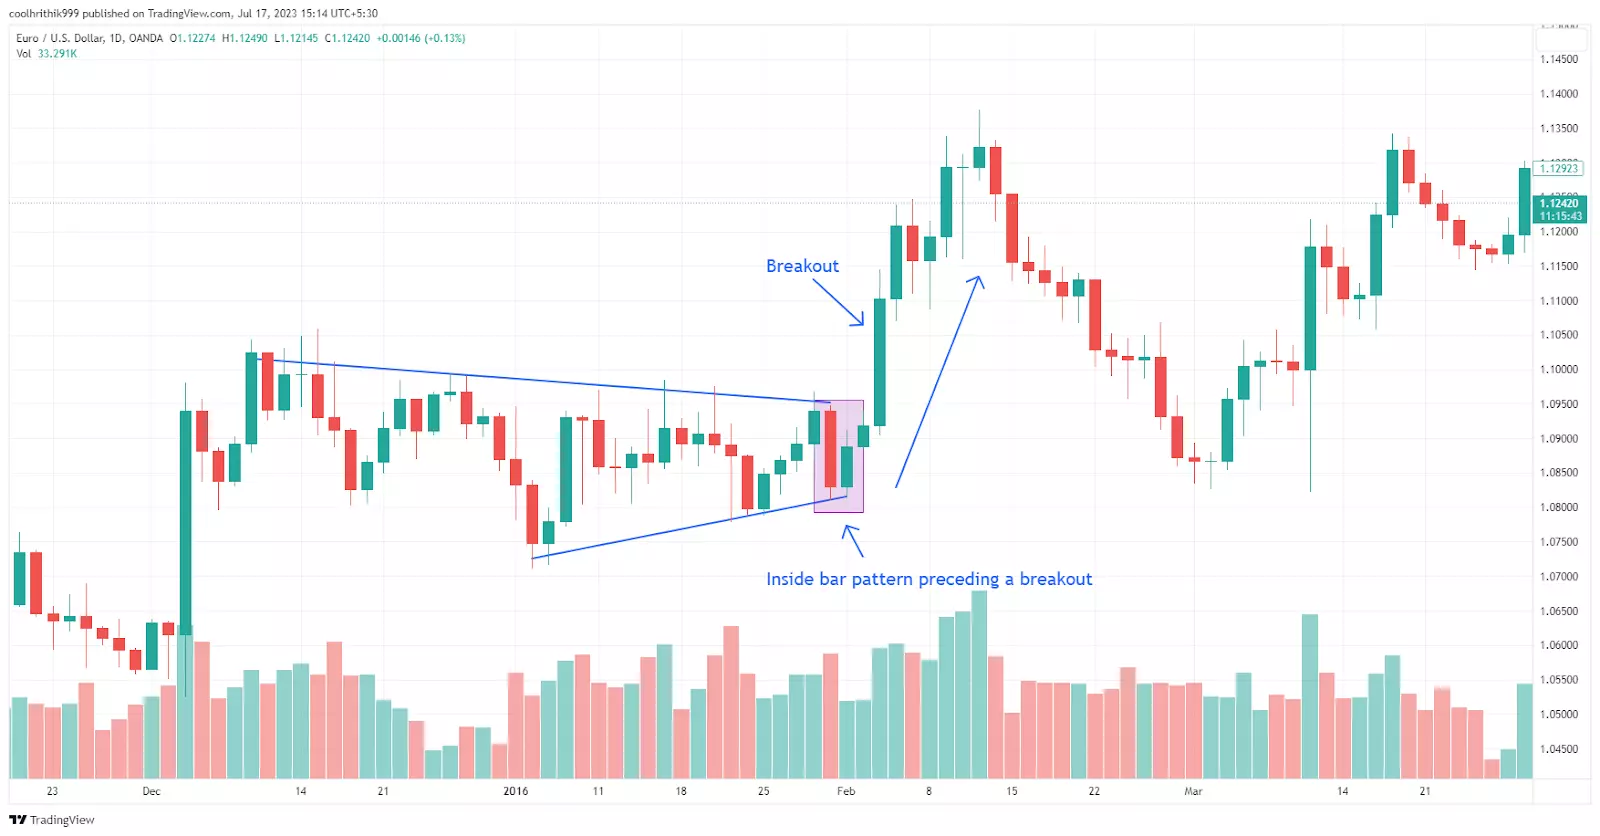
Breakout Trading: Another method is the inside bar breakout strategy, which offers more excitement. This involves identifying an inside bar formation with a large bearish candle followed by a smaller bullish candle within the first candle's range. The key signal occurs when the third candle rises above the second candle, indicating a potential price increase. Stop-loss orders can be placed at the lowest price level of the mother candle or the lowest level of the previous price swing, while take profit targets the highest level of the last swing price
 Inside bar pattern
Before applying these strategies in real market conditions, it’s essential to choose a reliable broker that provides tight spreads, fast execution, and transparent trading conditions. A solid brokerage platform not only improves trade accuracy when working with inside bar setups but also ensures that your trades are executed at the optimal price levels.
Below is a comparison of reputable Forex brokers that offer favorable terms for price action traders and are well-suited for implementing inside bar strategies.
| zForex | Plus500 | OANDA | Trading.com USA | FOREX.com | |
|---|---|---|---|---|---|
|
Tradable assets |
80 | 2800 | 129 | 69 | 5500 |
|
Demo |
Yes | Yes | Yes | Yes | Yes |
|
Min. deposit, $ |
10 | 100 | No | 50 | 100 |
|
Max. leverage |
1:1000 | 1:300 | 1:200 | 1:50 | 1:50 |
|
Standard EUR/USD spread |
0.3 | 0.7 | 0.3 | 1.1 | 1.0 |
|
Deposit fee, % |
No | No | No | No | No |
|
Withdrawal fee, % |
No | No | No | No | No |
|
Max. Regulation Level |
Not regulated | Tier-1 | Tier-1 | Tier-1 | Tier-1 |
|
TU overall score |
8.05 | 7.57 | 6.89 | 6.15 | 6.87 |
|
Open an account |
Go to broker Your capital is at risk.
|
Go to broker 80% of retail CFD accounts lose money. |
Go to broker Your capital is at risk. |
Go to broker Your capital is at risk. |
Study review |
Identify breakthrough potential as it develops
When an inside bar develops, it indicates a period of consolidation that could potentially lead to a breakout in the near future. However, to take advantage of this breakout potential, it is crucial to identify whether the breakout is likely to result in price appreciation or depreciation.
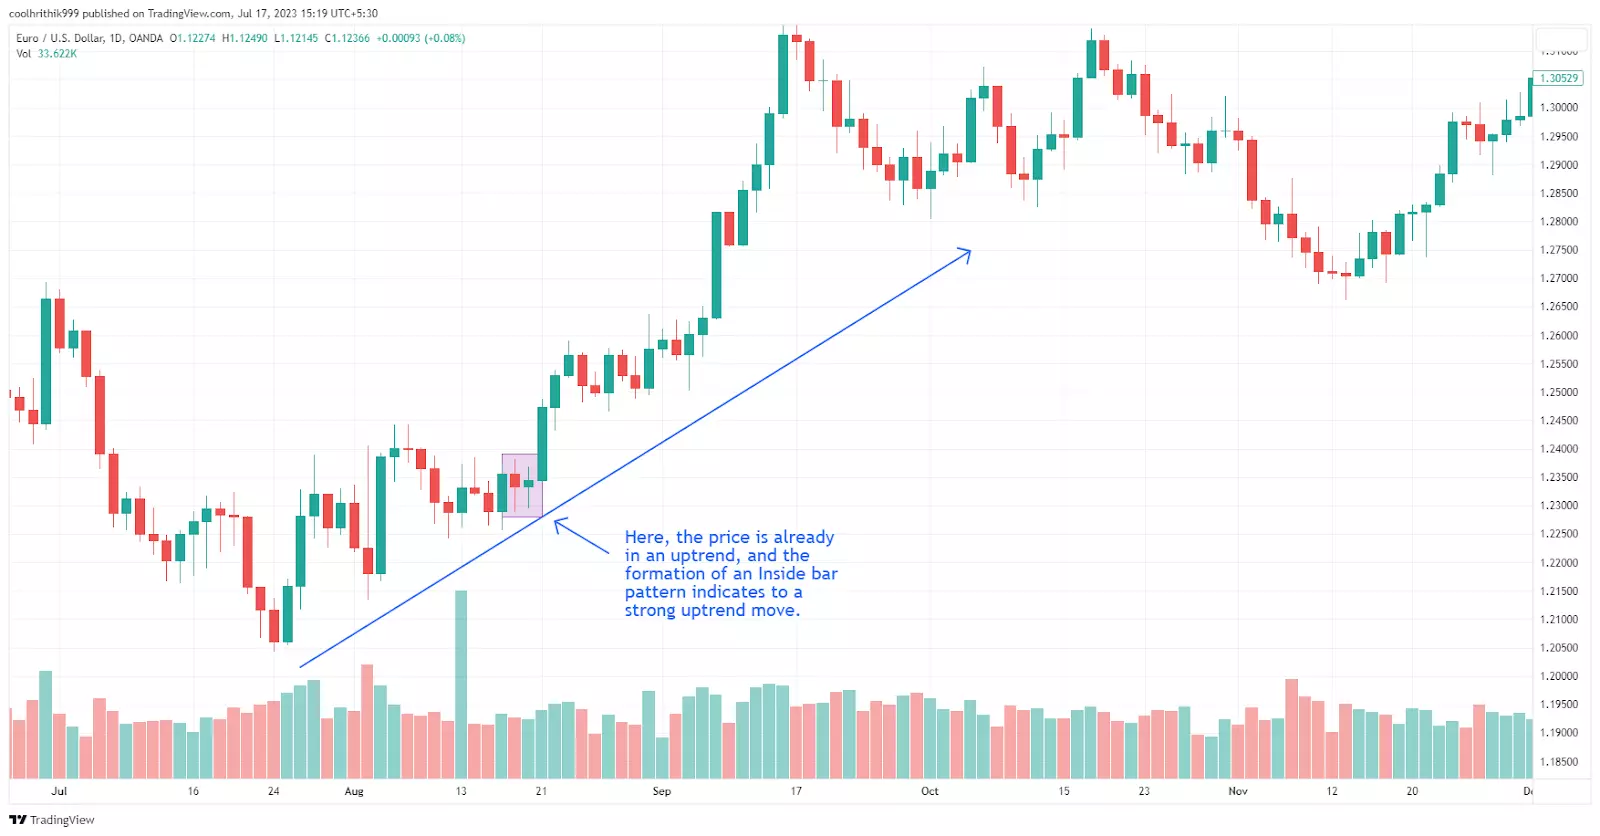
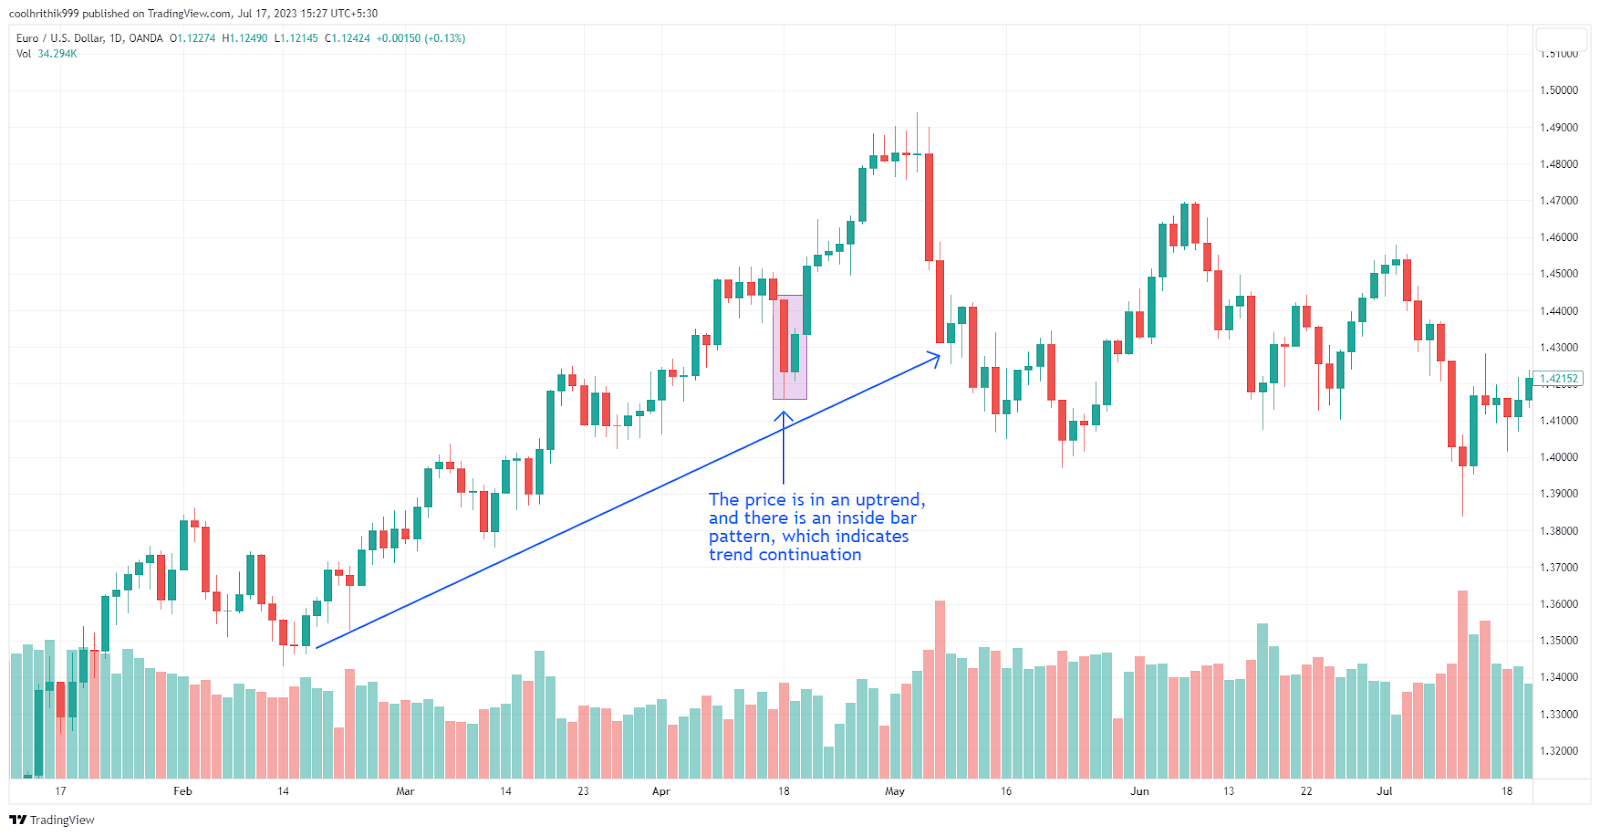
To evaluate this, consider the price's trend leading up to the inside bar formation. A profitable inside bar setup often exhibits a price movement that aligns with the trend prior to the inside bar. If the price is already trending upwards before the consolidation period, it is more probable that the breakout will continue in the same direction.
 Inside bar pattern
Additionally, assessing the risk/reward potential of a trade is essential. Ideally, the risk should be lower than half of the potential reward. Therefore, an inside bar setup is favorable when its trend, relationship to existing resistance levels, and other chart indicators indicate a strong breakout potential.
Features of trading inside bars under the daily chart
When it comes to trading inside bars, analyzing the daily charts proves to be the most valuable approach. Daily charts provide a larger sample size of price action, offering more reliable insights into market consolidation and potential breakouts.
On shorter time frames, such as one-hour or four-hour charts, inside bars are quite common and may not always indicate significant consolidation. To enhance the accuracy of your analysis, it is crucial to back up short-term inside bars with strong chart patterns or other technical indicators that suggest imminent price movement.
However, it is important to note that evaluating data from narrower time frames may yield weaker evidence compared to the robustness of daily charts. The validity of inside bar signals tends to be stronger when observed on the daily chart, which captures a broader picture of market dynamics.
To maximize the effectiveness of inside bar trading strategies, it is advisable to avoid time frames shorter than the daily chart. Lower time frames are more susceptible to market "noise", leading to false signals and potentially misleading trading decisions.
The significance of an inside bar formation on higher time frames, such as the daily chart, lies in the weight it carries. The longer formation period of the pattern implies greater participation from traders and higher capital flows. Consequently, the potential breakout or continuation signals provided by inside bars on the daily chart hold more credibility.
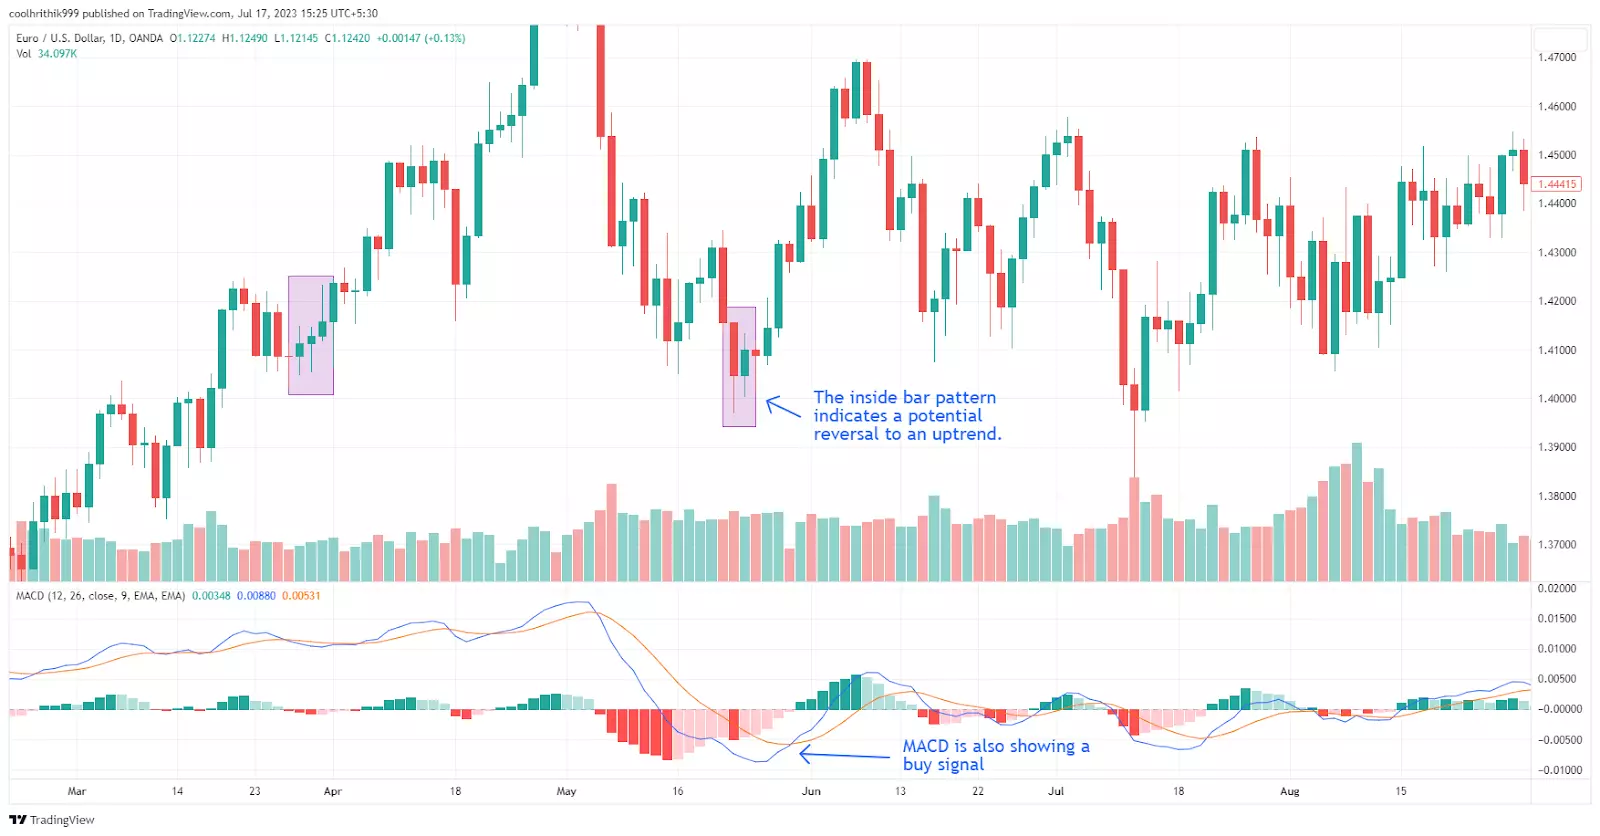
One commonly used technical indicator to validate the inside bar pattern is the Moving Average Convergence Divergence (MACD). The MACD helps assess the momentum and trend direction in the market. Traders can look for convergence or divergence between the MACD line and signal line around the inside bar formation. Convergence indicates potential price continuation, while divergence may suggest a reversal or consolidation phase. By combining the inside bar pattern with the MACD indicator, traders can increase their confidence in identifying successful trade opportunities.
 Inside bar pattern
Track consolidation from one day to the next
Inside bars on daily charts allow traders to track consolidation from one day to the next. This helps determine the direction in which prices may break out. By referring to the trend of the daily bar, traders can gain insights into the underlying market sentiment.
For example, consider a bullish trend where the price has been consistently making higher highs and higher lows. If an inside bar forms within this uptrend, it suggests a temporary consolidation before the uptrend potentially continues. Conversely, in a bearish trend, an inside bar may indicate a brief pause before the downtrend resumes.
 Inside bar pattern
It's important to remember that consolidation can take several days on daily charts before a breakout occurs. While an inside bar pattern may indicate upcoming price volatility, it does not guarantee a precise timeline for that movement.
When evaluating inside bars, pay close attention to the size of the bar relative to the preceding mother bar. A smaller inside bar in comparison to the previous bar indicates stronger consolidation signals, suggesting an imminent breakout. Conversely, when the size difference is minimal, the strength of the consolidation signal decreases. Therefore, consider the proportions of the inside bar setup as you assess the trade potential from one day to the next.
Use a stop-loss order
Implementing a stop-loss order is a crucial aspect of successful inside bar pattern trading strategies. It serves as a risk management tool to protect traders from potential losses and minimize the impact of false positive signals.
Inside bars, while reliable patterns, are not foolproof. There is always a possibility of false signals or unexpected market movements that can lead to unfavorable outcomes. By using a stop-loss order, traders can set a predetermined level at which they are willing to exit the trade if the market moves against their anticipated direction.
The purpose of a stop-loss order is to limit potential losses and provide traders with an exit strategy in case the inside bar pattern does not result in the expected breakout or continues to consolidate without a clear direction. It helps to control risk and protect capital, ensuring that losses are kept within acceptable limits.
Trading inside bars: Pros and cons
Trading inside bar patterns comes with its own set of advantages and disadvantages. Understanding these pros and cons can help traders make informed decisions when incorporating inside bar patterns into their trading strategies.
- Pros
- Cons
- Frequent occurrence: Inside bar patterns are commonly found in the markets, presenting traders with numerous opportunities to identify and capitalize on potential trading setups
- Easy identification: Inside bars are relatively easy to identify on price charts. Their distinct structure, where the range of the current bar is contained within the previous bar, makes them recognizable patterns
- Reversal and continuation signals: Inside bars can act as both reversal and continuation signals, depending on their location within the price chart and the prevailing trend. This versatility provides traders with flexibility in adapting their trading strategies to different market conditions
- Abundance of trading opportunities: The profitability of inside bar setups allows traders to find multiple trading opportunities, particularly for those employing intraday trading techniques. This pattern's ability to generate frequent setups can lead to consistent trading activity
- Ambiguous market direction: While inside bar patterns indicate consolidation in the market, they do not provide clear guidance on the future direction of prices. Traders may face challenges in determining whether the market will break out or continue consolidating
- Supplementary tools required: To enhance the reliability of inside bar signals, traders often need to combine this pattern with other technical analysis tools. Relying solely on inside bar patterns may not provide sufficient information for making trading decisions
Tips on trading the inside bar pattern
Practice identifying inside bars on your charts before trading them live: Familiarize yourself with the visual characteristics and formation of inside bars through historical chart analysis to enhance your recognition skills
Focus on the daily time frame for optimal inside bar trading: The daily chart provides a broader perspective of price action, allowing you to capture the significance and potential breakout opportunities of inside bars
Confirm inside bar patterns with other technical indicators or chart patterns: Combine the inside bar signal with additional tools like trendlines, moving averages, or support and resistance levels to strengthen your trading decision
Consider the trend direction before trading an inside bar setup: Assess the prevailing market trend to align your inside bar trades with the overall direction, increasing the probability of successful trades
Set appropriate stop-loss orders to manage risk: Determine a strategic placement for your stop-loss order below the inside bar's low (for long trades) or above the inside bar's high (for short trades) to limit potential losses in case of adverse price movements
I recommend treating inside bar breakouts as confirmation tools, not triggers

In my own trading, the inside bar pattern has always been less about the signal itself and more about the context in which it appears. I rarely act on an inside bar without first understanding what the market was doing before it formed. If I see an inside bar following a strong directional move, I interpret it as a short pause – a moment when the market is gathering momentum for its next push. That’s usually where the best setups emerge.
I recommend treating inside bar breakouts as confirmation tools, not triggers. The key is patience – waiting for the breakout to align with the broader market structure. When I trade this pattern, I always look at where it’s forming: near a major support or resistance level, or in the middle of a trend. Breakouts from strong structural zones tend to have higher follow-through and lower noise.
Risk management is another area where discipline matters. I never assume that an inside bar breakout will follow through without testing nearby levels. To protect against false moves, I position my stop-loss beyond the structure of the mother bar, giving trades just enough breathing space to survive natural volatility.
Finally, I encourage traders to think of the inside bar as a story of market indecision. When the next candle breaks out, it’s the market revealing its decision. The more you study these transitions, the better you’ll understand the rhythm of price action. In my experience, traders who combine technical awareness with patience – rather than chasing every breakout – are the ones who consistently make the inside bar strategy work for them.
Conclusion
Mastering inside bar pattern trading strategies empowers traders to anticipate breakout moves with confidence and precision. By carefully analyzing price consolidation and momentum shifts, traders can enter the market at optimal points, maximizing their profit potential. For instance, utilizing inside bar patterns in combination with support and resistance levels has proven effective in both trending and ranging markets. Ultimately, the key takeaway is that consistent success with inside bar strategies hinges on discipline and adaptability. Embrace the inside bar as a powerful tool, and let it guide you toward smarter, more profitable trades.
FAQs
What time frames provide the most reliable signals for inside bar pattern trading strategies?
How can technical indicators be combined with inside bar patterns to improve trading accuracy?
What are the main advantages and disadvantages of using inside bar patterns in trading?
Why is it important to analyze the proportions between the inside bar and the mother bar?
Editors' Top Picks and Insights

Crypto test drive: How automakers are exploring digital assets

Lindsey Graham death: U.S. senator’s crypto legacy

Tether under pressure: USDT in Europe, audit questions, and the fight for trust

Lean Ethereum: Why Buterin wants to rebuild the network

SK Hynix debuts on Nasdaq: Largest U.S. offering by foreign company

SpaceX falls out of orbit: Does anyone still want Musk’s stock?
Related Articles
Team that worked on the article
Chinmay Soni is a financial analyst with more than 5 years of experience in working with stocks, Forex, derivatives, and other assets. As a founder of a boutique research firm and an active researcher, he covers various industries and fields, providing insights backed by statistical data.
Dr. BJ Johnson is a PhD in English Language and an editor with over 15 years of experience. He earned his degree in English Language in the U.S and the UK.
Mirjan Hipolito is a journalist and news editor at Traders Union. She is an expert crypto writer with five years of experience in the financial markets.
Yield refers to the earnings or income derived from an investment. It mirrors the returns generated by owning assets such as stocks, bonds, or other financial instruments.
Price action trading is a trading strategy that relies primarily on the analysis of historical price movements and patterns in financial markets, such as stocks, currencies, or commodities. Traders who use this approach focus on studying price charts, candlestick patterns, support and resistance levels, and other price-related data to make trading decisions.
Forex leverage is a tool enabling traders to control larger positions with a relatively small amount of capital, amplifying potential profits and losses based on the chosen leverage ratio.
Ethereum is a decentralized blockchain platform and cryptocurrency that was proposed by Vitalik Buterin in late 2013 and development began in early 2014. It was designed as a versatile platform for creating decentralized applications (DApps) and smart contracts.
Risk management is a risk management model that involves controlling potential losses while maximizing profits. The main risk management tools are stop loss, take profit, calculation of position volume taking into account leverage and pip value.

-
 Afghanistan
-
 Albania
-
 Algeria
-
 Angola
-
 Argentina
-
 Armenia
-
 Australia
-
 Austria
-
 Azerbaijan
-
 Bahamas
-
 Bahrain
-
 Bangladesh
-
 Belarus
-
 Belgium
-
 Bolivia
-
 Botswana
-
 Brazil
-
 Brunei
-
 Bulgaria
-
 Cambodia
-
 Cameroon
-
 Canada
-
 Chile
Chile
-
 China
China
-
 Colombia
-
 Congo
Congo
-
 Costa Rica
-
 Cote d'Ivoire
-
 Croatia
-
 Cuba
Cuba
-
 Cyprus
-
 Czechia
-
 DR Congo
-
 Denmark
-
 Dominican Republic
-
 Ecuador
-
 Egypt
Egypt
-
 El Salvador
-
 Estonia
-
 Eswatini
-
 Ethiopia
-
 Finland
-
 France
-
 Georgia
-
 Germany
-
 Ghana
Ghana
-
 Greece
-
 Haiti
Haiti
-
 Hong Kong
-
 Hungary
-
 India
India
-
 Indonesia
-
 Iran, Islamic republic
-
 Iraq
Iraq
-
 Ireland
-
 Israel
-
 Italy
Italy
-
 Jamaica
-
 Japan
Japan
-
 Jordan
-
 Kazakhstan
-
 Kenya
Kenya
-
 Korea
Korea
-
 Kuwait
-
 Kyrgyzstan
-
 Laos
Laos
-
 Latvia
-
 Lebanon
-
 Lesotho
-
 Libya
Libya
-
 Lithuania
-
 Luxembourg
-
 Madagascar
-
 Malaysia
-
 Malta
Malta
-
 Mauritius
-
 Mexico
-
 Moldova
-
 Mongolia
-
 Montenegro
-
 Morocco
-
 Mozambique
-
 Myanmar
-
 Namibia
-
 Nepal
Nepal
-
 Netherlands
-
 New Zealand
-
 Nigeria
-
 North Macedonia
-
 Norway
-
 Oman
Oman
-
 Pakistan
-
 Palestine
-
 Panama
-
 Papua New Guinea
-
 Paraguay
-
 Peru
Peru
-
 Philippines
-
 Poland
-
 Portugal
-
 Puerto Rico
-
 Qatar
Qatar
-
 Reunion
-
 Romania
-
 Rwanda
-
 Saudi Arabia
-
 Serbia
-
 Singapore
-
 Slovakia
-
 Slovenia
-
 Somalia
-
 South Africa
-
 Spain
Spain
-
 Sri Lanka
-
 Sweden
-
 Switzerland
-
 Syria
Syria
-
 Taiwan
-
 Tajikistan
-
 Tanzania
-
 Thailand
-
 Trinidad and Tobago
-
 Tunisia
-
 Turkey
-
 UAE
UAE
-
 Uganda
-
 Ukraine
-
 United Kingdom
-
United States
-
 Uruguay
-
 Uzbekistan
-
 Venezuela
-
 Vietnam
-
 Yemen
Yemen
-
 Zambia
-
 Zimbabwe
- Forex
- Crypto
