Illustration Of The Cheat Sheet


Editorial Note: While we adhere to strict Editorial Integrity, this post may contain references to products from our partners. Here's an explanation for How We Make Money. None of the data and information on this webpage constitutes investment advice according to our Disclaimer.
The Cheat Sheet is a simple but powerful diagram that illustrates the different emotions that investors experience during a typical market cycle. It consists of a line that represents the price movement of an asset, such as a stock, a currency, or a cryptocurrency. It also has a set of labels that identify the dominant sentiment at each stage of the cycle.
Have you ever wondered why the stock market moves in cycles? Or wondered why investors often act irrationally and emotionally? If so, you are not alone. Many researchers and experts have tried to explain the psychology behind market fluctuations and investor behavior.
One of the most popular and useful tools to do so is the Wall Street Cheat Sheet.
Description of emotional investing
Emotional investing is the tendency to make investment decisions based on feelings rather than facts. As most traders recognize, emotions can cloud judgments and lead to buying or selling at the wrong time, resulting in losses or missed opportunities. Emotions can also cause us to overreact to market news and events, creating volatility and uncertainty. Emotional investing is influenced by many factors, such as personal biases, herd mentality, greed, fear, optimism, and pessimism.
The Cheat Sheet helps us understand how emotional investing affects market cycles and investor behavior. It shows that emotions are not static, but dynamic and cyclical. They change as the market conditions change, creating feedback loops that enhance or diminish price movements. The Cheat Sheet also shows that emotions are not uniform, but are diverse and sometimes conflicting. Different investors may have different emotions at the same time, creating market divergence and convergence.
The structure of the Wall Street Cheat Sheet
The Cheat Sheet is structured based on two main concepts in analyzing markets: trend and sentiment. Trend is the general direction of the market or an asset over time. It can be upward ( bullish), downward ( bearish), or sideways (neutral). Sentiment is the collective attitude of investors towards the market or an asset. Sentiment can be positive (optimistic), negative (pessimistic), or mixed (uncertain).
The Cheat Sheet shows how trends and sentiment interact and influence one another during a market cycle. It also shows how trend and sentiment affect investor behavior and decision-making. For example, when the trend is upward and the sentiment is positive, investors tend to buy more and push prices higher. When the trend is downward and the sentiment is negative, investors tend to sell more and push prices lower.
The Cheat Sheet also shows how trends and sentiment change over time due to various factors. These factors may include things like supply and demand, news and events, technical analysis, and fundamental analysis. These factors can create triggers or catalysts that cause trend reversals or sentiment shifts. For example, when supply exceeds demand, prices may fall and trigger a bearish trend reversal. Alternatively, when news or events create positive expectations, sentiment may rise and trigger a bullish sentiment shift.
Best stock brokers for applying market psychology strategies
Choosing the right broker is important when applying tools like the Wall Street Cheat Sheet, as execution quality, charting tools, and market access can influence decision-making. Traders should consider platform reliability, analytical features, and trading costs when selecting a broker.
The table below highlights brokers that provide suitable environments for analyzing market trends and investor sentiment, helping traders apply structured strategies more effectively.
| eToro USA | Plus500 | eOption | Revolut | Interactive Brokers | Fidelity | |
|---|---|---|---|---|---|---|
|
Foundation year |
2007 | 2008 | 2007 | 2015 | 1978 | 1946 |
|
Account min. |
50 | EUR500 | No | No | No | No |
|
Interest rate |
3,75 | No | 8.95% | 0%-4% | 4.83% | 4.97% |
|
Basic stock/ETF fee |
No | $0.006 | $0 | 0.12%-0.25% | 0-0,0035% | No |
|
Min. stock/ETF fee |
No | Not specified | $0 | £1.00/€1.00 | $1,00 | No |
|
Basic futures fee |
Not specified | Not specified | Not specified | No | $0,25 | Varies |
|
Min. futures fee |
Not specified | Not specified | Not specified | No | $0,25 | Varies |
|
Open an account |
Go to broker Your capital is at risk. |
Go to broker 80% of retail CFD accounts lose money. |
Study review | Study review | Study review | Study review |
The Cheat Sheet various stages
Generally speaking, the Cheat Sheet depicts four main phases of a market cycle: accumulation, markup, distribution, and markdown. Each phase corresponds to a different level of investor confidence and activity. Let us take a closer look at each phase and the corresponding emotions that help drive each of these phases.
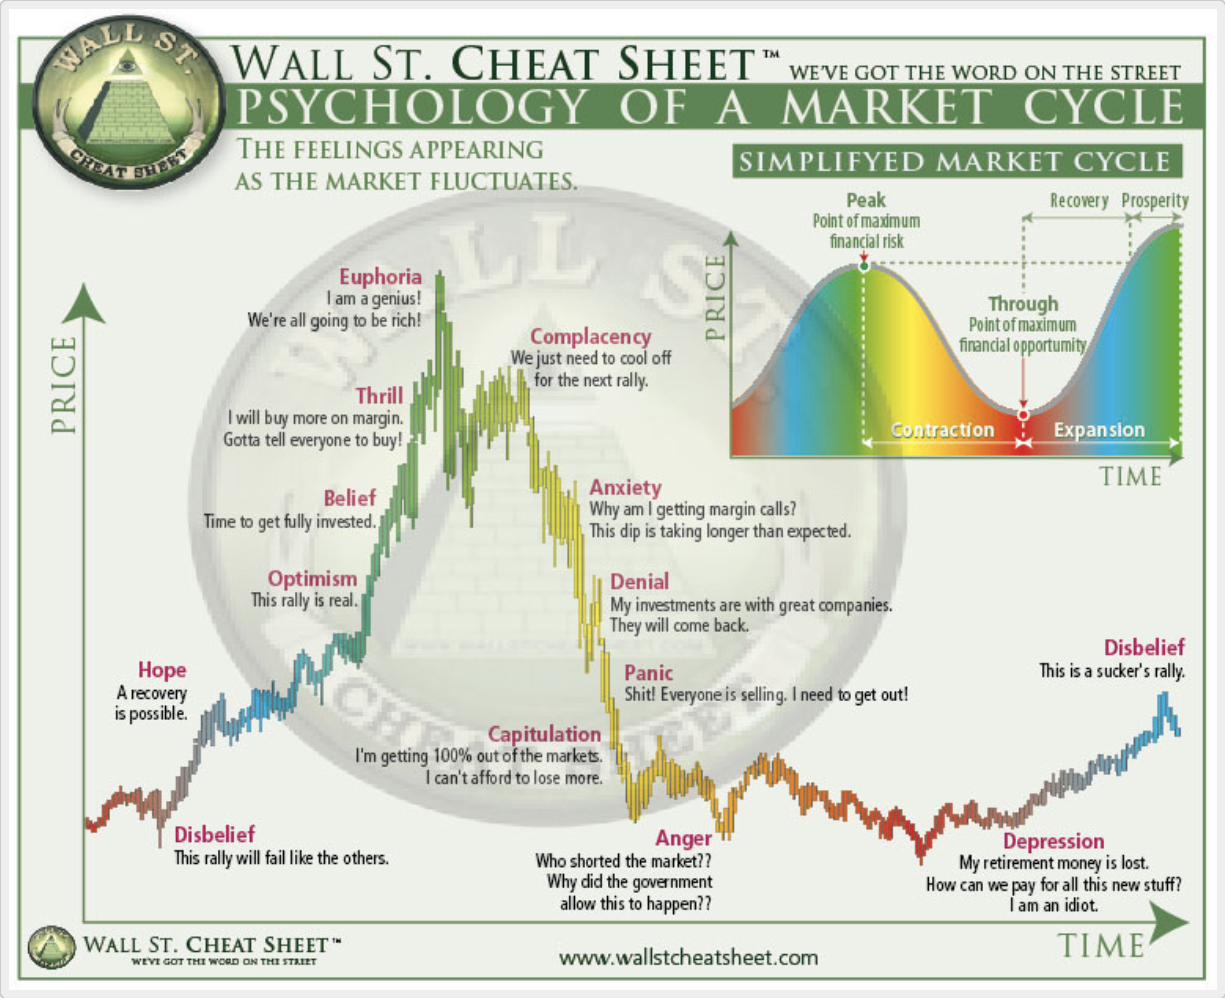
The Cheat Sheet divides each phase of a market cycle into several stages based on the dominant emotion that investors experience during each particular stage. These investor stages are summarized below.
Disbelief. This is the first stage of the accumulation phase. This is where prices start to rise after a prolonged downtrend. Most investors are still skeptical and doubtful about the new trend, as they have been burned by previous losses. These investors think that the rise is temporary and will soon reverse
Hope. This is the second stage of the accumulation phase, where prices continue to rise and break previous highs. Some investors start to become hopeful and interested in the new trend. That is, they see signs of recovery and growth. They think that maybe things are getting better
Optimism. This is the first stage of the markup phase, where prices surge higher rapidly. Many investors become optimistic and confident about the new trend, as they see strong momentum and performance. They think that things are going well
Belief. This is the second stage of the markup phase, where prices consolidate after a sharp rise. Most investors believe in the new trend firmly, as they see solid support and stability. They think that things will continue to go well
Thrill. This is the third stage of the markup phase, where prices break out of consolidation and resume their upward movement. Some investors feel thrilled and excited about the new trend, as they see generous profits and opportunities. They think that things are going great
Euphoria. This is the fourth and final stage of the markup phase, where prices reach their peak and become extremely overvalued. A few investors feel euphoric and ecstatic about the new trend, as they see strong returns and potential. They think that things are perfect and nothing can go wrong
Complacency. This is the first stage of the distribution phase, where prices start to fall after reaching their peak. Most investors are still complacent and satisfied with the new trend, as they have made a lot of money and expect to make a lot more. They think that the fall is temporary and will soon recover
Anxiety. This is the second stage of the distribution phase, where prices continue to fall and surpass previous lows. Some investors start to feel anxious and nervous about the new trend, as they see signs of weakness and decline. They think that maybe things are getting worse
Denial. This is the third stage of the distribution phase, where prices plunge lower rapidly. Many investors are in denial and refuse to accept the new trend, as they have lost a lot of money and hope. They think that things are not that bad and will soon improve
Panic. This is the first stage of the markdown phase, where prices crash lower violently. Most investors feel panic and fear about the new trend, as they see massive losses and risks. They think that things are terrible and need to get out
Anger. This is the second stage of the markdown phase, where prices consolidate after a sharp fall. Some investors feel anger and resentment about the new trend, as they have been betrayed by previous expectations and promises. They think that things are unfair and someone is to blame
Depression. This is the third stage of the markdown phase, where prices break out of consolidation and resume their downward movement. Many investors feel depression and despair about the new trend, as they have lost everything and have no future. They think that things are hopeless and nothing can help
Disbelief. This is the fourth and final stage of the markdown phase, where prices reach their bottom and become extremely undervalued. A few investors feel disbelief and shock about the new trend, as they have witnessed a complete reversal and collapse. They think that things are impossible and nothing makes sense
Using the Wall Street Cheat Sheet to enhance trades
A trader can use the Cheat Sheet to gauge the market sentiment and align their trading decisions with the prevailing trend.
For example, during the disbelief phase, when most traders are skeptical and pessimistic about the new trend, a trader can look for signs of accumulation and breakout to enter early and capture the potential upside.
During the hope phase, when traders start to become hopeful and interested in the market, a trader can add to their position and ride the momentum. And during the optimism phase, when traders become more confident and optimistic about the market, a trader can monitor the price action and indicators for signs of divergence and exhaustion.
And then finally, during the euphoria phase, when traders become overly excited and greedy about the market, a trader can start to take profits and reduce their exposure. Alternatively, traders may even reverse their position and anticipate a trend reversal. By using the Wall Street Cheat Sheet, a trader can avoid emotional biases and trade more rationally and profitably.
Use the Cheat Sheet as a guide, not a signal

I see the Wall Street Cheat Sheet as a useful framework for understanding market behavior, but not as a direct trading signal. It helps put price movements into context by linking them to investor psychology, which can improve timing and awareness. However, relying on it alone without technical or fundamental confirmation may lead to incomplete decisions.
In my view, the best way to use this model is alongside other tools such as trend analysis and risk management rules. Markets do not always follow a perfect cycle, and emotions can shift unpredictably. The Cheat Sheet becomes most effective when it supports a structured strategy, helping traders stay objective and avoid reacting emotionally during extreme market phases.
Conclusion
The Wall Street Cheat Sheet offers a compelling framework for recognizing the powerful influence of investor emotions throughout market cycles, underscoring the critical importance of psychological awareness in trading. By understanding phases like euphoria at market tops or panic at bottoms, traders can avoid costly emotional mistakes and instead align their strategies with prevailing sentiment. For instance, using the Cheat Sheet to identify the disbelief phase can help bold investors capitalize on early opportunities, while spotting euphoria may prompt timely profit-taking. Ultimately, the Cheat Sheet should be used as a contextual tool alongside sound technical and risk management practices—reminding us that rationality in the face of emotional markets is a trader's greatest asset.
FAQs
How can the Wall Street Cheat Sheet help identify potential turning points in a market cycle?
What are common emotional biases that the Wall Street Cheat Sheet helps traders overcome?
Is the Wall Street Cheat Sheet applicable to all financial markets, such as cryptocurrencies or commodities?
Why should the Wall Street Cheat Sheet be used in combination with other analysis tools?
Editors' Top Picks and Insights

Brent nears $100: Why oil prices are rising

Gram Wallet launch: Can Telegram bring crypto to the masses?

AI without limits: How dangerous are neural networks?

Worldcoin on Wall Street: From iris scans to ETF

Mark Cuban's wealth philosophy: Why stocks matter more than salary or crypto

Dangerous but indispensable: Why the crypto market needs bridges
Related Articles
Team that worked on the article
Thomas Wettermann is an experienced writer and a contributor to the Traders Union website. Over the last 30 years, he has written posts, articles, tutorials, and publications on several different high tech, health, and financial technologies, including FinTech, Forex trading, cryptocurrencies, metaverses, blockchain, NFTs and more.
Dr. BJ Johnson is a PhD in English Language and an editor with over 15 years of experience. He earned his degree in English Language in the U.S and the UK.
Mirjan Hipolito is a journalist and news editor at Traders Union. She is an expert crypto writer with five years of experience in the financial markets.
Risk management is a risk management model that involves controlling potential losses while maximizing profits. The main risk management tools are stop loss, take profit, calculation of position volume taking into account leverage and pip value.
Bitcoin is a decentralized digital cryptocurrency that was created in 2009 by an anonymous individual or group using the pseudonym Satoshi Nakamoto. It operates on a technology called blockchain, which is a distributed ledger that records all transactions across a network of computers.
CFD is a contract between an investor/trader and seller that demonstrates that the trader will need to pay the price difference between the current value of the asset and its value at the time of contract to the seller.
In the Forex market, a “trend” is the label used to describe the general direction that the prices of currency pairs are moving in, over a specific period of time. Trends are basically the pattern that a currency pair appears to be following and can help traders determine when to enter and exit a trade.
A bear market is a period of time in which an investment asset, such as stocks, bonds, or commodities, experiences a decline in price for an extended period of time.

-
 Afghanistan
-
 Albania
-
 Algeria
-
 Angola
-
 Argentina
-
 Armenia
-
 Australia
-
 Austria
-
 Azerbaijan
-
 Bahamas
-
 Bahrain
-
 Bangladesh
-
 Belarus
-
 Belgium
-
 Bolivia
-
 Botswana
-
 Brazil
-
 Brunei
-
 Bulgaria
-
 Cambodia
-
 Cameroon
-
 Canada
-
 Chile
Chile
-
 China
China
-
 Colombia
-
 Congo
Congo
-
 Costa Rica
-
 Cote d'Ivoire
-
 Croatia
-
 Cuba
Cuba
-
 Cyprus
-
 Czechia
-
 DR Congo
-
 Denmark
-
 Dominican Republic
-
 Ecuador
-
 Egypt
Egypt
-
 El Salvador
-
 Estonia
-
 Eswatini
-
 Ethiopia
-
 Finland
-
 France
-
 Georgia
-
 Germany
-
 Ghana
Ghana
-
 Greece
-
 Haiti
Haiti
-
 Hong Kong
-
 Hungary
-
 India
India
-
 Indonesia
-
 Iran, Islamic republic
-
 Iraq
Iraq
-
 Ireland
-
 Israel
-
 Italy
Italy
-
 Jamaica
-
 Japan
Japan
-
 Jordan
-
 Kazakhstan
-
 Kenya
Kenya
-
 Korea
Korea
-
 Kuwait
-
 Kyrgyzstan
-
 Laos
Laos
-
 Latvia
-
 Lebanon
-
 Lesotho
-
 Libya
Libya
-
 Lithuania
-
 Luxembourg
-
 Madagascar
-
 Malaysia
-
 Malta
Malta
-
 Mauritius
-
 Mexico
-
 Moldova
-
 Mongolia
-
 Montenegro
-
 Morocco
-
 Mozambique
-
 Myanmar
-
 Namibia
-
 Nepal
Nepal
-
 Netherlands
-
 New Zealand
-
 Nigeria
-
 North Macedonia
-
 Norway
-
 Oman
Oman
-
 Pakistan
-
 Palestine
-
 Panama
-
 Papua New Guinea
-
 Paraguay
-
 Peru
Peru
-
 Philippines
-
 Poland
-
 Portugal
-
 Puerto Rico
-
 Qatar
Qatar
-
 Reunion
-
 Romania
-
 Rwanda
-
 Saudi Arabia
-
 Serbia
-
 Singapore
-
 Slovakia
-
 Slovenia
-
 Somalia
-
 South Africa
-
 Spain
Spain
-
 Sri Lanka
-
 Sweden
-
 Switzerland
-
 Syria
Syria
-
 Taiwan
-
 Tajikistan
-
 Tanzania
-
 Thailand
-
 Trinidad and Tobago
-
 Tunisia
-
 Turkey
-
 UAE
UAE
-
 Uganda
-
 Ukraine
-
 United Kingdom
-
United States
-
 Uruguay
-
 Uzbekistan
-
 Venezuela
-
 Vietnam
-
 Yemen
Yemen
-
 Zambia
-
 Zimbabwe
- Forex
- Crypto
