Shooting Star Candlestick Pattern - Guide for Beginners

A shooting star candlestick pattern is a bearish candlestick that forms when the security opens, rises considerably, and closes the day almost where it opened. Typically, it is characterized by a small body, a long upper wick, and a small lower wick.
Traders use candlestick patterns to anticipate the direction of price movement. They come in handy as they depict four price points - open, close, high, and low - throughout the time specified by the trader. With time, candlesticks form patterns that help traders know significant support and resistance levels.
As a trader, you can examine the marketing through patterns like breakouts, price bars, or trend lines. On the flip side, you can consider a thorough combination of volatility, channels, and candlesticks. The shooting star candlestick pattern is just another way of displaying an asset’s price movement information.
We’ll discuss more on the topic below.
-
What Is a Shooting Star Technical Analysis?
Generally, technical analysis uses stats to evaluate stock performance. This is achieved considering the trading volume changes or the previous stock performance based on price fluctuations. A shooting star technical analysis depicts a reversal pattern indicating a price decline.
-
Which are the Bullish Candlestick Patterns?
A bullish candlestick pattern indicates that the market will likely enter an uptrend after a previous decline in prices. Common bullish candlestick patterns include morning star, bullish engulfing, hammer, inverse hammer, piercing line, and three white soldiers.
-
What Common Mistakes Do People Commit When Using a Shooting Star Candlestick Pattern?
One common mistake people make when using a shooting star candlestick or any other candlestick pattern is that they view them in isolation. Traders must consider several other indicators alongside candlestick to make informed trading decisions.
-
When to Use a Shooting Star Candlestick Pattern?
The shooting star candlestick pattern is a useful technical analysis tool to detect a bearish divergence in the market. It is helpful for you in case you lose money on a trade and seek a way out or desire to enter the market for the long term.
What Is a Shooting Star Candlestick?
A shooting star candlestick pattern is a bearish candlestick that forms when the security opens, rises considerably, and closes the day almost where it opened. Typically, it is characterized by a small body, a long upper wick, and a small lower wick.
For a pattern to be considered a shooting star, the upper wick must be at least half of the length of the entire candlestick. Besides, it must show at the top of an uptrend. This pattern is frequently regarded to be a bearish reversal. Simply put, the uptrend might fail to continue.
The psychology behind shooting star candlestick is pretty complex. In the beginning, traders observe the uptrend depicting a constant price increase. At this point, a nervous trader would fear missing out on the opportunity.
This creates a fear of missing out (FOMO) effect, and they purchase into the market, increasing the prices further. This successfully draws bullish traders into the market, creating a powerful reversal situation.
As the market price fluctuates and grows higher, the candlestick continues to become large and more bullish. However, it is just a marketing tactic because the market starts to fall as quickly as it rose the following day. This results in the candlestick closing almost near to where it opened. Let’s take a closer look at it through an example.
Consider you are following a market share price that opens the trading day at $449.70. After some time, the share price drops to $444.70. Later, positive news in the firm caused it to increase rapidly, hitting $489.70. Eventually, it closes at $452.30. Such movements result in the formation of a shooting star candlestick.
Though this pattern is commonly used in all markets, it is more common in crypto markets. Why? Because crypto traders are used to unpredictable abrupt price movements, this pattern falls into a relevant category.
👍 Pros
• Whether an amateur or a seasoned trader, you can use this pattern. It is relatively simple to understand and identify. As long as you stick to the pattern description, you’ll easily spot it.
• You can rely on it to confirm the onset of a bearish trend. The shooting star candlestick pattern is fairly reliable to spot a bearish reversal as it appears closer to the resistance level.
👎 Cons
• You cannot rely on a shooting star candlestick pattern alone to make your critical trading decisions. Instead, you require confirmation using some technical analysis tools or the following day's candle.
• It necessitates the use of stop losses to limit potential losses.
Best Brokers to Consider
Brokerage platforms offer people access to the financial market and allow them to invest their assets. This helps individuals meet their long and short-term financial goals. However, choosing the best brokers from several available options can get pretty overwhelming. Although many brokers offer free services to keep pace with the rising competition, not all provide useful features.
For this reason alone, investors prefer evaluating these platforms to determine their features, usability, technology, and more. After thorough research, we compiled the best brokers for you to consider.


How to Identify a Shooting Star Candlestick
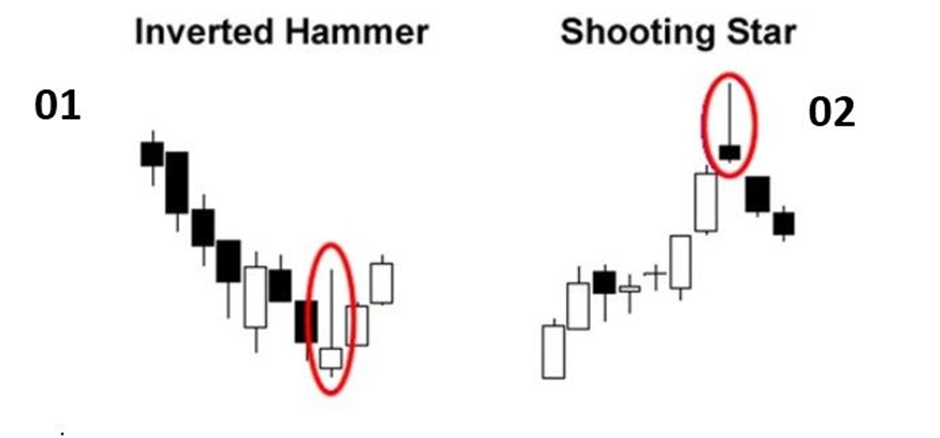
Inverted Hammer & Shooting Star patterns
As with other candlestick patterns, if traders identify the shooting star correctly, they can immensely benefit from it. Here are the primary characteristics of the shooting star chart pattern:
Upper Tail. Also known as the shadow, it is the line that appears right above the candlestick body. The upper tail is 2-3 times longer than the entire candlestick body.
The lower Tail extends below the candlestick’s body and is extremely short or almost non-existent. It isn’t any longer than the candlestick’s body when it exists.
Candlestick Body depicts the opening and closing prices of the stock market. Generally, it is too short and indicates that the opening and closing prices are near each other.
Further, if some additional characteristics of shooting star formation occur, they strengthen the signals of the potential market reversal to the downside. The first key element among these is the closing price.
For instance, a closing price below the opening price reflects the net price decline for the time covered by the candlestick, consequently making the shooting star pattern stronger. Typically, the pattern is considered strong with no shadow or lower tail.
Another scenario can be when the close price is less than the opening price, and no shadow extends beneath the candlestick’s body. In that case, it depicts the price closed at its lowest level during the candlestick's duration, which is considered a further indication of bearishness. Bearish refers to being pessimistic about the stock’s price, believing that the price will decline further.
Additionally, when the candlestick’s upper body is 3-4 times longer than the entire body, it also indicates a forthcoming bearish reversal. This depicts that although the traded price is considerably more during the candlestick duration, traders rejected these prices as sellers joined the market and buyers left.
Ultimately, the price drops significantly and forms the candlestick shooting star pattern.
It's also essential to understand the similarity between the shooting star and the inverted hammer candlestick patterns, as they can often be confused by beginners. Both patterns have a small body and a long upper shadow. However, the key difference lies in their placement within a trend. The shooting star pattern appears after a price advance and signals a potential downward reversal, indicating that selling pressure is starting to outweigh buying pressure.
On the other hand, the inverted hammer occurs after a price decline and suggests a potential upward reversal, showing that buyers are attempting to push the price up. Recognizing this distinction is crucial for traders to make informed decisions based on the context of the pattern within the prevailing trend.
How to Trade a Shooting Star Candlestick
You can easily spot the shooting star candlestick pattern, which makes it an effective strategy for most traders trading in financial markets. You can use this pattern to trade in futures, currencies, stocks, forex, and other financial instruments. However, every trader must adhere to a few steps when making critical trading decisions using this pattern. These include.
-
Entry: As a trader, you must check that the previous price was actively bullish before entering a trade based on this pattern.
-
Stop loss: Experts recommend using a stop-loss order when trading through this pattern. The stop-loss order refers to buying or selling a stock when the price hits the stated price called the stop price. A stop order becomes a market order when the stop price is achieved
-
Booking profits: As a whip-smart trader, you must choose a price target that is the same as the shooting star pattern size
Typically, trading using the reversal pattern is pretty straightforward. First, the trading analysis begins by identifying the upward trending prices. Then, the shooting star candlestick pattern forms. When you observe a bigger upper candlewick and a small body, it confirms the formation of the pattern.
Next, the bearish candle that follows the shooting star confirms the pattern. Consequently, you sell the security and place a stop-loss order right above the upper wick, securing your short trade.
So if the price makes a surprising bullish move due to significant fluctuation, your short trade will remain protected. The distance between the level you short high priority queue (HPQ) and the stop loss level order will determine your maximum loss.
You must stay in the trade until the price fluctuation closes the candle above your minimum target to maximize profits. As soon as the candle exceeds well beyond the minimum target and is relatively bigger, it’s a perfect time to exit.
Example of a trade on the shooting star pattern
In the following example of a shooting star candlestick pattern, we observe a scenario ideal for traders who are vigilant in spotting potential reversals.
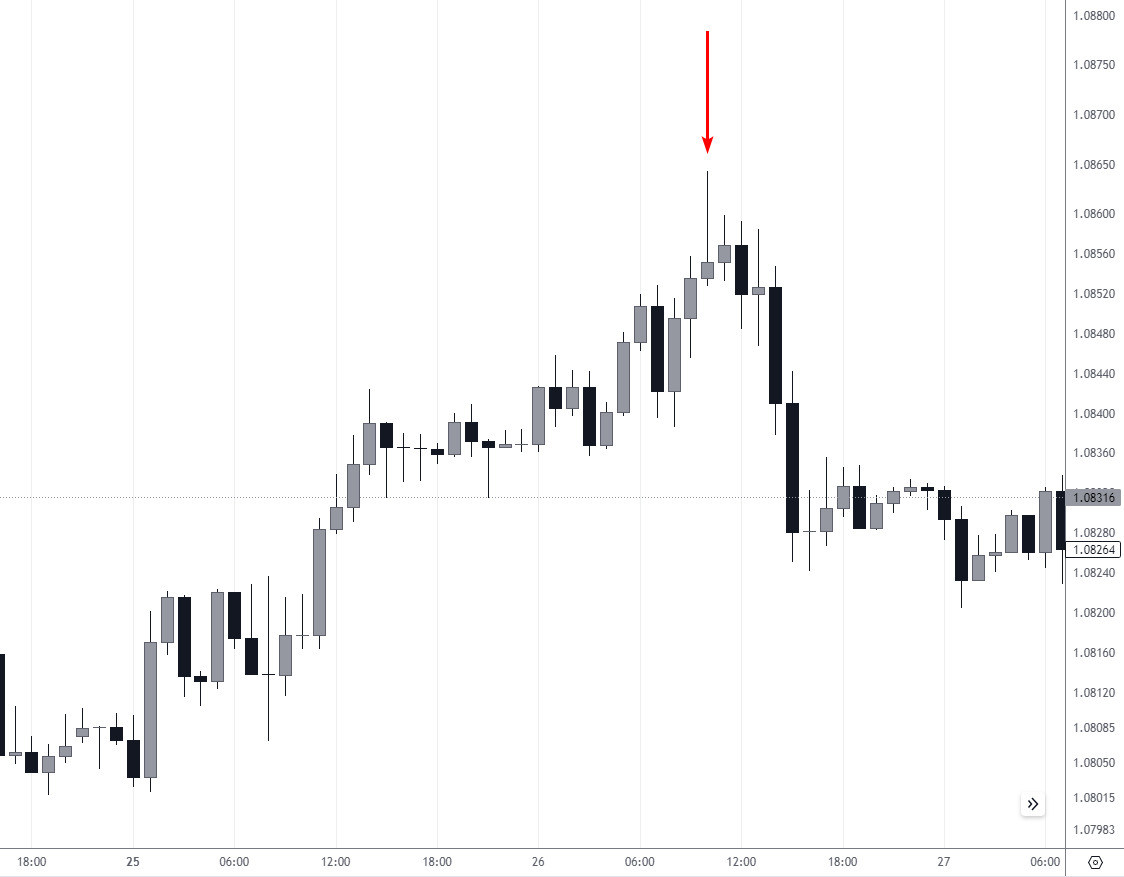
Shooting Star pattern: Example on the 1-hour EUR/USD chart
Here’s how to identify and trade this pattern:
-
Identification: The shooting star is recognized by its small body at the lower end of the trading range and a long upper shadow that is typically at least twice the length of the body. This pattern emerges at the end of an uptrend, signifying that the buyers are losing control to the sellers. The body color of the candle can be red or green, however, a red body further confirms the bearish sentiment
-
Entry: A trade is initiated after the shooting star pattern is confirmed. Confirmation occurs if the candle following the shooting star closes below the body of the shooting star. Traders should enter a short position (sell) at the open of the next candle after the shooting star, ensuring the bearish trend is validated
-
Stop Loss: To manage risk, a stop loss is placed just above the upper shadow of the shooting star candlestick. This ensures that if the price moves against the trade, indicating a false reversal signal, losses are minimized
-
Exit: The exit strategy can vary depending on the trader's style. A conservative trader might set a target at a previous level of support or use a trailing stop to lock in profits as the price moves downward. A more aggressive trader may look for confirmation from other technical indicators or wait for a bullish reversal pattern before exiting the position to maximize potential gains
Using the shooting star pattern as part of a comprehensive trading strategy, with strict risk management rules, can help traders make calculated and disciplined trades.
What Is a Hammer?
The hammer candlestick pattern is a formation that often heralds a bullish reversal, particularly when it appears at the bottom of a downtrend. Characterized by a small real body and a long lower shadow, the hammer pattern is a signal that the market is attempting to find a bottom.
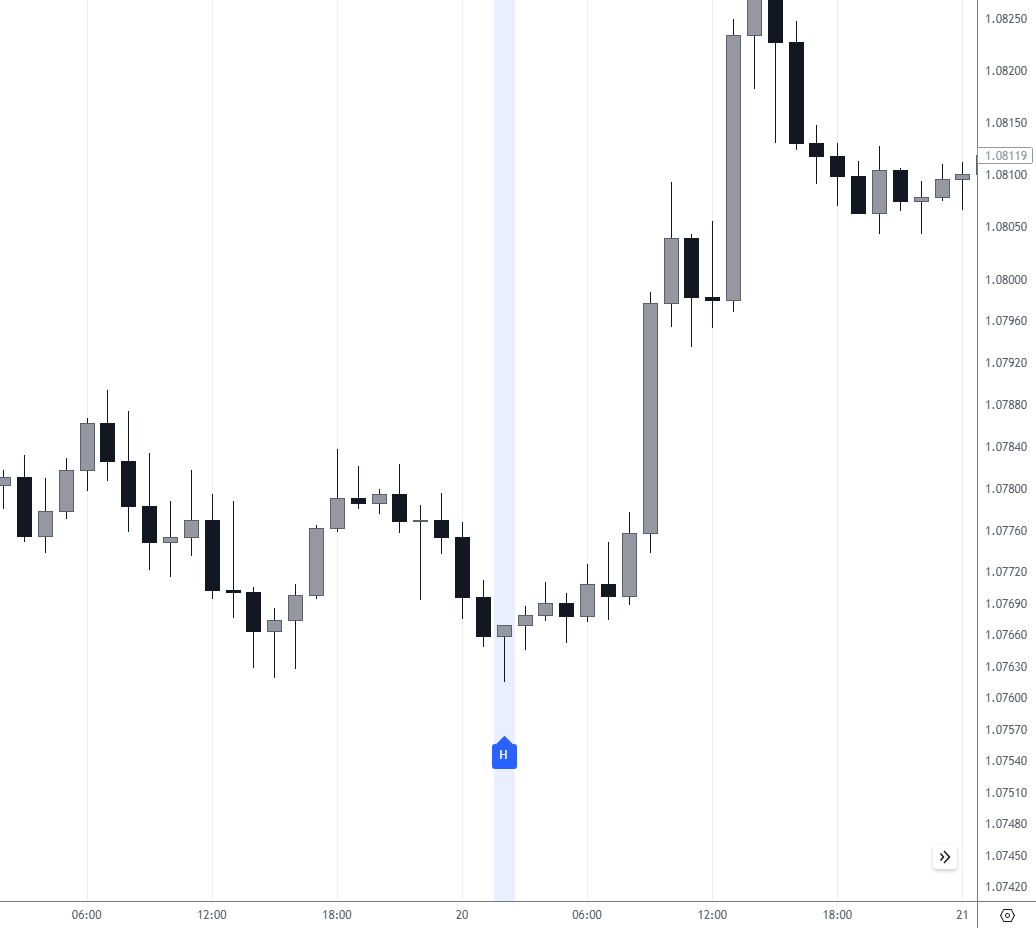
Pay more attention to the bullish "Hammer" pattern near the previous support levels
This occurs as the price drops significantly during the trading period but then rebounds to close near the opening price, reflecting the buyers regaining control after an initial sell-off.
Key Characteristics of the Hammer Candlestick:
-
Presence in Downtrends: The hammer pattern typically appears at the end of a downward trend, marking potential bullish reversal points
-
Price Behavior: This pattern forms when the price falls significantly below the opening price but makes a strong recovery to close near or slightly above the open
-
Real Body: The body of the hammer candlestick is small, showing the narrow range between the opening and closing prices
-
Lower Shadow: The most distinctive feature is its long lower shadow, which should be at least twice the length of the body, representing the rejection of lower prices
How to trade:
-
Confirmation: Traders usually wait for a confirmation candle, which closes higher than the hammer's close, to validate the pattern
-
Entry Point: A common entry point for a trade is above the hammer's real body or the confirmation candle's close
-
Stop Loss: A stop loss can be set below the low of the hammer to protect against false reversals
-
Target: The target can be set at a previous resistance level or using a risk-reward ratio that aligns with the trader's strategy
What Is an Inverted Hammer?
The inverted hammer candlestick pattern is a signal in technical analysis that suggests a potential reversal of a downtrend. It is characterized by a small body at the lower end of the trading range, with a long upper shadow (wick) that is at least twice the length of the body, and little to no lower shadow.
This pattern indicates that despite selling pressure, buyers managed to push the price up. This could suggest that the sellers are losing control and a bullish reversal is imminent.
The key difference between the inverted hammer and the hammer pattern lies in their positioning and the direction of the long shadow. The inverted hammer has a long upper shadow and appears at the end of a downtrend, signaling a potential bullish reversal.
Conversely, the hammer pattern has a long lower shadow, appears at the end of a downtrend as well, but is considered a more direct indicator of a bullish turnaround.
To identify an inverted hammer, look for a candlestick with the following characteristics at the end of a downtrend:
-
A small body at the lower end of the trading range
-
A long upper shadow that is at least twice as long as the body
-
Little to no lower shadow
For a hammer pattern, the criteria are similar but inverted:
-
A small body at the upper end of the trading range
-
A long lower shadow that is at least twice as long as the body
-
Little to no upper shadow
How to Trade an Inverted Hammer?
Trading an inverted hammer pattern requires careful consideration of the market context and confirmation signals.
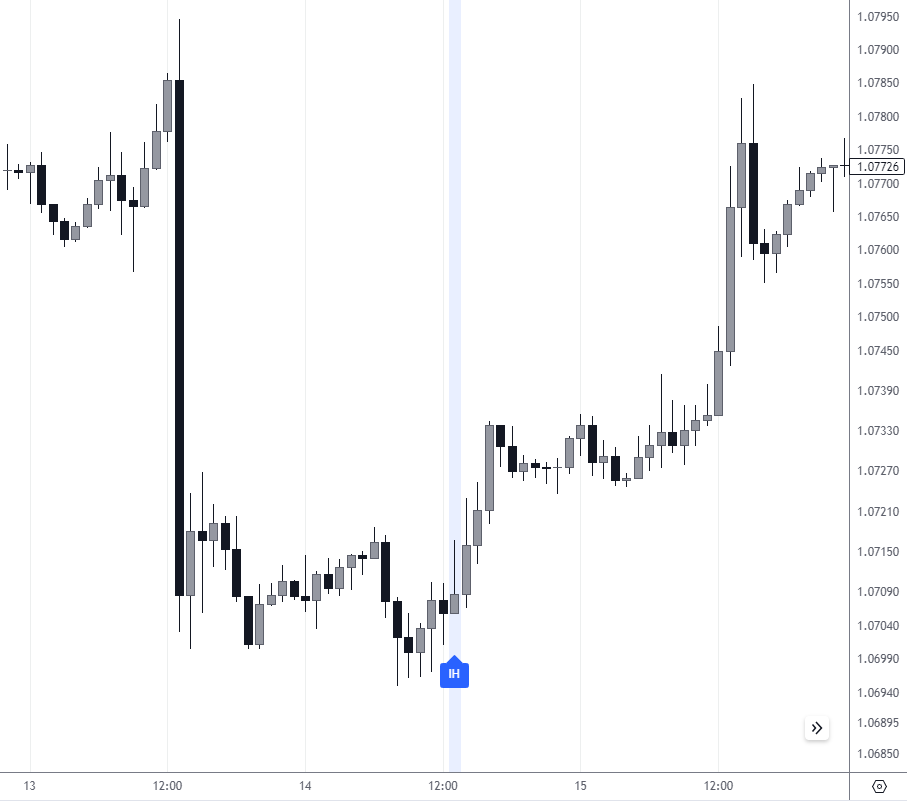
Example of an inverted hammer pattern: Buyers show an attempt to retake the initiative after signs of exhaustion of sellers' pressure
Here's a basic strategy:
-
Confirmation: Look for confirmation the day after the inverted hammer pattern appears. Confirmation can come in the form of a bullish candlestick (closing higher than the open) that suggests buyers are taking control of the market
-
Entry Point: Consider entering a trade at the open of the candle following the confirmation candlestick, assuming it continues to show bullish momentum
-
Stop-Loss: To manage risk, place a stop-loss order below the low of the inverted hammer. This protects against the risk of a false reversal signal
-
Profit Targets: Set profit targets based on previous resistance levels, Fibonacci retracement levels, or a predetermined risk-reward ratio that fits your trading plan
Inverted hammer vs Shooting star
The shooting star and inverted hammer patterns are visually similar. The difference is in the market context (current trend).
| Pattern | Bullish or Bearish | Difference |
|---|---|---|
|
Shooting star |
Bearish |
A shooting star is a bearish reversal pattern that occurs at the top of an uptrend. It has a small lower body with a long upper shadow and little to no lower shadow |
|
Inverted hammer |
Bullish |
The inverted hammer is a bullish reversal pattern appearing at the bottom of a downtrend. It has a small body at the lower end of the range with a long upper shadow |
|
Hammer |
Bullish |
A hammer is a bullish reversal pattern that occurs during a downtrend. It features a short body with a long lower shadow and little to no upper shadow |
Expert Opinion
“When dealing with candlestick patterns like the Shooting Star, Inverted Hammer, and Hammer, always remember that context is king. These patterns offer clues to potential market reversals, but they must be considered within the larger market trend and in conjunction with other indicators.
The Shooting Star warns us of a potential bearish reversal after an uptrend, while the Hammer and Inverted Hammer suggest a bullish shift could be on the horizon. Before you act on these signals, confirm with volume, moving averages, or momentum oscillators. Successful trading is not just about recognizing patterns; it’s about validating them with the full picture the market paints.”

Summary
Shooting star candlestick pattern forms when an asset’s price opens, rises significantly, and then closes near the open price. Pros and newbie traders widely use this pattern because it is easy to identify and relatively reliable.
However, it is best to use it alongside other metrics like price trends, volume and momentum indicators, moving averages, and more to minimize the risk. It creates a safety net for you in the event the market doesn’t move in the desired direction.
Glossary for novice traders
-
1
Investor
An investor is an individual, who invests money in an asset with the expectation that its value would appreciate in the future. The asset can be anything, including a bond, debenture, mutual fund, equity, gold, silver, exchange-traded funds (ETFs), and real-estate property.
-
2
Options trading
Options trading is a financial derivative strategy that involves the buying and selling of options contracts, which give traders the right (but not the obligation) to buy or sell an underlying asset at a specified price, known as the strike price, before or on a predetermined expiration date. There are two main types of options: call options, which allow the holder to buy the underlying asset, and put options, which allow the holder to sell the underlying asset.
-
3
Cryptocurrency
Cryptocurrency is a type of digital or virtual currency that relies on cryptography for security. Unlike traditional currencies issued by governments (fiat currencies), cryptocurrencies operate on decentralized networks, typically based on blockchain technology.
-
4
Index
Index in trading is the measure of the performance of a group of stocks, which can include the assets and securities in it.
-
5
Forex Trading
Forex trading, short for foreign exchange trading, is the practice of buying and selling currencies in the global foreign exchange market with the aim of profiting from fluctuations in exchange rates. Traders speculate on whether one currency will rise or fall in value relative to another currency and make trading decisions accordingly. However, beware that trading carries risks, and you can lose your whole capital.


Team that worked on the article

Vuk stands at the forefront of financial journalism, blending over six years of crypto investing experience with profound insights gained from navigating two bull/bear cycles. A dedicated content writer, Vuk has contributed to a myriad of publications and projects. His journey from an English language graduate to a sought-after voice in finance reflects his passion for demystifying complex financial concepts, making him a helpful guide for both newcomers and seasoned investors.

Dr. BJ Johnson is a PhD in English Language and an editor with over 15 years of experience. He earned his degree in English Language in the U.S and the UK. In 2020, Dr. Johnson joined the Traders Union team. Since then, he has created over 100 exclusive articles and edited over 300 articles of other authors.

Mirjan Hipolito is a journalist and news editor at Traders Union. She is an expert crypto writer with five years of experience in the financial markets. Her specialties are daily market news, price predictions, and Initial Coin Offerings (ICO).
