Top 5 Strong Reversal Candlestick Patterns in Trading


Editorial Note: While we adhere to strict Editorial Integrity, this post may contain references to products from our partners. Here's an explanation for How We Make Money. None of the data and information on this webpage constitutes investment advice according to our Disclaimer.
MetaTrader 4 (MT4) offers a user-friendly interface, comprehensive resources for learning, built-in indicators, demo accounts for practice, and even copy trading features.
Pattern is a candle formation that has a logical explanation and signals further price movement. Patterns can consist of one candle, several candles or several combinations of candlestick models. Reversal patterns are the easiest to identify visually. You will learn about them from this review.
In this review you will learn:
What reversal patterns are and how they form.
What the types of reversal patterns are and how to identify them on a chart.
What custom indicators for automatic pattern identification there are.
The article will be of particular use to novice traders, who are learning about technical analysis.
How to Trade Reversal Candle in Forex Trading
Forex Trading Course for Beginners by Treaders Union
What are reversal patterns and how do they form?
Forex reversal patterns are candlestick patterns that warn about a reversal of price movement. They can warn about the following:
A change of the main trend. It is preceded by a long movement with a superior number of main direction candles (bullish candles for an upward trend, bearish candles for a downward trend).
A start of correction. A weak signal of a reversal pattern may indicate that the reversal is temporary and the main trend will continue.
An end of correction. Formation of a reversal pattern on the downward correction of an upward trend indicates continuation of the upward price movement.
Example
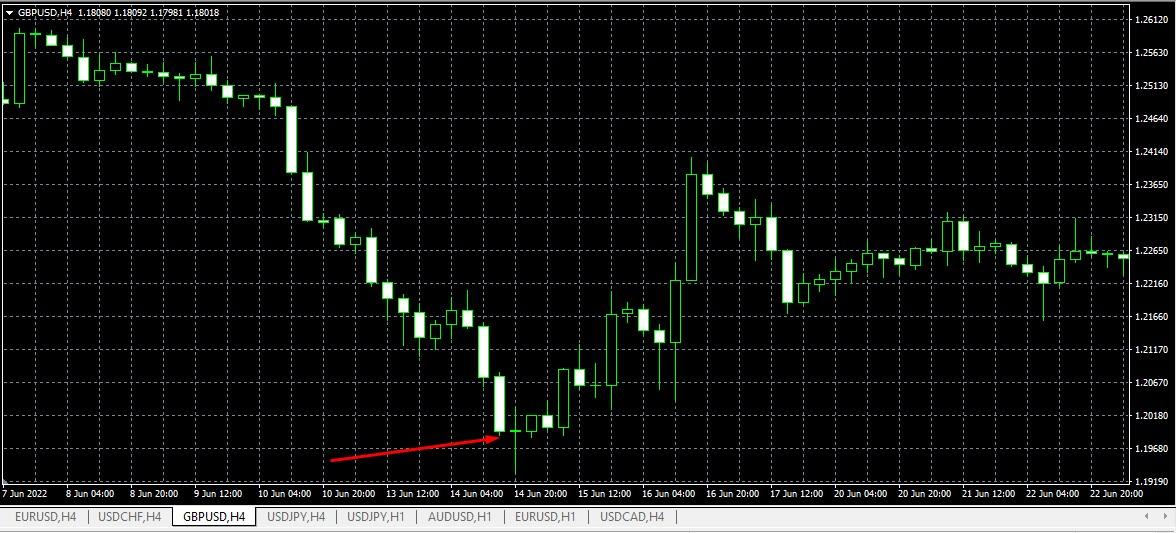
 Reversal pattern
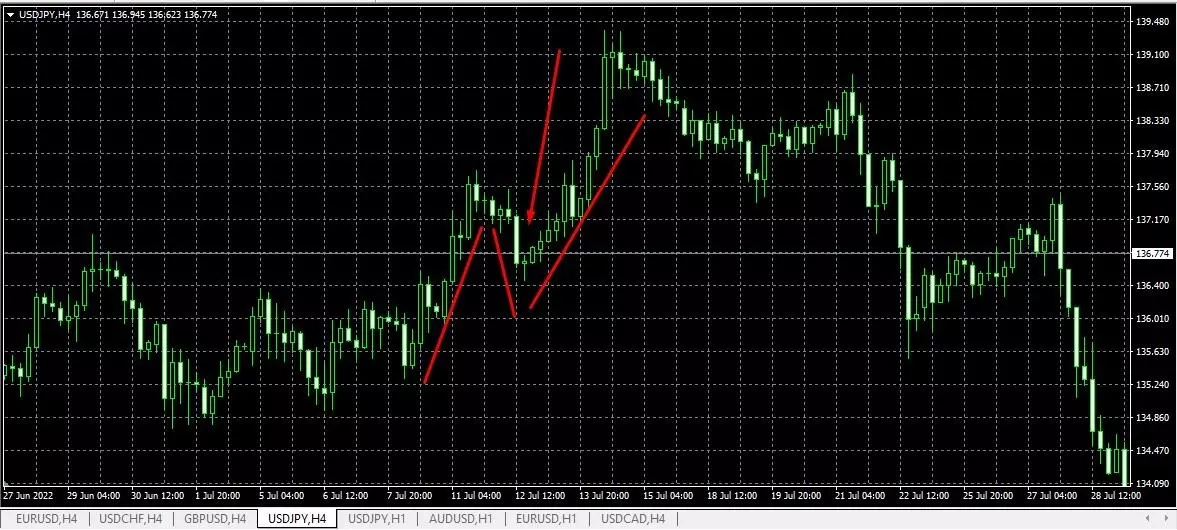
A correction formed on an upward trend, ending with a pin bar with a long candlestick downwards. Then, Three White Soldiers appeared, indicating continuation of the upward movement.
Top 5 Best Reversal Pattern of Candlestick Analysis
Reversal candlestick patterns are equally effective for upward and downward trends. They can be mirrored at the bottom of the trend and at the top. Or, on the edges of the channel. Despite that some have different names on the bullish and bearish trend, their meaning is the same.
Pin Bar, Hammer and Shooting Star
A Pin Bar pattern consists of three candles. Side candles have relatively small shadows, and the central candle has a small body and a long shadow in the direction of the primary trend.
A Pin Bar is a relatively strong signal in itself. However, it is even better if it is a part of a larger candlestick formation – a Hammer on the downward trend or Inverted Hammer on the upward trend.
Signs of a Hammer (Falling Star):
A Hammer forms at the end of a downward trend, a Shooting Star forms at the end of an upward trend.
The pattern is preceded by a slowing trend.
Pin Bar is the central part of the pattern. A long shadow down – for a downward trend, up – for an upward trend
It is desirable that the Pin Bar is a candle in the direction of the old trend. Appearance of a Pin Bar in the direction of the primary trend indicates that buyers/sellers have finally run out of steam.
The names of the patterns different in different sources. For example, Hammer is called Morning Start for the bearish market. This, however, is not a significant factor.
Example
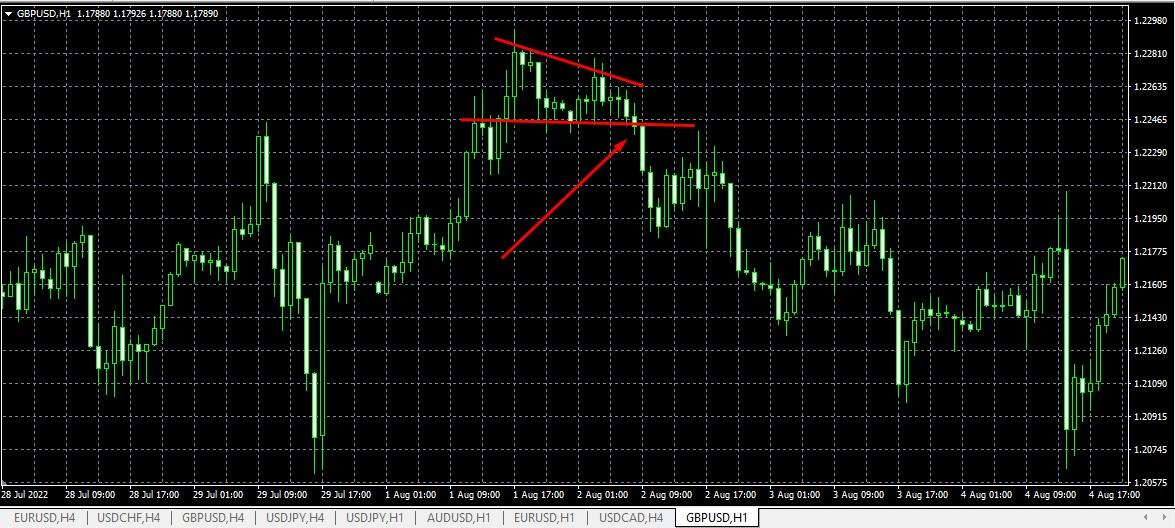
 Pin bar, hammer and shooting star patterns
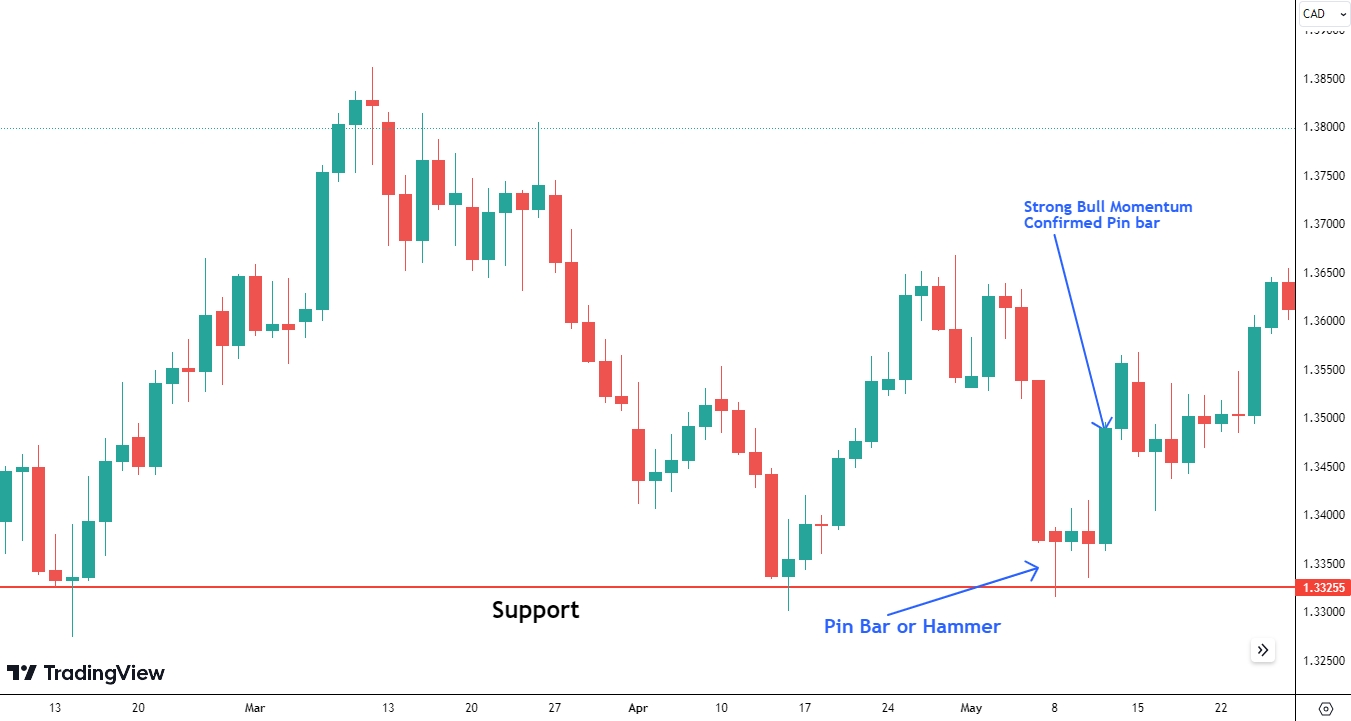
On a downward trend, a candle is formed without a shadow up, with a relatively small body and white (in this case, a bearish candle). The pattern will be fully formed when an ascending candle with a large body appears. The pattern here is not entirely accurate, but the balance of sellers and buyers that formed three small candles can be considered a confirmation of the signal. The sellers ran out of steam, and the initiative was seized by the buyers.
Engulfing
This pattern is identical to Hammer, with the only difference being that the emphasis is placed on two candles at the time of the reversal. It is not required for the Pin Bar to be the signal candle in this case. It is enough for the reversal candle to fully engulf its body, to be at least 1.5-2 times bigger in size. A position is opened when one more candle in the direction of the new trend appears after the formed pattern.
Example
 Engulfing
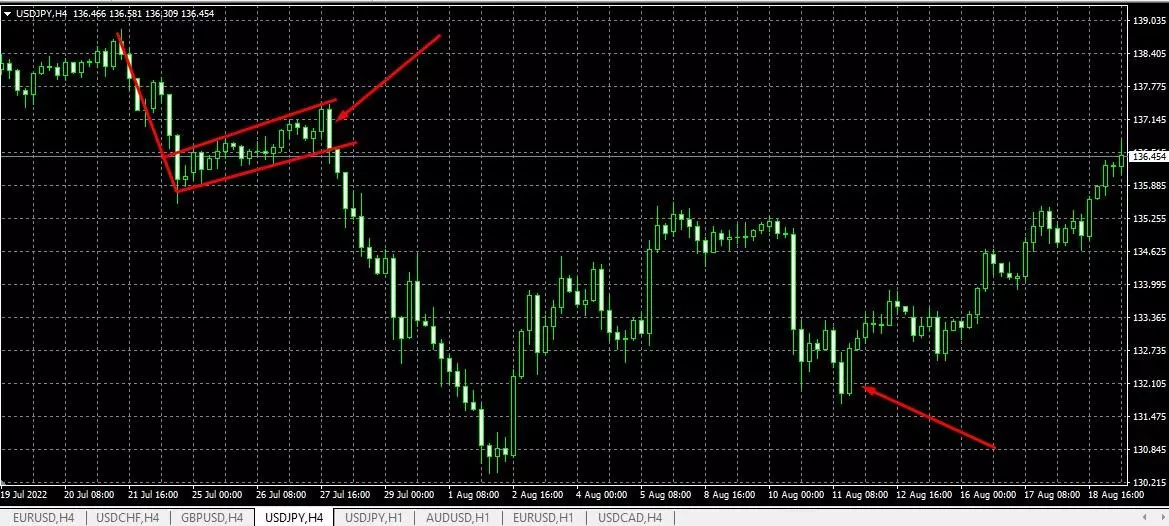
In the first example, we can observe a perfect formation of a combination of patterns. On the downward trend, correction is formed, indicating the Pennant pattern. However, the breakout of the channel may be both up and down. Next, Engulfing appears: the bearish candle fully engulfs two previous bullish candles. The second and third bearish candles confirm the downward movement, forming another pattern – the Three Black Crows.
The second example is less evident, but the pattern formed, giving a signal about an upward trend.
Hanging Man and Inverted Hammer
The Hanging Man is a version of the Hammer and Pin Bar. The Inverted Hammer is a hammer with the shadow in the opposite direction. The only difference is in the direction of the shadow. The Hammer on the downward trend has a down shadow, and the Inverted Hammer – up. The Hammer means that the sellers did their best to push the price down, but the buyers were able to balance the market. The Inverted Hammer means that buyers have already taken a step in the direction of a trend reversal, but the market is still in balance. The Inverted Hammer with a shadow up is formed at the end of a bearish trend, the Hanging Man with a shadow down – at the end of an uptrend.
Example
 Hanging Man and Inverted Hammer Pattern
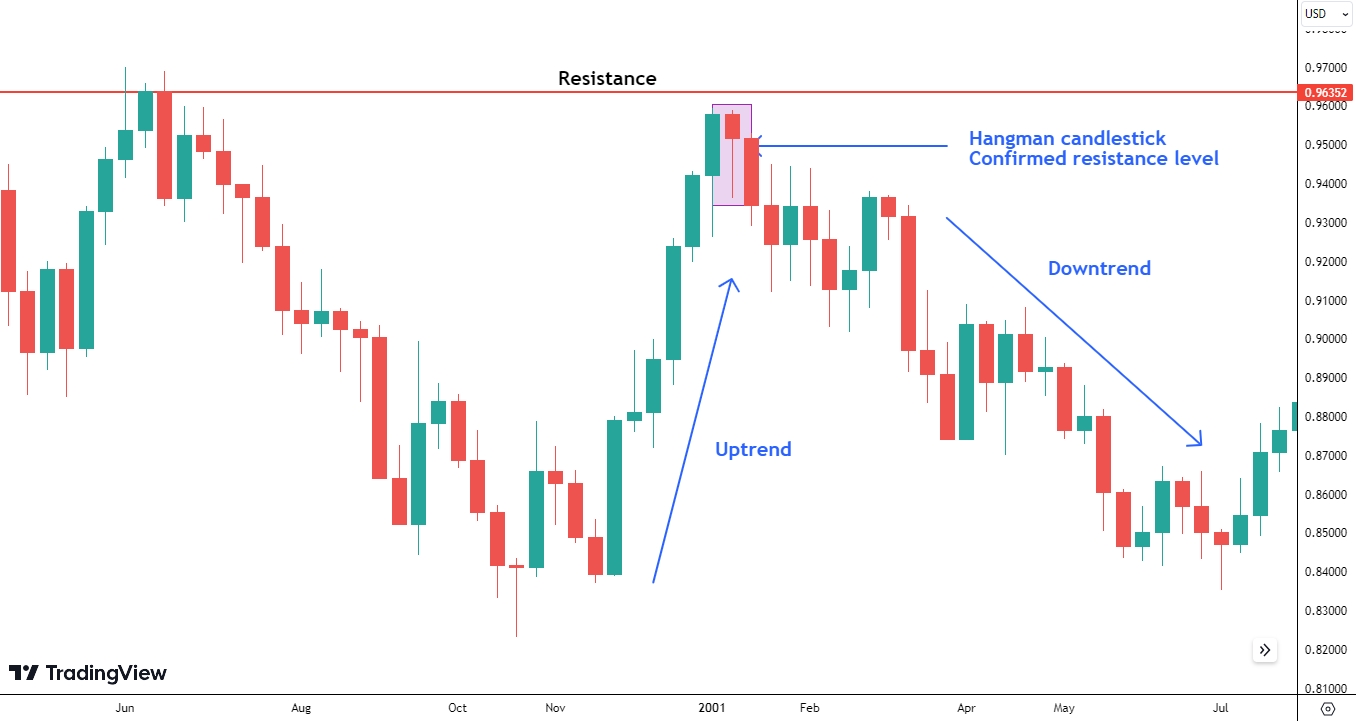
A candle with a small body and a long shadow down – the Hanging Man pattern, is formed at the end of the upward trend. The signal would have been strong, if the candle bodies on the upward trend became smaller, instead of growing.
Doji
This is a reversal pattern on Forex that works on the same principle as Pin Bar. The difference is that a shadow in any direction is allowed (Pin Bar only has the shadow in the direction of the trend preceding the reversal); there is no candle body. The logic of the pattern is the balance between sellers and buyers.
Rules of formation:
The pattern was preceded by a strong trend – a clear trend movement. The formation of a Doji in a flat market or during a chaotic price movement is not a signal.
A candle appears after a medium or large trending candle.
An opposite candle appeared after the pattern.
Example
 Doji pattern
Correct pattern formation. There is a strong downward movement, a candle without a body with shadows in both directions, and the opposite candle after the Doji.
Double bottom and double top
This is a strong reversal pattern formed by a large number of candles and therefore identified on a reduced scale. It is a model of a long-term trend change, the logic of which is a strong struggle between sellers and buyers, pushing the price to the nearest support/resistance level and returning it to the extremum. The pattern is formed at the end of an upward trend or downward trend.
The complexity of identifying the pattern is in finding the highs/lows at different levels. The second difficulty is the number of highs (peaks). In an active market with large trading volumes, three highs can form, forming a pattern similar to Head and Shoulders. The signal is the complete formation of extremes and the breakout of the support/resistance level. A well-formed chart gives a signal of the beginning of a long-term trend.
Example
 Double Top Pattern
Two highs (peaks) formed on an upward trend. A position is opened at the breakout of the resistance level.
Automated pattern identification systems
Formation of reversal patterns in Forex is clearly visible on a fading trend at the top or bottom of the wave movement. Candle bodies and their shadows are usually becoming smaller in this situation. Then Doji or Pin Bar appear, followed by a reversal and reverse movement with breakout of support or resistance levels. It is more difficult to identify complex patterns consisting of several movements: double or triple bottoms tops, Head and Shoulders, etc. That’s where indicators can help.
There are relatively few pattern indicators, but they are all highly effective. Here are several examples:
1. Head And Shoulders Dashboard. Different sources provide different versions of this indicator. The best version is the one that includes two components.
The first component searches for local double/triple tops, head/shoulders and triangles. On the chart, it shows patterns as triangles, so you don’t need to try to understand the logic of their construction – simply follow his arrow signals.
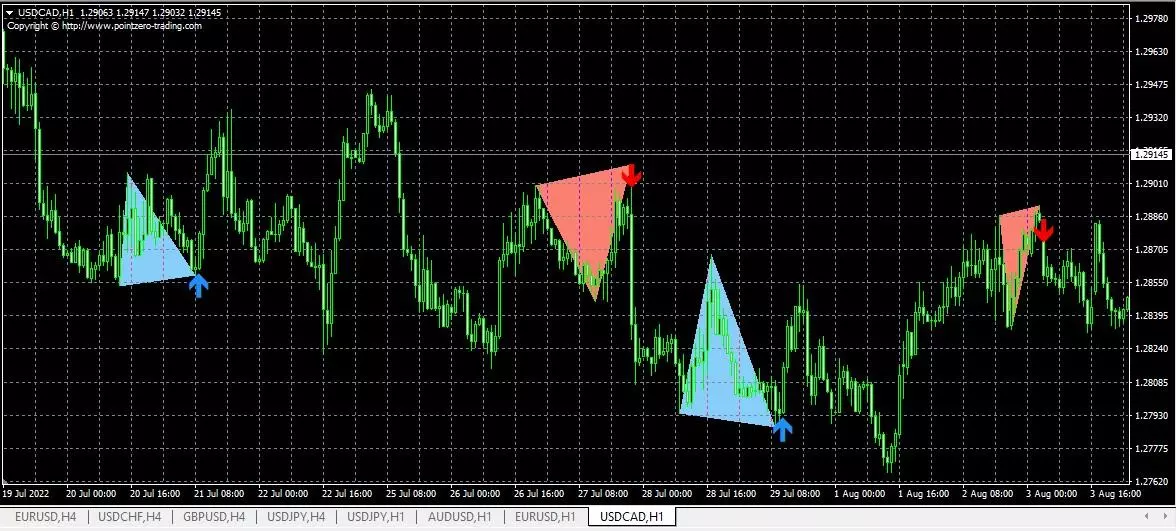 Triangles
The movements are short, but if you are using H4 timeframe, these movements are enough for a practically risk-free strategy.
The second part of the indicator seeks patterns on the long-term interval, and sometimes finds movements that are almost impossible to identify visually.
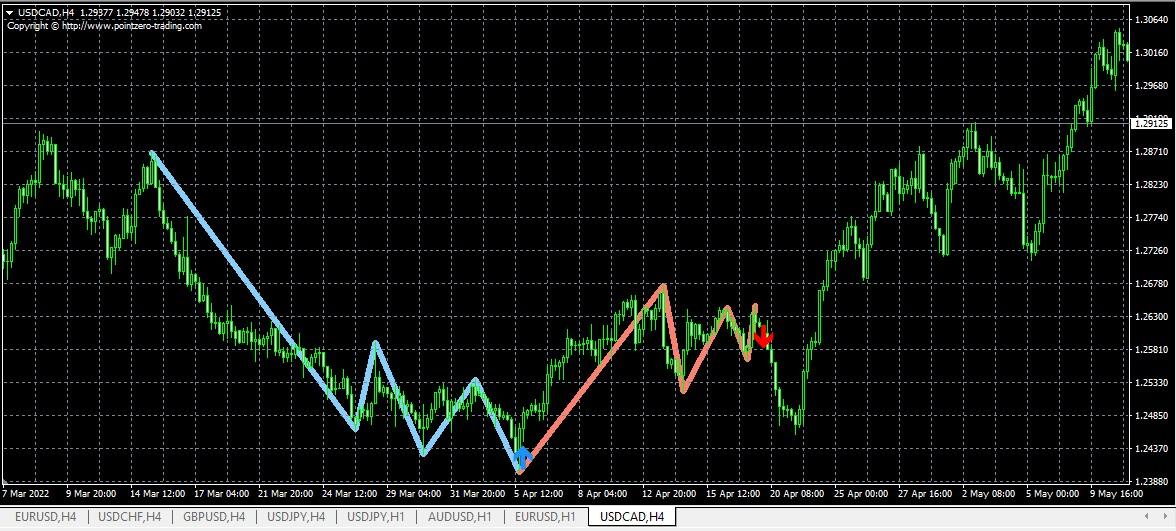 Patterns on a long-term interval
2. Ultimate Double Top-Bottom. The indicator perfectly identifies classic double bottom and trough. Its uniqueness is that it has a built-in alert system that is launched in a separate chart. Here’s how it looks:
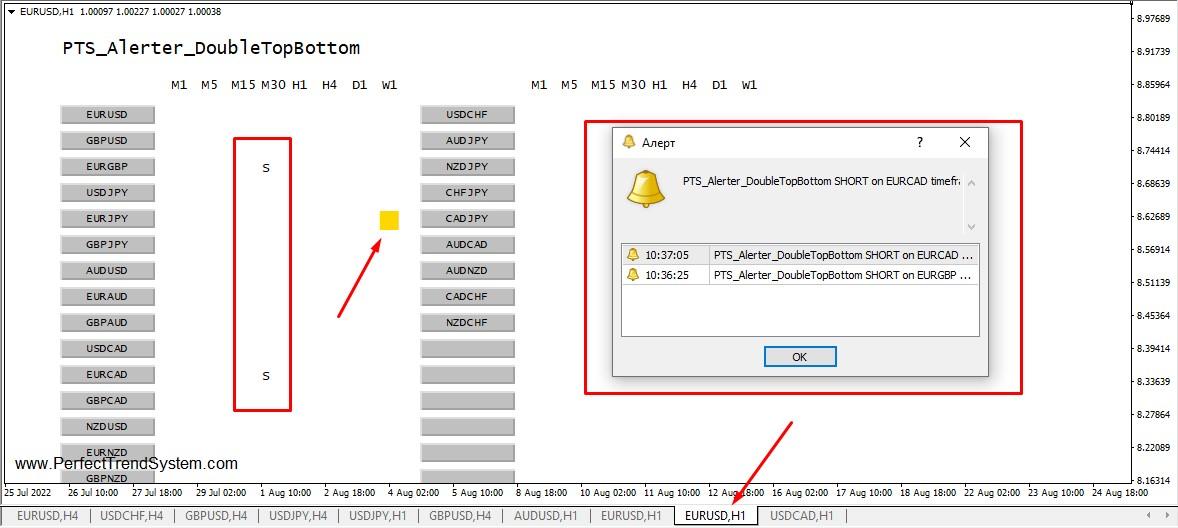 Ultimate Double Top-Bottom Indicator Scanner
The indicator scans major currency pairs and all timeframes live; the yellow square is a constantly moving scanner. When signals appear, there is a letter S next to the pair and an alert window. The signal indicates the first top/bottom, warning an investor that he/she needs to monitor the chart. After the second top/bottom appears, you need to wait for the breakout of support/resistance level and then open a position. If it doesn’t appear, the preliminary signal didn’t work.
The main part of the indicator is a ‘switchman’ that draws key support and resistance levels. Its signal looks as follows:
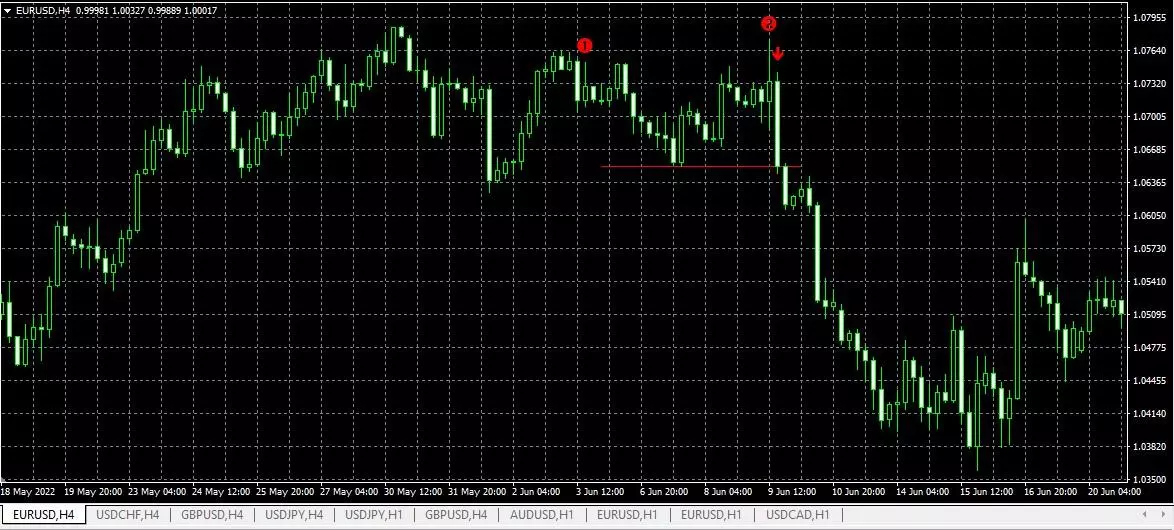 Signals of the Ultimate Double Top-Bottom indicator
The drawback of this indicator is that the free version works only on EUR/USD and GBP/USD pairs. The drawback of both indicators described above is rare signals. You can wait for one signal for 1-2 months; there is no sense in using the indicators on an interval lower than H1-H4. Nevertheless, their efficiency is higher than 90%.
Tips for using patterns
Here are some tips for using the patterns:
Use scaling. Increasing or reducing the scale will allow you to receive a clearer picture of previous extremes. Avoid the mistake of self-deception; avoid wishful thinking. Wait for the pattern to fully form, seek for the signal confirmation and then open a position.
Look for a combination of patterns. A combination of several patterns confirming each other is an amplifying signal. Open a position only on the next candle or the second candle after pattern formation or at breakout of key levels.
Do not open positions at the time of fundamental volatility no matter how strong the pattern is. The market can quickly change direction at those moments.
Use high timeframes. Patterns “do not know” how to distinguish prolonged strong and short-time correction movements. On a daily interval, a movement of 3-4 candles indicates profit, while on M5-M15 timeframe, this movement does not pay off the time.
Best Forex Brokers 2026


Conclusion
Patterns are an instrument of chart analysis that determines the future price movement based on crowd psychology. Patterns may indicate an imminent price reversal, its movement away from a flat or confirm the current trend. In trading strategies, they are used as confirming signals or for preliminary analysis in long-term strategies.
FAQs
What is the purpose of using reversal patterns in trading strategies?
Reversal candlestick patterns in Forex are used for finding signals in trend strategies. Preliminary analysis of market sentiment helps determine the current trend or a flat. Reversal patterns point to a start of a new trend, or the end of correction, confirming the signals of oscillators.
How do I identify reversal patterns?
Reversal patterns have several stages of formation (using the example of an upward trend):
Trend fading. The higher the price, the fewer people want to buy an asset and the more buyers who purchased at a lower price and now want to sell at a higher price. On the chart, it is shown by decreasing size of the bodies of ascending candles.
Reversal. A moment of balance comes on the market, when the volumes of buyers correspond to the volumes of sales or there are more sellers. A candle without a body and with a long shadow appears.
Beginning of a new trend. Long bearish candles appear, there is a breakout of support level or the trend line.
Many patterns are similar to each other or supplement one another. Do not try to remember their names. Just try to understand the way they form and learn to quickly identify them visually.
How do I use reversal patterns?
A reversal pattern must be fully formed. You must understand the meaning of reversal: a start or end of correction, a start of a new trend. And you need to understand the reason for it: influence of a fundamental factor or a natural reversal on another wave of the market. Patterns confirm signals of trend indicators and oscillators. A position is opened when an oscillator moves away from the overbought/oversold zone, a trend indicator shows a downward movement.
How effective are reversal patterns?
There is no instrument that would be 100% effective. The accuracy of signals depends on how well you use them: how you analyze the market, how you use other instruments, etc. Understanding the principles of using reversal patterns in combination with indicators and levels comes with experience. So, here’s an advice for you: gain experience by using a demo account and learn to test strategies in strategy testers.
Editors' Top Picks and Insights

AI without limits: How dangerous are neural networks?

Worldcoin on Wall Street: From iris scans to ETF

Mark Cuban's wealth philosophy: Why stocks matter more than salary or crypto

Dangerous but indispensable: Why the crypto market needs bridges

Markus Levin: DePIN could power the AI agent economy

Pokémon cards for $2,500: How collectibles became a new form of gambling
Related Articles
Team that worked on the article
Andrey Mastykin is an experienced author, editor, and content strategist who has been with Traders Union since 2020. As an editor, he is meticulous about fact-checking and ensuring the accuracy of all information published on the Traders Union platform.
Chinmay Soni is a financial analyst with more than 5 years of experience in working with stocks, Forex, derivatives, and other assets. As a founder of a boutique research firm and an active researcher, he covers various industries and fields, providing insights backed by statistical data.
Mirjan Hipolito is a journalist and news editor at Traders Union. She is an expert crypto writer with five years of experience in the financial markets.
Forex trading, short for foreign exchange trading, is the practice of buying and selling currencies in the global foreign exchange market with the aim of profiting from fluctuations in exchange rates. Traders speculate on whether one currency will rise or fall in value relative to another currency and make trading decisions accordingly. However, beware that trading carries risks, and you can lose your whole capital.
Ethereum is a decentralized blockchain platform and cryptocurrency that was proposed by Vitalik Buterin in late 2013 and development began in early 2014. It was designed as a versatile platform for creating decentralized applications (DApps) and smart contracts.
Copy trading is an investing tactic where traders replicate the trading strategies of more experienced traders, automatically mirroring their trades in their own accounts to potentially achieve similar results.
Options trading is a financial derivative strategy that involves the buying and selling of options contracts, which give traders the right (but not the obligation) to buy or sell an underlying asset at a specified price, known as the strike price, before or on a predetermined expiration date. There are two main types of options: call options, which allow the holder to buy the underlying asset, and put options, which allow the holder to sell the underlying asset.
Index in trading is the measure of the performance of a group of stocks, which can include the assets and securities in it.

-
 Afghanistan
-
 Albania
-
 Algeria
-
 Angola
-
 Argentina
-
 Armenia
-
 Australia
-
 Austria
-
 Azerbaijan
-
 Bahamas
-
 Bahrain
-
 Bangladesh
-
 Belarus
-
 Belgium
-
 Bolivia
-
 Botswana
-
 Brazil
-
 Brunei
-
 Bulgaria
-
 Cambodia
-
 Cameroon
-
 Canada
-
 Chile
Chile
-
 China
China
-
 Colombia
-
 Congo
Congo
-
 Costa Rica
-
 Cote d'Ivoire
-
 Croatia
-
 Cuba
Cuba
-
 Cyprus
-
 Czechia
-
 DR Congo
-
 Denmark
-
 Dominican Republic
-
 Ecuador
-
 Egypt
Egypt
-
 El Salvador
-
 Estonia
-
 Eswatini
-
 Ethiopia
-
 Finland
-
 France
-
 Georgia
-
 Germany
-
 Ghana
Ghana
-
 Greece
-
 Haiti
Haiti
-
 Hong Kong
-
 Hungary
-
 India
India
-
 Indonesia
-
 Iran, Islamic republic
-
 Iraq
Iraq
-
 Ireland
-
 Israel
-
 Italy
Italy
-
 Jamaica
-
 Japan
Japan
-
 Jordan
-
 Kazakhstan
-
 Kenya
Kenya
-
 Korea
Korea
-
 Kuwait
-
 Kyrgyzstan
-
 Laos
Laos
-
 Latvia
-
 Lebanon
-
 Lesotho
-
 Libya
Libya
-
 Lithuania
-
 Luxembourg
-
 Madagascar
-
 Malaysia
-
 Malta
Malta
-
 Mauritius
-
 Mexico
-
 Moldova
-
 Mongolia
-
 Montenegro
-
 Morocco
-
 Mozambique
-
 Myanmar
-
 Namibia
-
 Nepal
Nepal
-
 Netherlands
-
 New Zealand
-
 Nigeria
-
 North Macedonia
-
 Norway
-
 Oman
Oman
-
 Pakistan
-
 Palestine
-
 Panama
-
 Papua New Guinea
-
 Paraguay
-
 Peru
Peru
-
 Philippines
-
 Poland
-
 Portugal
-
 Puerto Rico
-
 Qatar
Qatar
-
 Reunion
-
 Romania
-
 Rwanda
-
 Saudi Arabia
-
 Serbia
-
 Singapore
-
 Slovakia
-
 Slovenia
-
 Somalia
-
 South Africa
-
 Spain
Spain
-
 Sri Lanka
-
 Sweden
-
 Switzerland
-
 Syria
Syria
-
 Taiwan
-
 Tajikistan
-
 Tanzania
-
 Thailand
-
 Trinidad and Tobago
-
 Tunisia
-
 Turkey
-
 UAE
UAE
-
 Uganda
-
 Ukraine
-
 United Kingdom
-
United States
-
 Uruguay
-
 Uzbekistan
-
 Venezuela
-
 Vietnam
-
 Yemen
Yemen
-
 Zambia
-
 Zimbabwe
- Forex
- Crypto
