Common Chart Patterns - complete guide
The experts at Traders Union have come up with the latest chart patterns cheat sheet. Using this, traders can easily understand how to identify the most common chart patterns and also learn how to trade them.
Chart patterns are collectively a vital tool in trading. They help traders identify trends, entry and exit points, and support and resistance levels to effectively improve the trading decision-making process. To make them simpler to understand for you, the experts at TU will in this article discuss the common chart patterns like Head and Shoulders, Rising and Falling Wedges, Double Tops and Bottoms, etc. and provide an illustrative cheat sheet for them.
Head and Shoulders
Head and Shoulders Illustration
Features
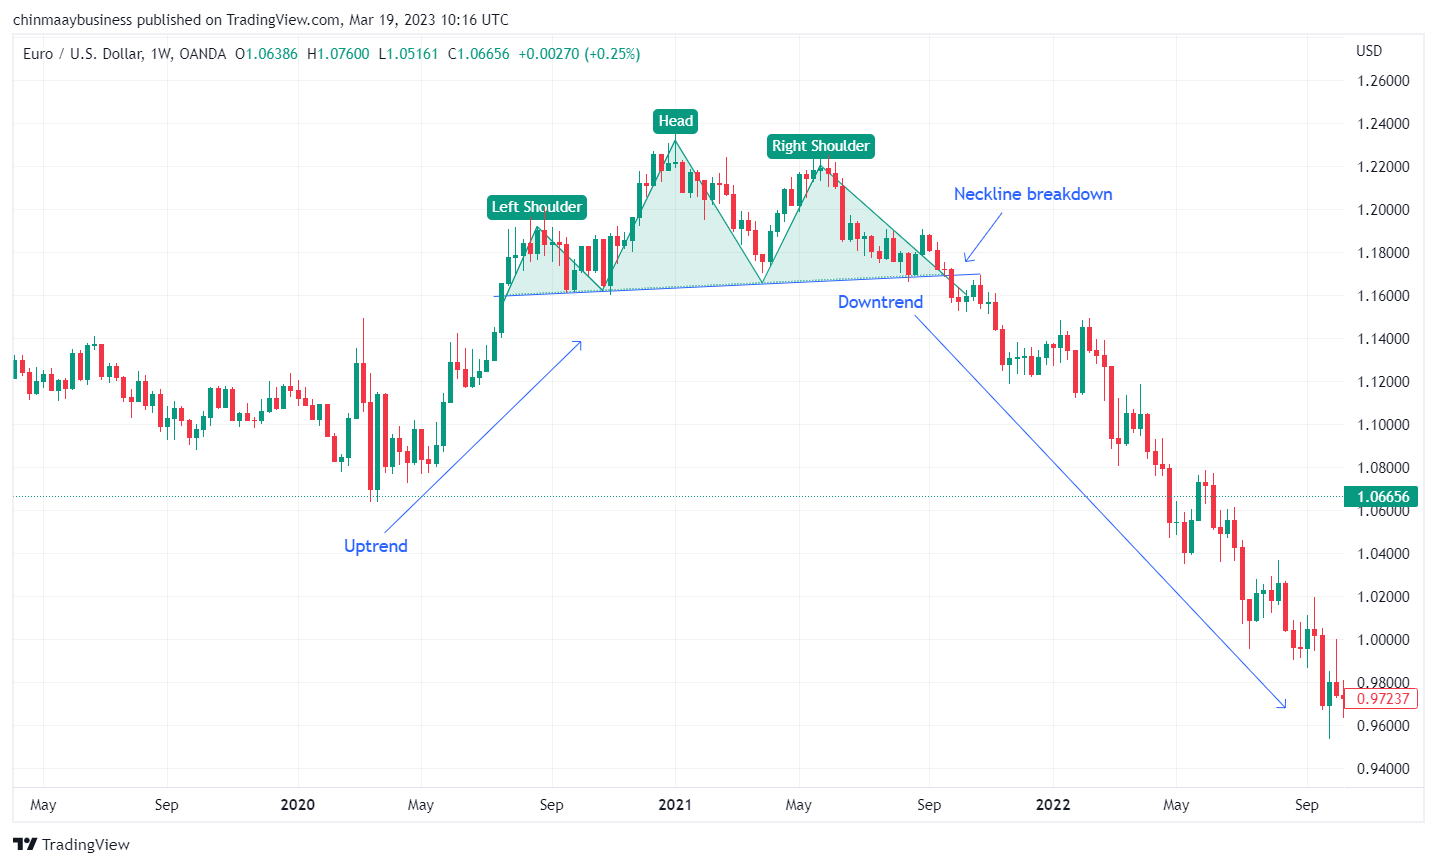
Head and Shoulders is primarily a bearish reversal pattern that primarily occurs at the end of an uptrend, signalling a shift from bullish to bearish sentiment. The pattern consists of three peaks, with the middle peak (the head) being higher than the two surrounding peaks (the shoulders). The support level that connects the low points between the shoulders is referred to as the neckline.
Example (Entry and Exit Points)
In the illustration above, you may observe that the price has been in an uptrend for some time. As the price reaches its first peak, it encounters selling pressure, causing it to dip slightly before rising again to form the second peak. After the second peak, the price dips again but bounces back to form the head, which is higher than both shoulders. As the price declines for the third time, it breaks below the neckline support, confirming the head and shoulders pattern. This neckline break would be the ideal entry point for a short trade. Exit can be made at the price level that is as far below from the neckline as the peak of the head is above it.
Rising and Falling Wedges
Rising Wedge Illustration
Falling Wedge Illustration
Features
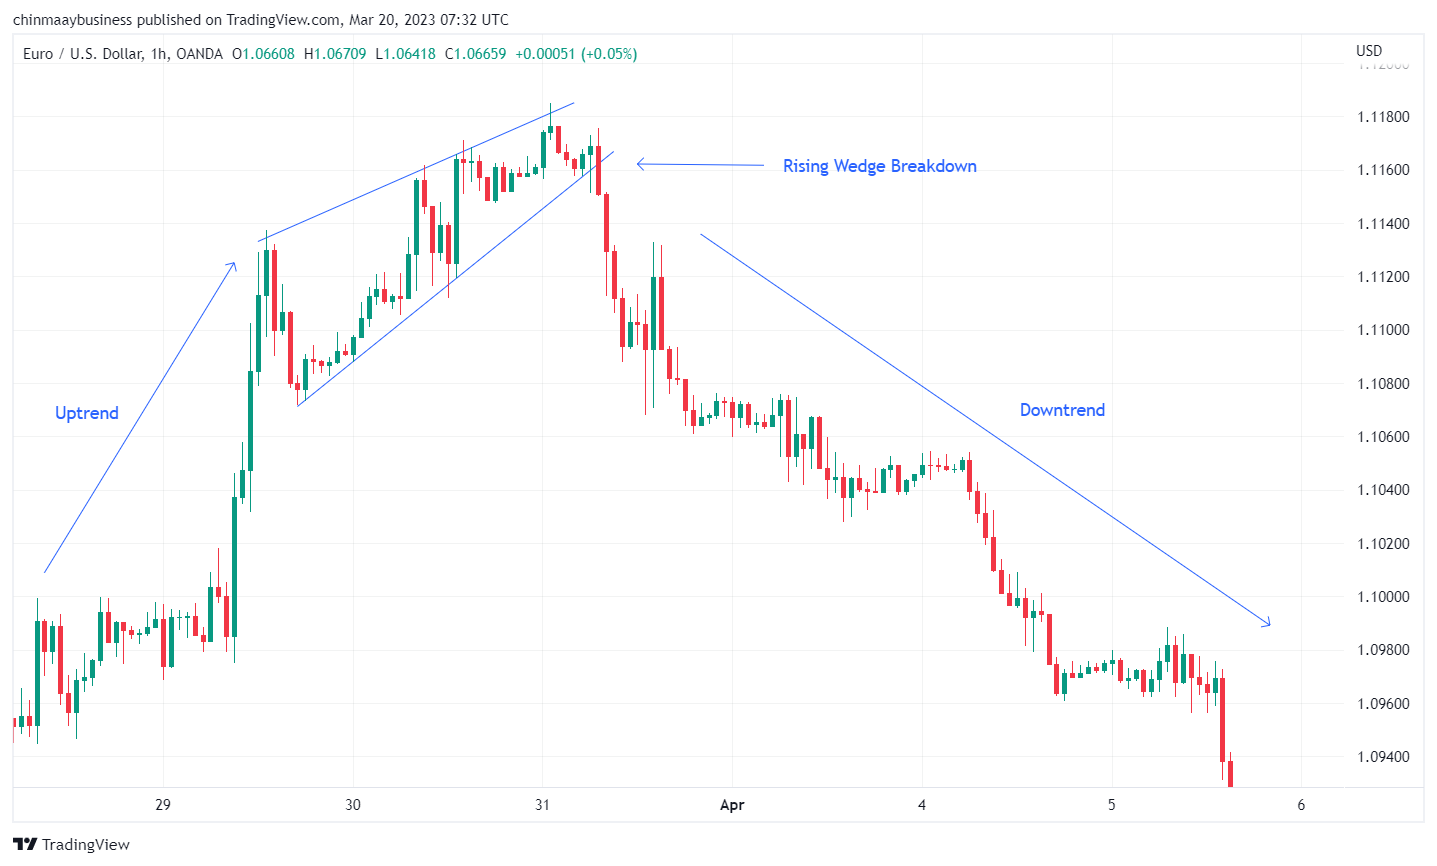
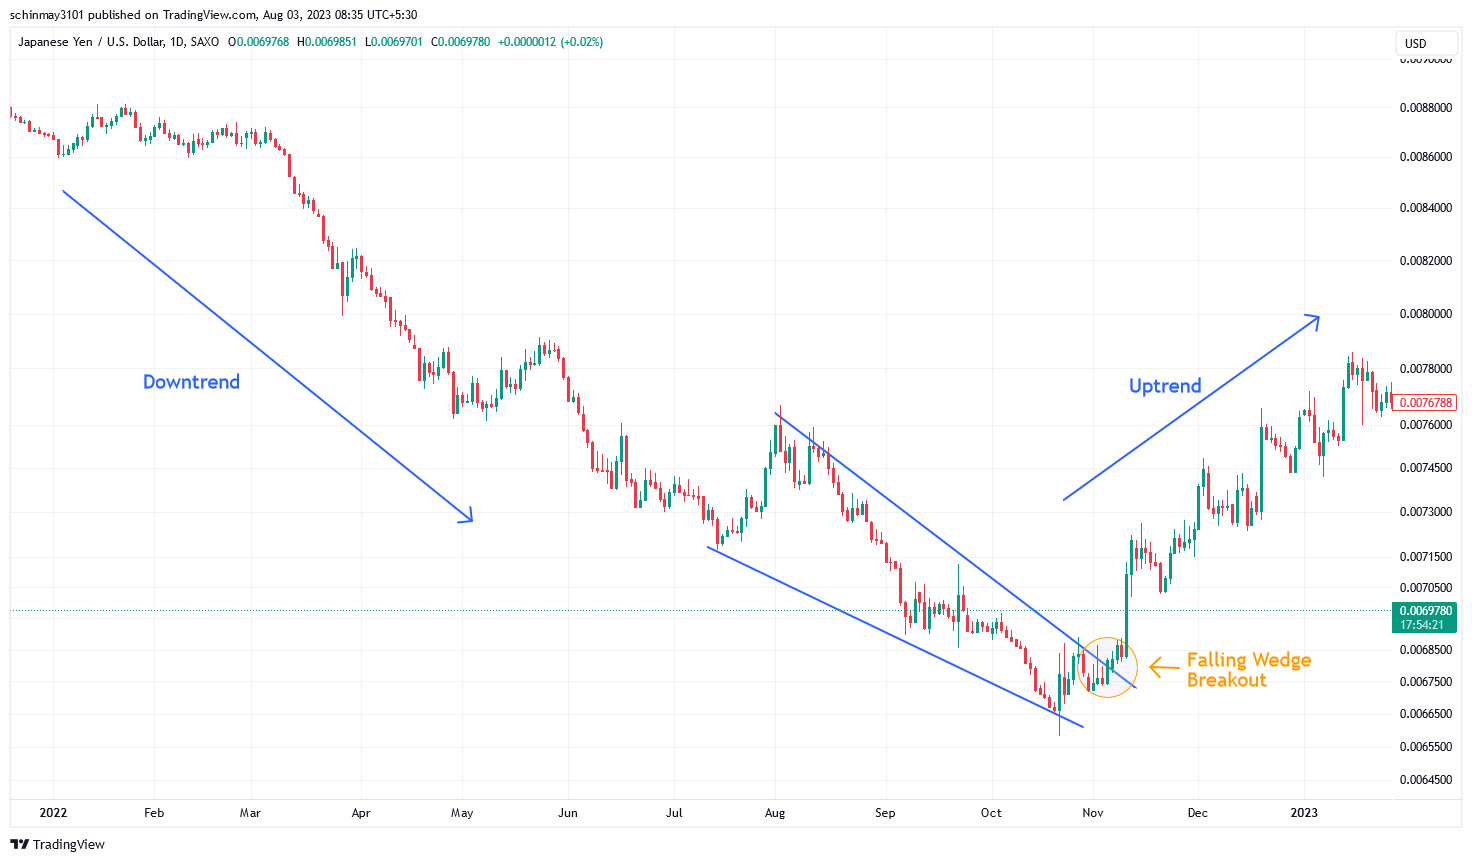
A wedge pattern is a type of reversal pattern formed by the convergence of two trend lines. It can be a rising wedges or falling wedge depending upon the trend in which they are formed. Generally, rising wedges form after an uptrend and indicate a bearish reversal while falling wedges form after a downtrend and indicate a bullish reversal. Both the types can span any number of days, weeks, months or even years. According to seasoned traders, the general rule is that the longer a wedge takes to form, the more explosive the breakout is likely to be.
Example (Entry and Exit Points)
A rising wedge is formed when the price makes higher highs and higher lows following an uptrend, but the angle of the trendlines connecting these highs and lows is narrowing. This indicates that the market is not supporting the upward momentum. Here, traders wait for a break below the lower trendline to enter a short trade. An ideal target for this pattern would be initial touch point of the lower trendline.
A falling wedge is formed when the price makes lower highs and lower lows following a downtrend, but the angle of the trendlines connecting these highs and lows is narrowing. This suggests that the market is not supporting the downward momentum. Here, traders wait for a break above the upper trendline to enter a long trade. An ideal target for this pattern would be initial touch point of the upper trendline.
Double Tops and Bottoms
Double Top Illustration
Double Bottom Illustration
Features
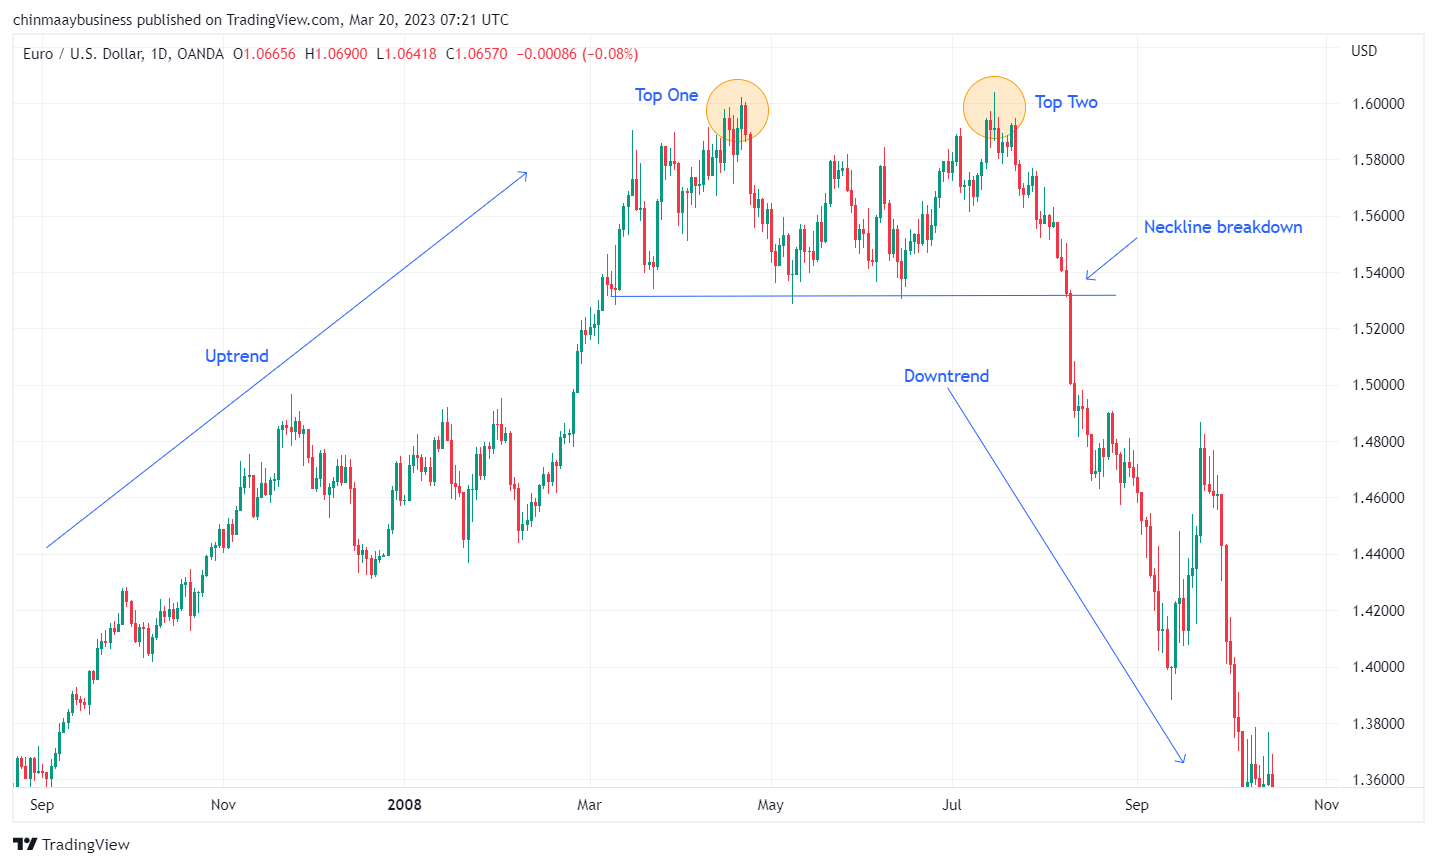
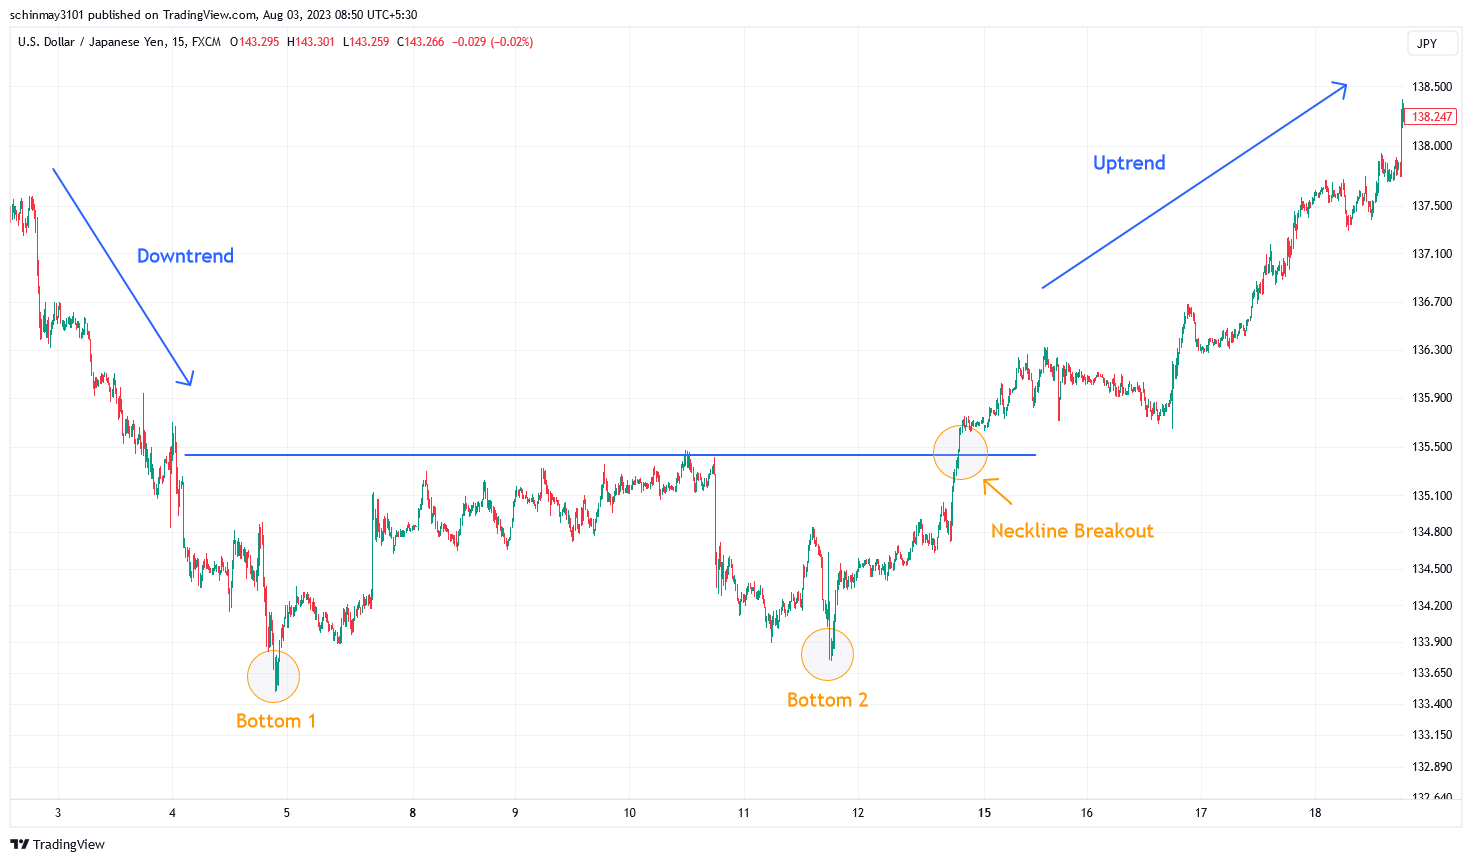
Double tops and double bottoms are common chart patterns used in technical analysis to identify potential trend reversals. They occur when the price of the underlying moves in a pattern that is similar to the letter "W" (double bottom) or "M" (double top). These patterns usually tend to move over a more extended period of time. A double-top pattern signals a possible bearish trend reversal while a double bottom pattern signals a potential bullish reversal.
Example (Entry and Exit Points)
In a double top pattern, after a visible uptrend, the price will first form an initial peak and retrace back to a level of support (neckline). Then, it will again attempt to form a peak before reversing back from the same level to form an ‘M-shaped’ pattern. If during the second retracement, the price breaks below the neckline, the double top pattern is confirmed and a short trade may be entered. The potential target would be the price level as far away from the neckline on the downside as the peak of the double-tops is on the upside.
Similarly, in a double bottom pattern, once the downtrend has completed, the price will form a bottom and then retrace back to its level of resistance (neckline). It will then form a bottom again before reversing back from the prevailing trend. If during the second retracement, the price breaks above the neckline, the double top pattern is confirmed and a short trade may be entered. The potential target would be the price level as far away from the neckline on the upside as the bottom of the double-bottoms is on the downside.
Bull and Bear Flags
Bull Flag Illustration
Bear Flag Illustration
Features
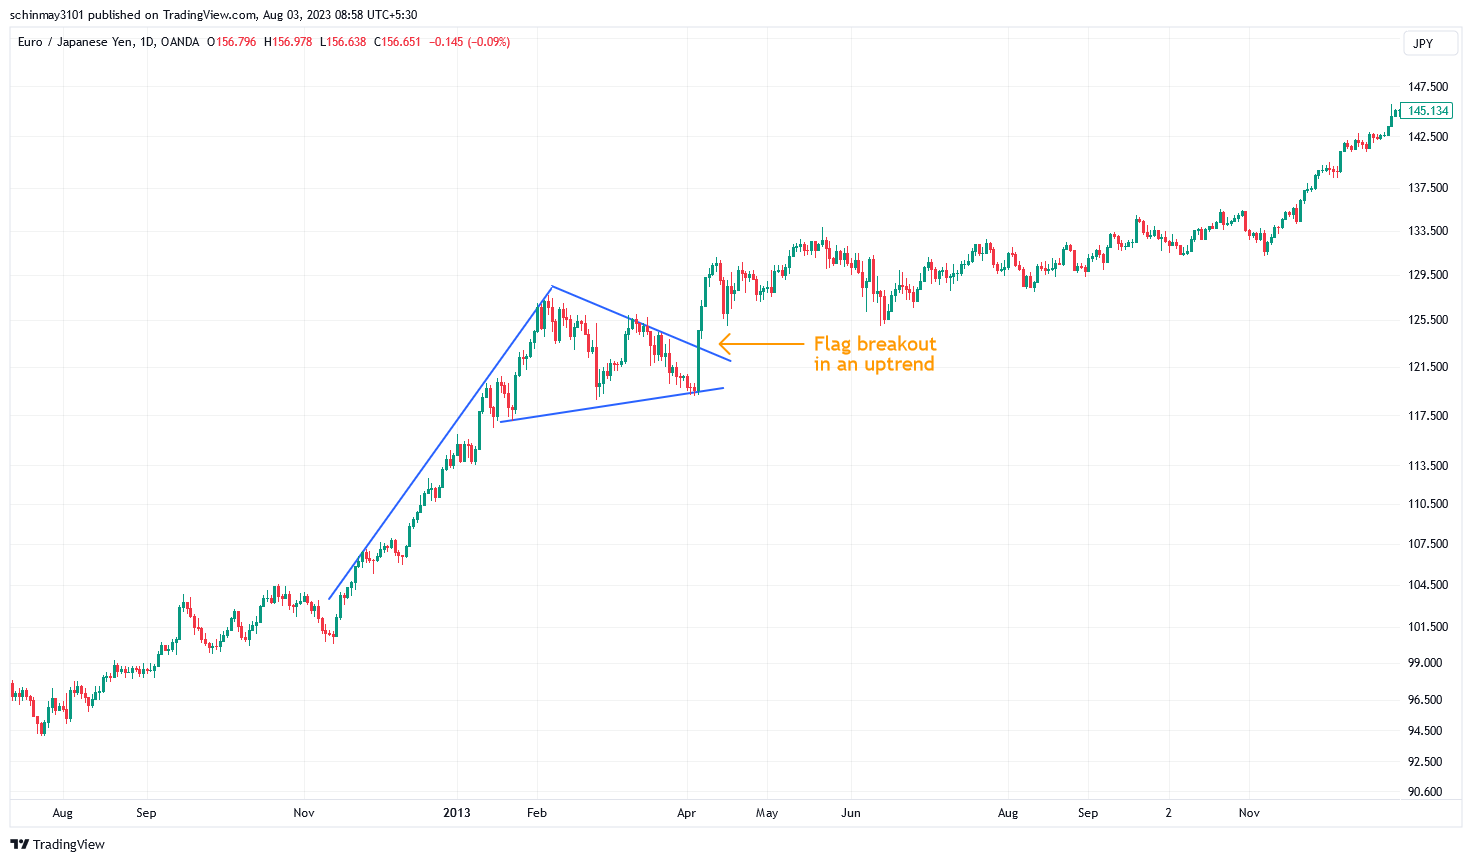
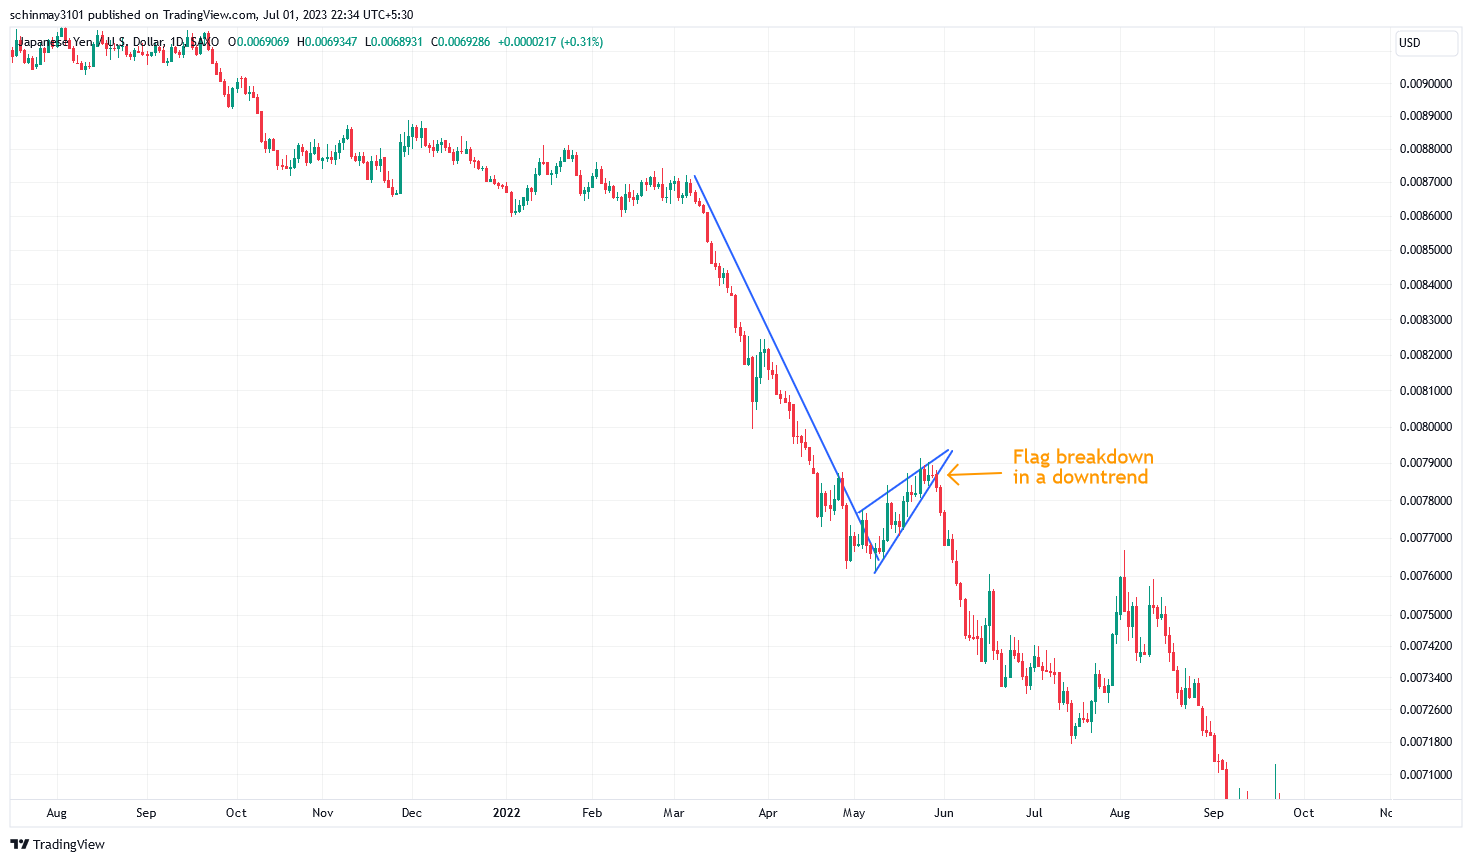
Flag patterns are widely used by traders as signals of trend continuation. These patterns can either be bullish or bearish, depending on the trend preceding their formation. The bull flag pattern indicates a temporary pause in an uptrend, during which buyers gather strength to fuel another upward move. On the other hand, the bear flag pattern suggests a brief halt in a downtrend, allowing sellers to regain momentum for another downward push.
Example (Entry and Exit Points)
In case of a bull flag, traders may enter a long position when the price breaks out above the upper trendline. Conversely, for a bear flag, they may enter a short position when the price breaks out below the lower trendline. Implementing a stop-loss order just outside the flag pattern is a common risk management strategy. A potential exit point can be the price level that is as far away from the breakout point as the distance from the top and bottom of the shorter leg of the flag.
Engulfing Pattern
Bullish Engulfing Illustration
Bearish Engulfing Illustration
Features
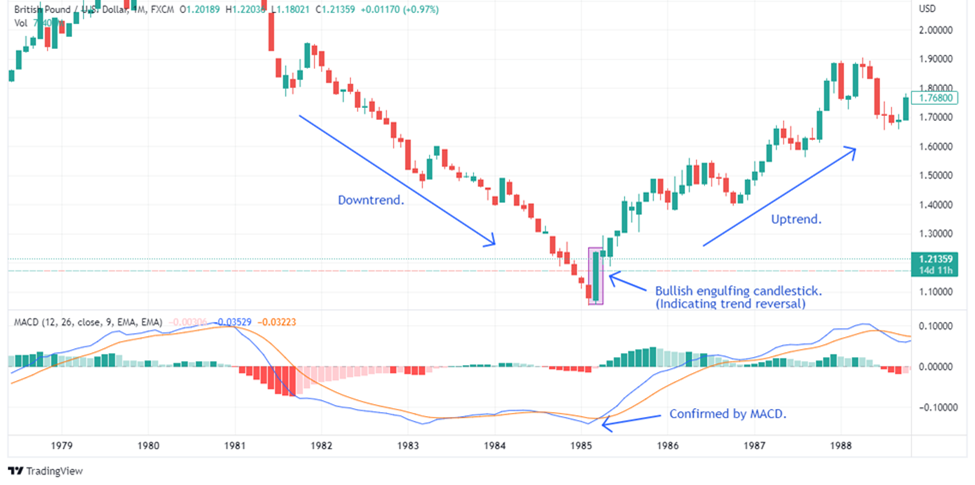
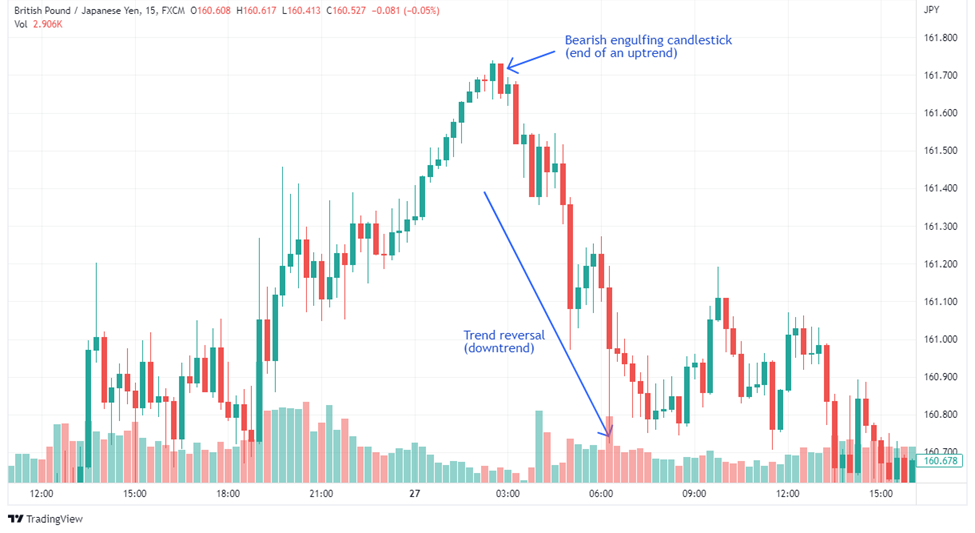
The Engulfing pattern is a highly regarded reversal candlestick pattern in technical analysis. It occurs when an opposing larger candle fully engulfs the body of the preceding candle, indicating a significant shift in market sentiment and trend direction. A perfect engulfing candlestick ensures that the first candle's body does not extend beyond the shadow or wick of the second candle, with the high and low of the second candle entirely enclosing the first. Traders often correlate the strength of the pattern with the size of the candle.
There are two variations for engulfing patterns:
1. Bullish Engulfing Pattern: When observed at the end of a downtrend, this pattern suggests a potential reversal to a bullish trend. It comprises of two candles, a smaller bearish candle followed by a larger bullish candle that entirely engulfs the body of the prior bearish candle.
2. Bearish Engulfing Pattern: When observed at the end of an uptrend, this pattern suggests a potential reversal to a bearish trend. It consists of two candles, a smaller bullish candle followed by a larger bearish candle that entirely engulfs the body of the preceding bullish candle.
Example (Entry and Exit Points)
For a bullish engulfing pattern, traders may enter a long position once the larger engulfing candle closes above the smaller bearish candle's high. Likewise, for a bearish engulfing candlestick pattern, they may enter a short position after the larger engulfing candle closes below the smaller bullish candle's low. To manage risk, a stop-loss order can be placed below the low of the bullish engulfing candle or above the high of the bearish engulfing candle.
Cup and Handle Pattern
Cup and Handle Illustration
Features
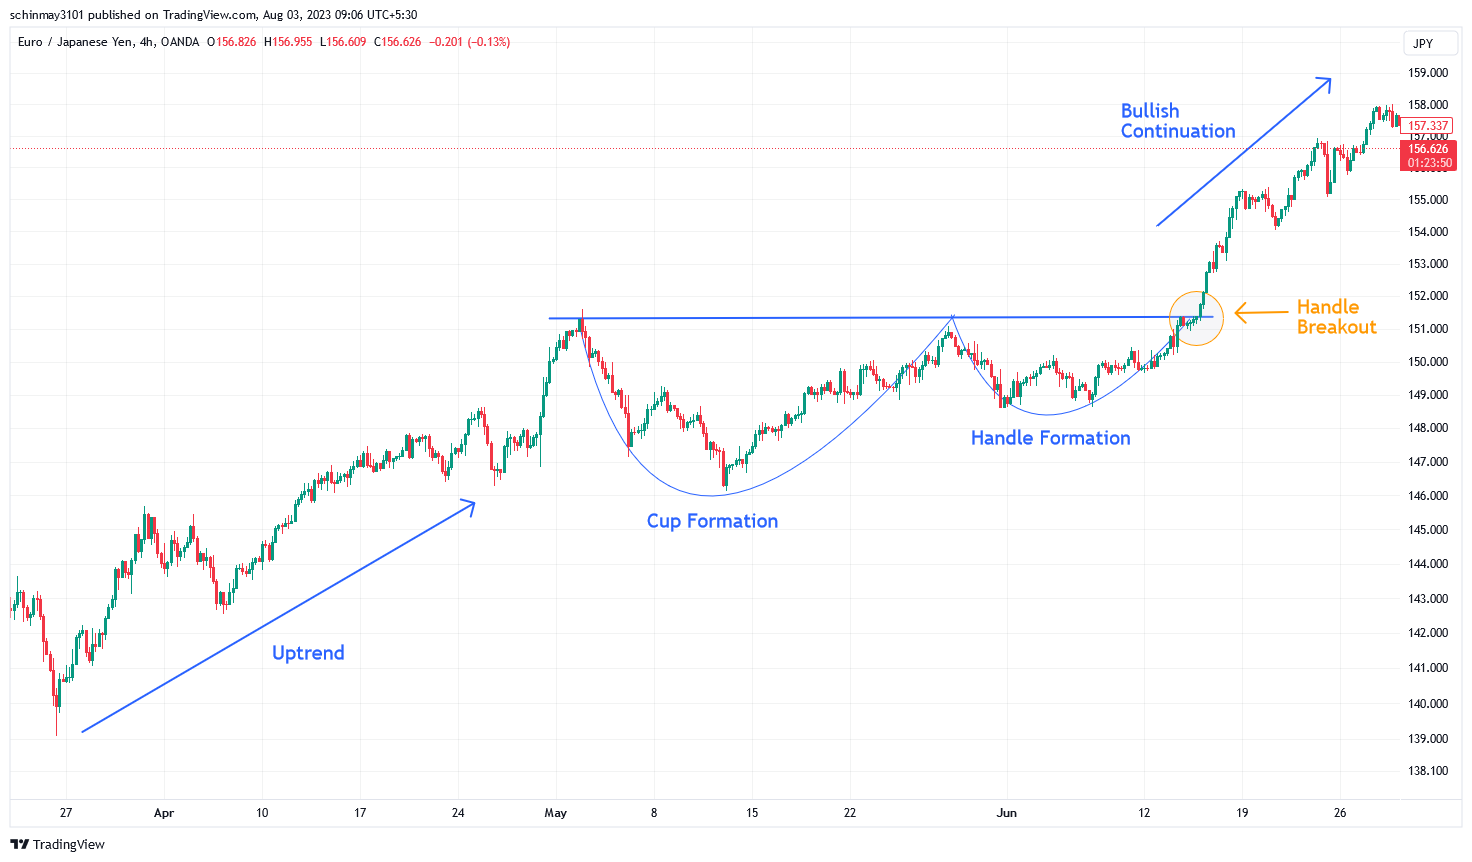
A cup and handle pattern is often considered a sign of bullish continuation. It is typically formed after a decent uptrend and indicates that the price is likely to continue its upward momentum after a little consolidation. The first part of the pattern is the cup formation, which looks like a "U" shape on the chart. This is created by a gradual decline in price, followed by a rounded bottom and then a gradual rise back to the initial peak. After the cup formation, there is a temporary price retracement, which forms the handle of the pattern. During the formation of the cup, the trading volume tends to be higher. However, as the handle is being formed, the volume usually decreases, indicating only a temporary decrease in market activity.
Example (Entry and Exit Points)
For a bullish engulfing pattern, traders may enter a long position once the larger engulfing candle closes above the smaller bearish candle's high. Similarly, for a bearish engulfing pattern, they may enter a short position after the larger engulfing candle closes below the smaller bullish candle's low. To manage risk, a stop-loss order can be placed below the low of the bullish engulfing candle or above the high of the bearish engulfing candle.
Pennants Pattern
Bullish Pennant Illustration
Bearish Pennant Illustration
Features
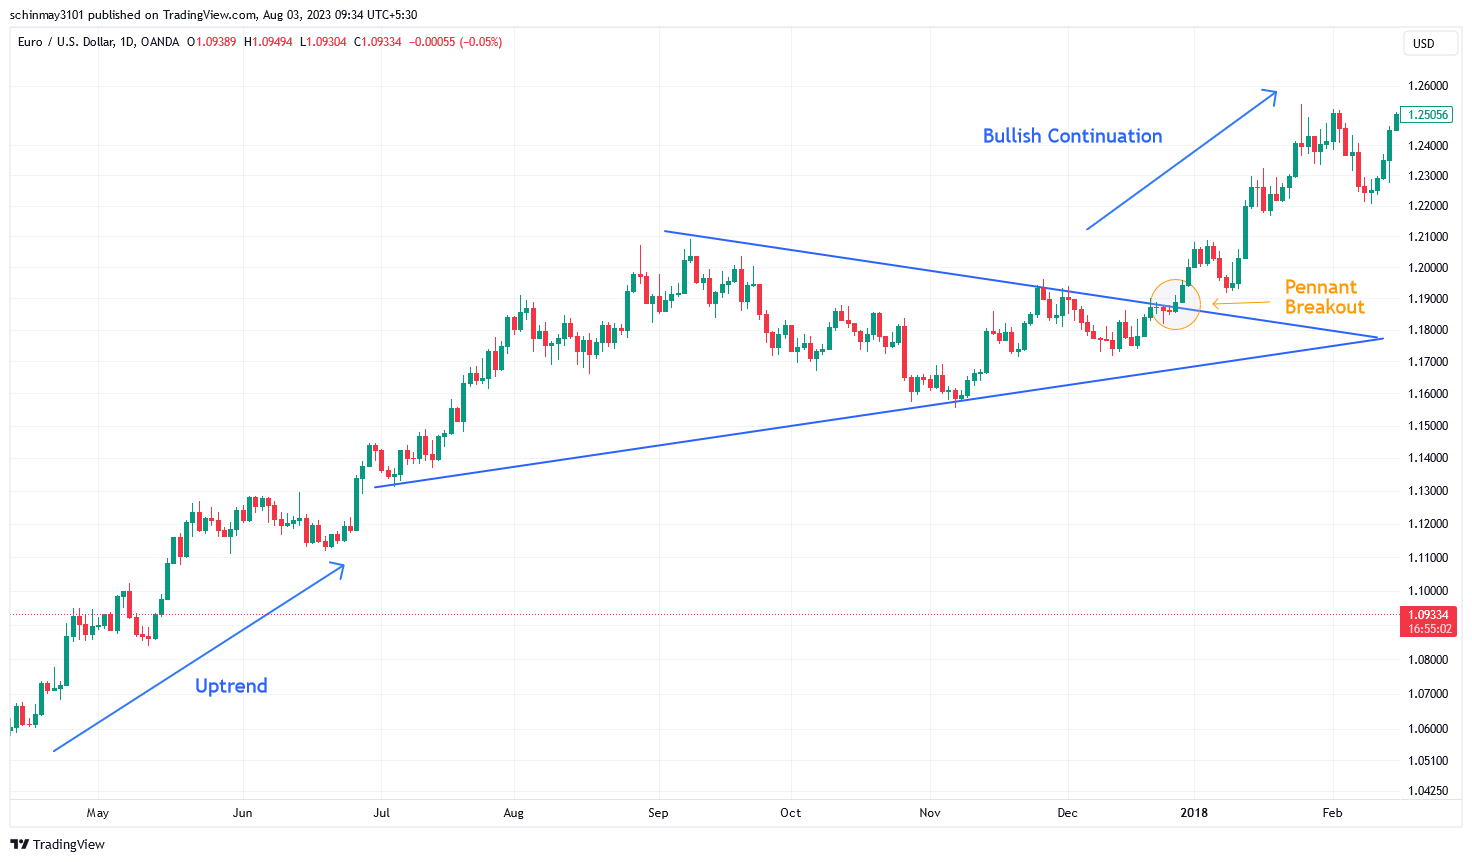
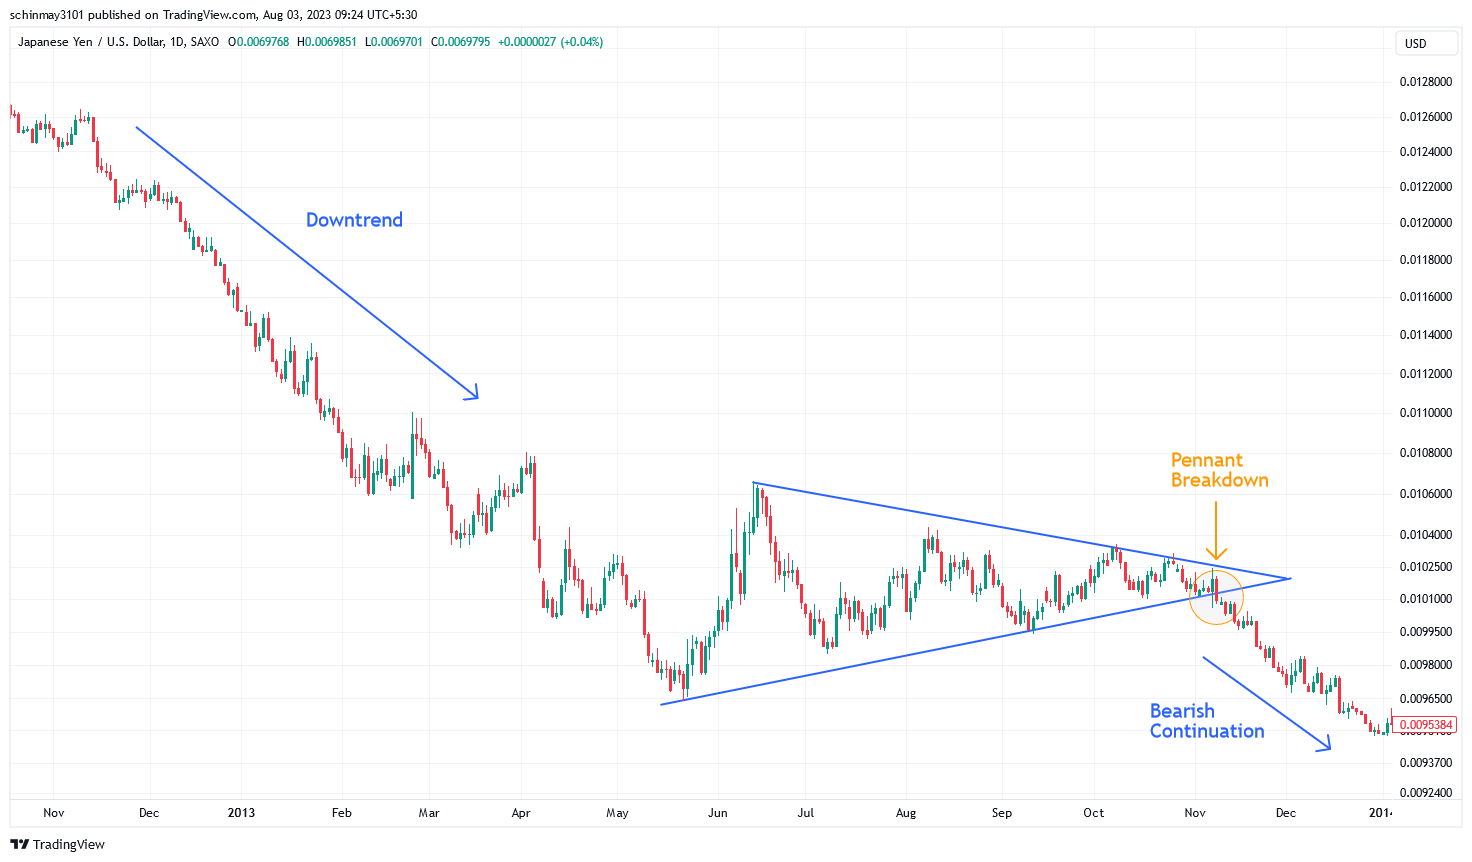
Pennants are continuation patterns that occur after a large movement in stock prices, known as the flagpole, followed by a period of consolidation. This consolidation phase is characterized by two converging trend lines. The Pennant pattern is considered a symmetrical triangle, meaning that both the upper and lower trendlines have similar slopes and meet at a common point. During the consolidation phase, the trading volume tends to decrease as the market experiences a temporary equilibrium between buyers and sellers.
Example (Entry and Exit Points)
Traders often wait for the price to break out of the Pennant pattern before entering a trade. A bullish breakout suggests a continuation of the uptrend, while a bearish breakout suggests a continuation of the downtrend. Once the breakout is confirmed, traders may enter a long or short position, depending on the direction of the breakout. They often place a stop-loss order just outside the Pennant pattern to manage risk. Profit target can be set at a predetermined percentage level.
Broadening Top Pattern
Broadening Top Pattern
Features
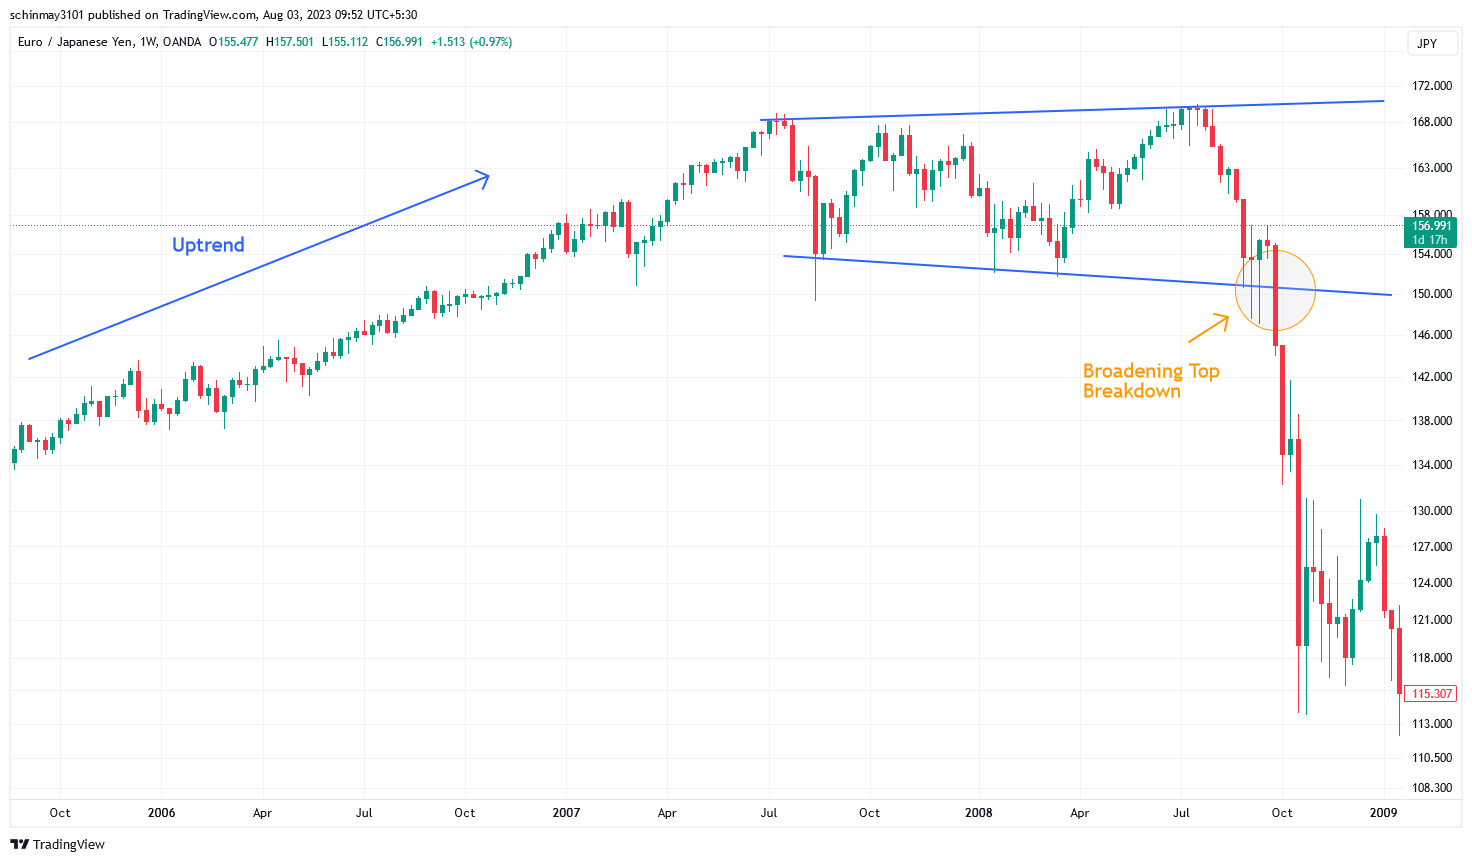
The Broadening Top pattern, also known as the Broadening Formation or Megaphone Pattern, is characterized by the widening price range between higher highs and lower lows. This pattern signals an increase in volatility and indecision in the market related to the trend, often leading to potential trend reversals. The key characteristic of this pattern is the divergence of two trend lines, connecting wider highs and lows. One trendline ascends, representing the upper boundary, while the other may descend or remain horizontal, forming the lower boundary.
Example (Entry and Exit Points)
Traders usually look for a confirmed breakout from the Broadening Top pattern before entering a trade. A bearish breakout signals a potential trend reversal to the downside, while a bullish breakout (price moving above the upper trendline) suggests a potential trend reversal to the upside. Profit target can be set at a predetermined percentage level.
Hammer Candlestick
Bullish Hammer Illustration
Bearish Hammer Illustration
Features
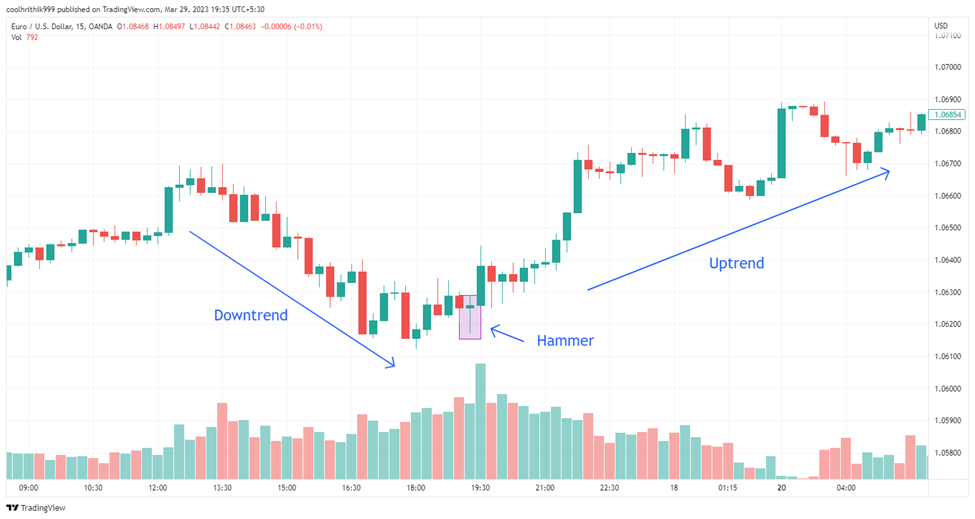
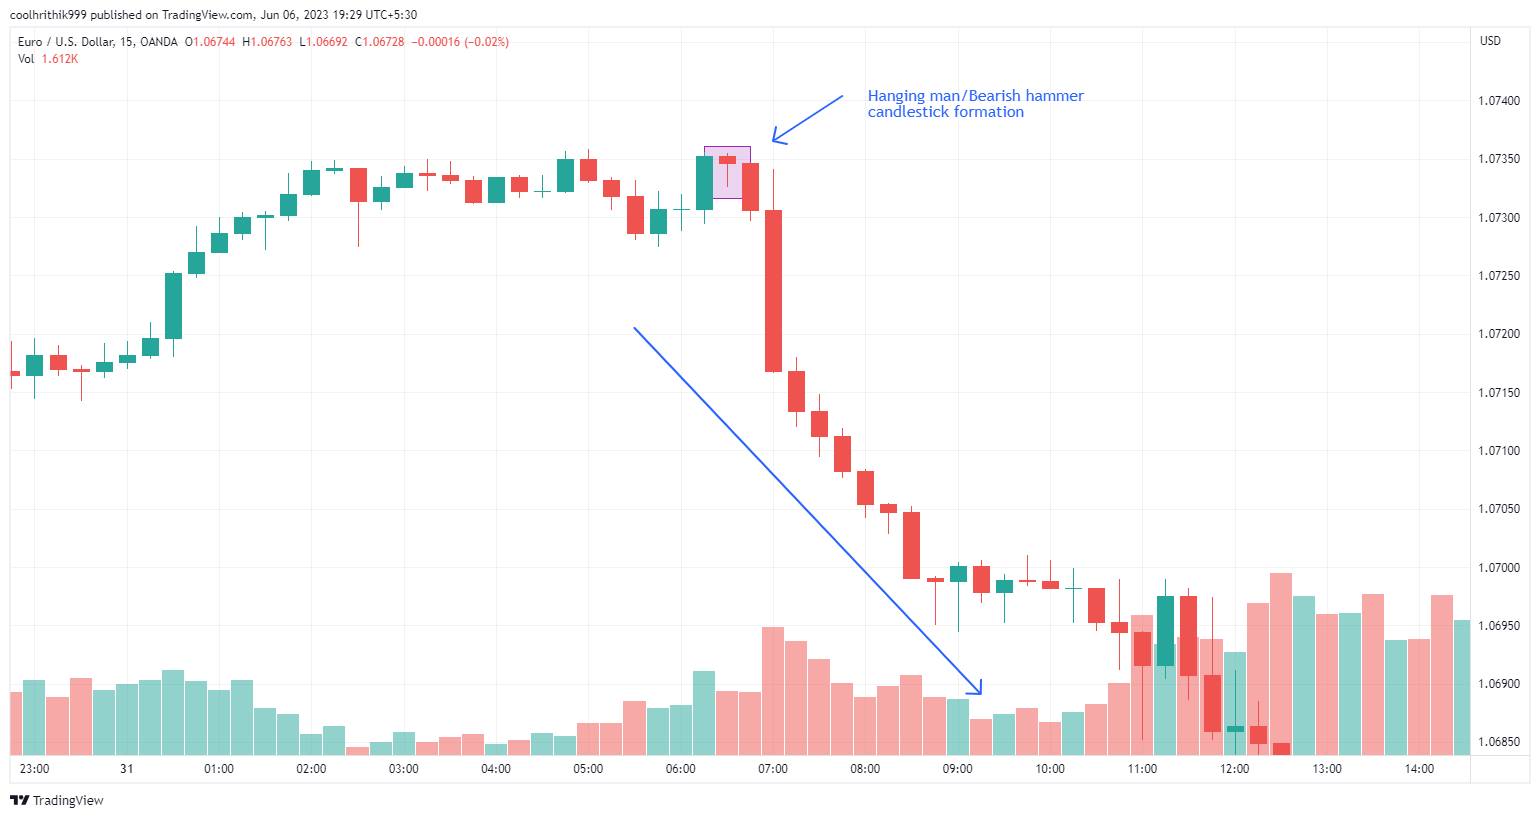
A hammer candlestick pattern is a reversal candlestick pattern that forms towards the end of an ongoing trend. A hammer candlestick has a long lower shadow, a small body at the top of the candle, and no or a tiny upper shadow resembling a hammer or an inverted hammer. Technically, the length of its shadow should be at least twice the size of its body. The pattern signifies a potential trend reversal, indicating that the selling pressure is getting exhausted, and buyers are stepping in to push the price higher and, they succeed somehow closing the price near the top of the candle.
Example (Entry and Exit Points)
While the hammer pattern itself is a bullish signal, traders often wait for confirmation before entering a long position. Confirmation may come in the form of a higher closing price on the next candle or a break above a significant resistance level. Once the confirmation is received, traders may enter a long trade, placing a stop-loss order below the low of the hammer candle to manage risk. The price target for the trade can be estimated by measuring the distance from the low of the hammer to the nearest resistance level and projecting it upwards from the hammer's closing price.
Rounding Bottom Pattern
Rounding Bottom Illustration
Features
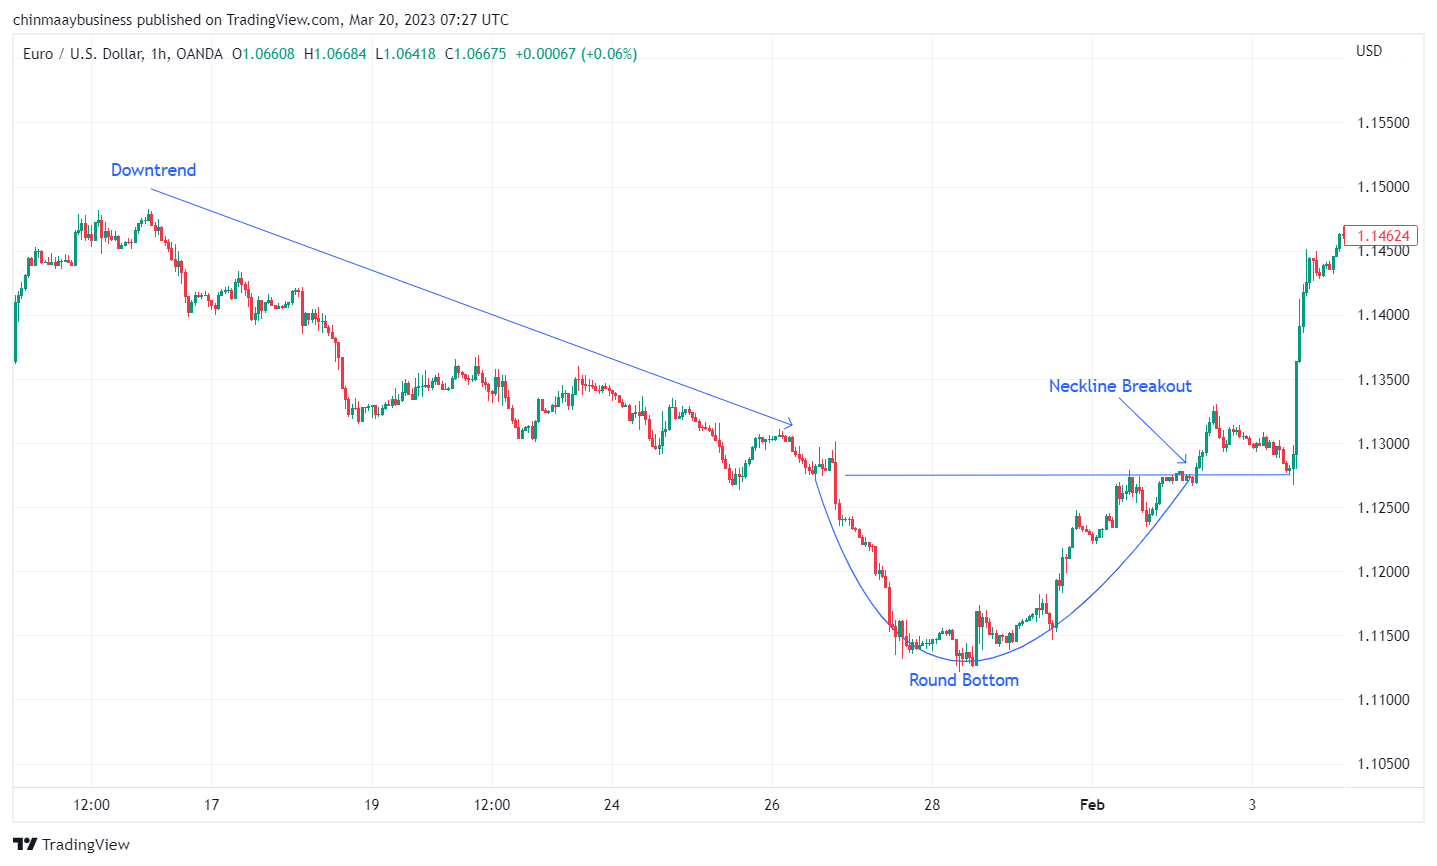
The Rounding Bottom, also known as the Saucer Bottom, is a bullish reversal chart pattern. It typically forms over an extended period and suggests a gradual shift in market sentiment from bearish to bullish. The Rounding Bottom pattern begins with a prolonged downtrend, during which the price experiences a series of lower lows and lower highs. As the downtrend approaches exhaustion, the price begins to round off and starts forming higher lows and higher highs. Towards the end, the pattern takes its "U" shape as the price rounds off, creating a smooth and symmetrical curve.
Example (Entry and Exit Points)
Traders typically wait for a confirmed breakout above the pattern's resistance level (neckline) before taking a long position. The breakout signals the potential start of an uptrend and validates the rounding bottom pattern. Some traders may also use other technical indicators or oscillators to confirm the breakout signal. Stop-loss can be placed just below the pattern's lowest point while target can be set by measuring the distance from the lowest point of the pattern to the neckline and projecting it upwards from the neckline.
Types of chart patterns
Reversal Patterns
These chart patterns indicate a potential trend reversal in the price movement. Examples include Head and Shoulders, Double Tops, and Double Bottoms.
Continuation Patterns
These patterns indicate that the prevailing trend is likely to continue after a brief consolidation. Examples include Flags, Pennants, and Triangles.
Bilateral Patterns
Also known as symmetrical patterns, these chart formations do not provide a clear indication of the trend's continuation or reversal. They can only be traded after the price breaks out on either side. Examples include Triangles and Rectangles.
How can beginners use chart patterns in their trading strategies?
According to experts, beginners can effectively use chart patterns in their trading strategies by following these steps:
Understanding chart patterns
Learn about different chart patterns, their features, and their implications on price movements. Get used to with most common patterns like Head and Shoulders, Triangles, and Double Tops/Bottoms.
Always wait for the confirmation
Do not depend solely on charts. Confirm signals using technical indicators and fundamental analysis. Consider the broader market context, news events, sentiments, and overall trends.
Entry and exit strategies
Determine entry and exit points prior to entering a trade, based on the pattern's breakout or reversal signals.
Risk management and practice
Use stop-loss orders to manage risks and take-profit targets to secure profits. Size your positions appropriately and avoiding over-leveraging. Practice trading in a demo account to gain experience without real money at stake.
Continual learning and adaptation
Markets are dynamic, so keep learning and stay updated on new patterns and market developments. Adapt your strategies based on changing conditions.
Remember, chart patterns are not foolproof and require patience and discipline. Beginners should start with small positions, gradually gain confidence, and refine their strategies as they gain more experience in trading.
Chart Pattern Limitations
Chart patterns serve as valuable tools in technical analysis, but novice traders should be mindful of their drawbacks to avoid potential pitfalls. Some limitations to consider include:
False Signals
Chart patterns can sometimes generate false signals, leading to erroneous trading decisions and solely relying on them may lead to losses.
Subjectivity
The interpretation of chart patterns can be subjective, and different traders might perceive different patterns on the same chart. This subjectivity leads to diverse strategies and outcomes.
Timeframes
Chart patterns may be effective on certain timeframes but ineffective on others. A pattern that appears significant on a shorter timeframe might not hold the same significance on a longer one.
Overlapping Patterns
Several chart patterns may occur simultaneously, making it challenging to identify the dominant pattern. This complexity can cause confusion and inaccuracies in analysis.
Market Conditions
Chart patterns may perform differently in various market conditions. While they might work well in trending markets, they could produce unreliable signals during periods of low volatility.
Summary
Chart analysis and patterns are vital in trading as they help identify trends, entry and exit points, and potential reversals. Common patterns include Head and Shoulders, Rising and Falling Wedges, Double Tops and Bottoms, and many more. Beginners should learn and recognize these patterns, confirm signals with indicators and analysis, implement risk management, and continually learn and adapt.
However, chart patterns also have limitations, including false signals, subjectivity, timeframe dependence, overlapping patterns, and sensitivity to market conditions. To overcome these challenges, traders should use multiple indicators and fundamental analysis in conjunction with chart patterns.
Experience and practice are crucial in effectively applying chart patterns, and traders must maintain a rational approach and discipline to navigate market uncertainties successfully.
FAQs
What is the most common chart pattern?
According to experts, triangle patterns, including the ascending, descending, and symmetrical triangle pattern, are among the most common chart patterns used by traders.
What are the different types of patterns chart?
There are three main types of chart patterns, i.e. continuation patterns, reversal patterns, and bilateral patterns.
How many chart patterns are there?
According to experts, there are 42 standard, and way more modified chart patterns used by traders.
Which chart patterns are most reliable?
According to experts, triangle patterns, including the ascending, descending, and symmetrical triangle pattern, are among the most reliable chart patterns used by traders.
Glossary for novice traders
-
1
Day trading
Day trading involves buying and selling financial assets within the same trading day, with the goal of profiting from short-term price fluctuations, and positions are typically not held overnight.
-
2
Take-Profit
Take-Profit order is a type of trading order that instructs a broker to close a position once the market reaches a specified profit level.
-
3
Long position
A long position in Forex, represents a positive outlook on the future value of a currency pair. When a trader assumes a long position, they are essentially placing a bet that the base currency in the pair will appreciate in value compared to the quote currency.
-
4
Forex Risk Management
Risk management in Forex involves strategies and techniques used by traders to minimize potential losses while trading currencies, such as setting stop-loss orders and position sizing, to protect their capital from adverse market movements.
-
5
Volatility
Volatility refers to the degree of variation or fluctuation in the price or value of a financial asset, such as stocks, bonds, or cryptocurrencies, over a period of time. Higher volatility indicates that an asset's price is experiencing more significant and rapid price swings, while lower volatility suggests relatively stable and gradual price movements.
Related Articles


Team that worked on the article

Chinmay Soni is a financial analyst with more than 5 years of experience in working with stocks, Forex, derivatives, and other assets. As a founder of a boutique research firm and an active researcher, he covers various industries and fields, providing insights backed by statistical data. He is also an educator in the field of finance and technology.
As an author for Traders Union, he contributes his deep analytical insights on various topics, taking into account various aspects.

Dr. BJ Johnson is a PhD in English Language and an editor with over 15 years of experience. He earned his degree in English Language in the U.S and the UK. In 2020, Dr. Johnson joined the Traders Union team. Since then, he has created over 100 exclusive articles and edited over 300 articles of other authors.

Mirjan Hipolito is a journalist and news editor at Traders Union. She is an expert crypto writer with five years of experience in the financial markets. Her specialties are daily market news, price predictions, and Initial Coin Offerings (ICO).
