Best Stock Market Chart Patterns Every Trader Must Know
7 Best stock chart patterns are:
- 1
Head and shoulders pattern
- 2
Double top and double bottom patterns
- 3
Engulfing candle patterns
- 4
Ascending and descending triangle patterns
- 5
Flag patterns
- 6
Cup and handle patterns
- 7
Wedge patterns
Chart patterns help analyze price movements in stock trading. These patterns tend to repeat due to the consistent behavior of traders influenced by their emotions and market events. Recognizing these patterns early can give traders a competitive edge in the markets. So, developing an understanding of the top chart patterns becomes essential for traders. They can use these patterns to make informed decisions, manage risk, and improve their overall trading strategies. When combined with other technical analysis tools, chart patterns provide a comprehensive approach to navigating the stock market with confidence. To bolster this idea, the experts at TU will in this article guide you on how to read the 7 best stock chart patterns and discuss some related strategies.
Start trading stocks now with RoboForex!Top 7 stock patterns and how to read them
1Head and shoulders pattern
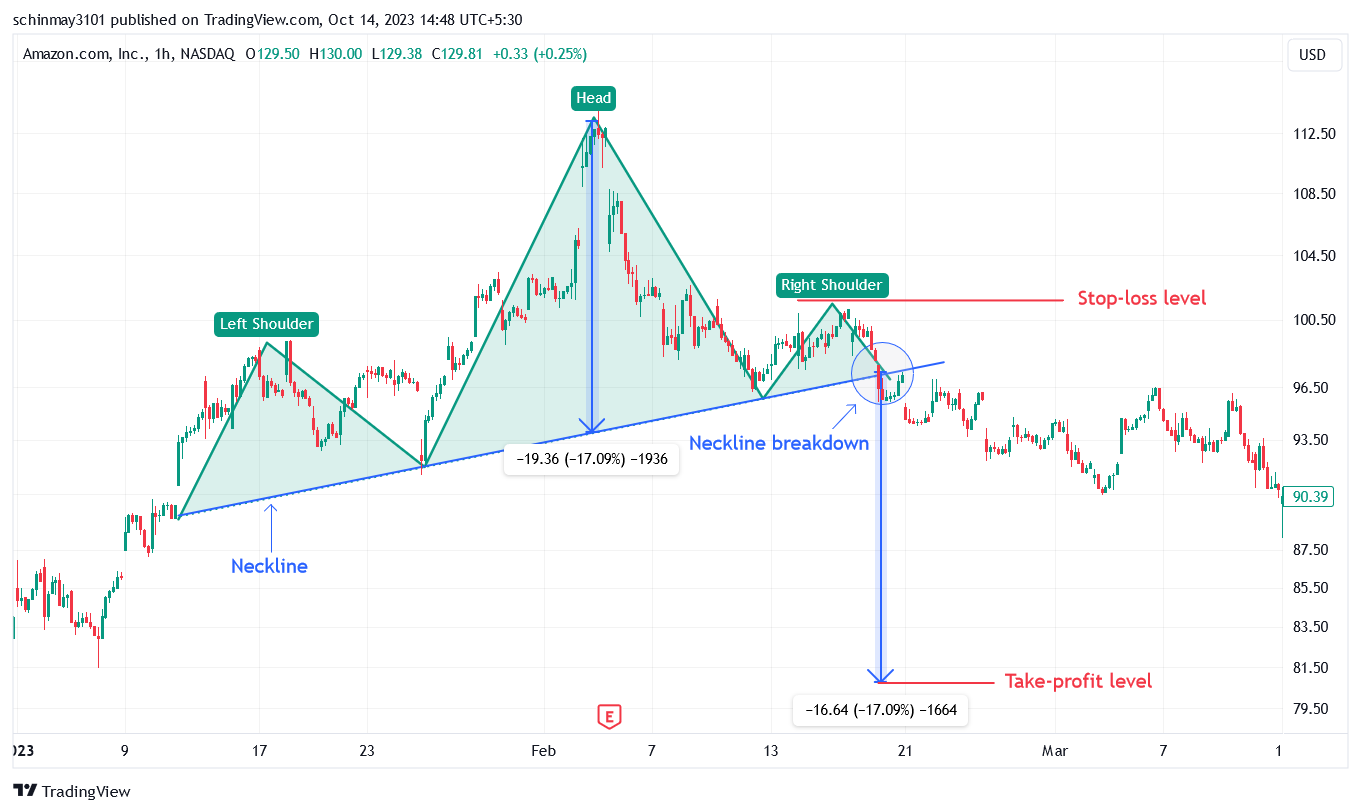
The head and shoulders pattern is a commonly recognized chart pattern that indicates a possible change in a stock's trend. It consists of three peaks – the first peak (the left shoulder) is lower than the highest peak (the head), and the third peak (the right shoulder) is similar in height to the left shoulder. This pattern typically suggests a shift from an upward trend to a downward one, or vice versa.
Identifying a Head and Shoulders Pattern
To spot a head and shoulders pattern, look for these key elements:
Left shoulder - the initial peak, which is lower than the head
Head - the highest point in the pattern, indicating a trend is running out of steam
Right shoulder - the peak following the head, which is about the same height as the left shoulder
Neckline - this is a line connecting the lowest points between the peaks
How to read the head and shoulders pattern?
Trading a head and shoulders pattern can be done keeping the following key factors in mind:
Confirmation. Wait until the pattern fully develops and the price breaks either above or below the neckline, depending on whether it's a bearish or bullish pattern
Entry and Stop-Loss. Once the breakout occurs, enter the trade and set a stop-loss just above the right shoulder for a bearish pattern or just below it for a bullish pattern
Target. Measure the distance from the head to the neckline and use it to determine your target price
Risk management. Ensure that you manage your risk properly by not risking more than a predetermined percentage of your trading capital
2Double top and double bottom patterns
Double top and double bottom patterns are recognizable chart patterns that provide traders with valuable insights into potential trend reversals. These patterns occur after a significant price move, signaling a change in market sentiment.
Identifying double top and double bottom patterns
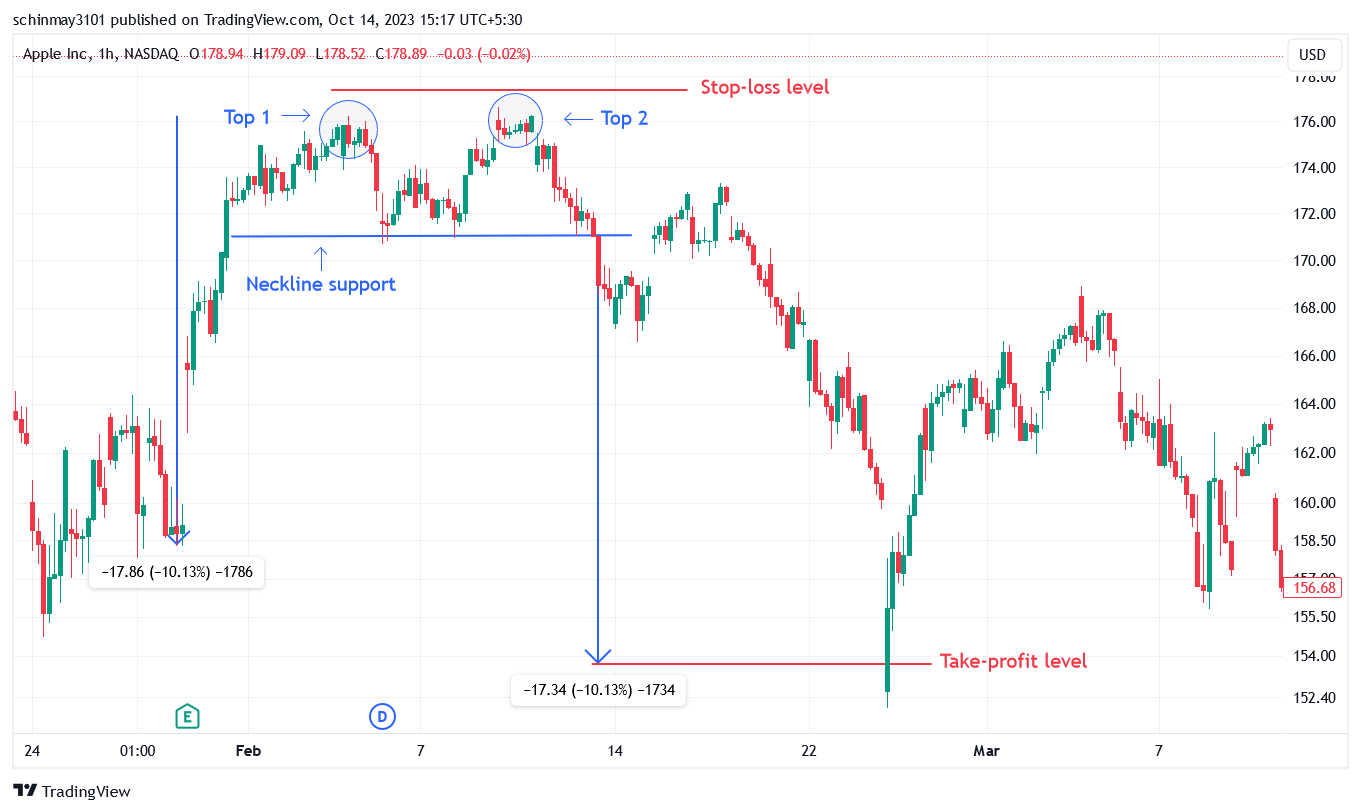
Double Top Pattern. This pattern forms after a sustained uptrend. It consists of two peaks (tops) at roughly the same price level, separated by a trough. The price typically struggles to surpass this level, indicating resistance. It suggests a shift from a bullish trend to a potentially bearish one
Double Bottom Pattern. Conversely, the double bottom pattern occurs after a downtrend. It comprises two troughs at approximately the same price level, separated by a peak. The price often faces difficulty breaking below this level, signifying support. This pattern hints at a shift from a bearish trend to a possible bullish one
How to read double top and double bottom patterns?
Trading a double top or double bottom pattern can be done keeping the following key factors in mind:
Confirmation. Wait for the pattern to fully develop and confirm by breaking below the support (in the case of a double top) or above the resistance (for a double bottom)
Entry and Stop-Loss. Once the confirmation occurs, enter the trade in the direction of the anticipated trend change. Place a stop-loss order just beyond the pattern's peak or trough, ensuring a buffer for market fluctuations
Target. Measure the distance from the peak (for double top) or trough (for double bottom) to the previous swing’s low/high. Use this measurement to set your target price
Risk management. Implement proper risk management by controlling your position size and not risking more than a predetermined portion of your trading capital
3Engulfing candle patterns
Engulfing patterns provide insight into potential trend reversals. These patterns occur when one candle fully engulfs the previous candle, indicating a shift in market sentiment.
Identifying engulfing patterns
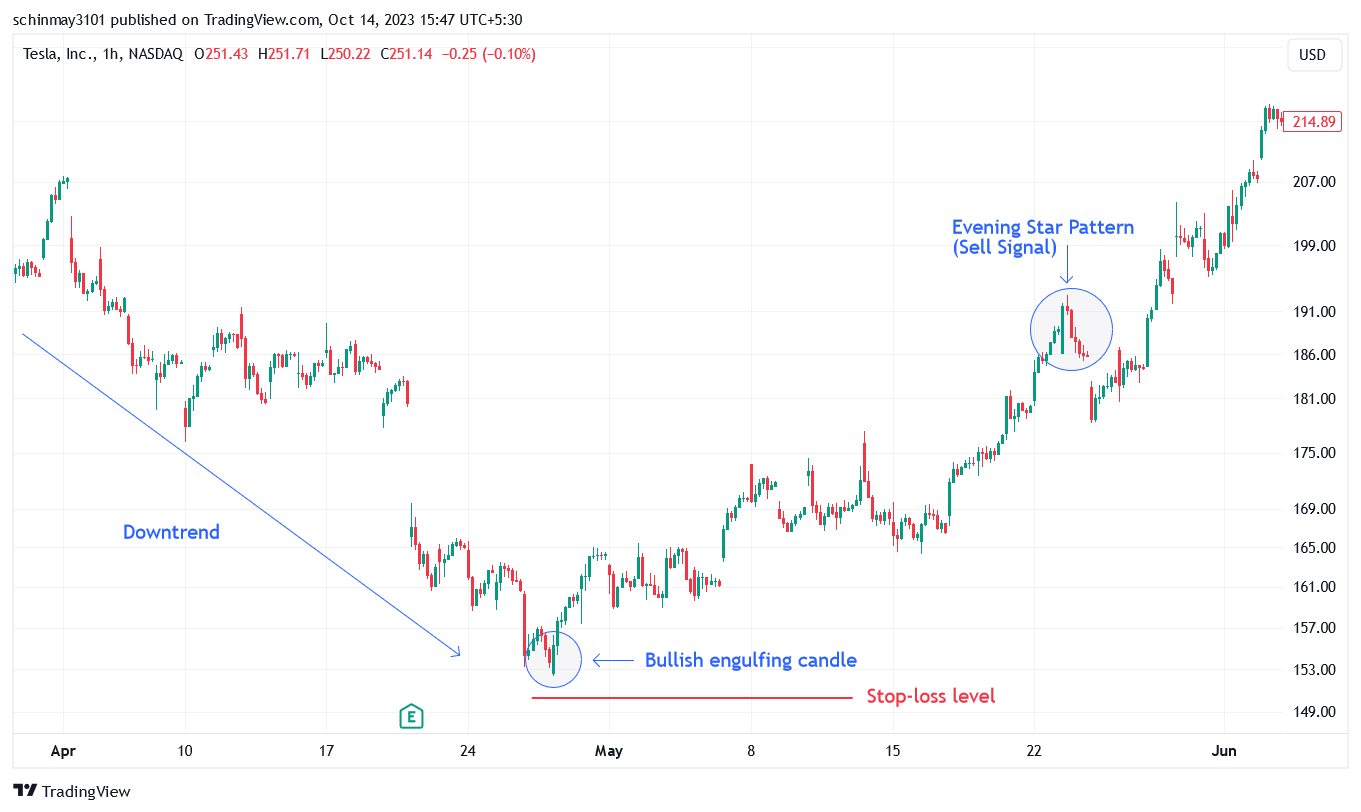
Bullish engulfing pattern. This pattern forms after a downtrend. The second candlestick (bullish) completely engulfs the previous bearish one. It suggests a change from a bearish trend to a bullish one, assuming that buyers have gained control
Bearish engulfing pattern. Conversely, the bearish engulfing pattern occurs following an uptrend. The second candlestick (bearish) fully engulfs the preceding bullish one. It hints at a shift from a bullish trend to a bearish one, with the assumption of sellers regaining control
How to read the engulfing candle patterns?
Trading the engulfing candle pattern can be done keeping the following key factors in mind:
Confirmation. Wait for the engulfing pattern to fully form. It's essential to observe the second candle fully engulfing the first one at close
Entry and Stop-Loss. Enter a trade in the direction indicated by the engulfing pattern (long for bullish, short for bearish) after confirmation. Place a stop-loss order just beyond the engulfed candle's high (for bullish) or low (for bearish)
Target. Determine your target price based on the expected price movement following the engulfing pattern. You can use technical analysis tools to estimate potential price targets. In the presented illustration, experts have used the evening star pattern to determine the exit levels
Risk management. Implement proper risk management by controlling your position size and not risking more than a predetermined portion of your trading capital
4Ascending and descending triangles
Triangles are continuation patterns used by traders for varied trading strategies. These patterns occur when a trending price momentum consolidates in the same direction before continuing the momentum.
Identifying ascending and descending triangle patterns
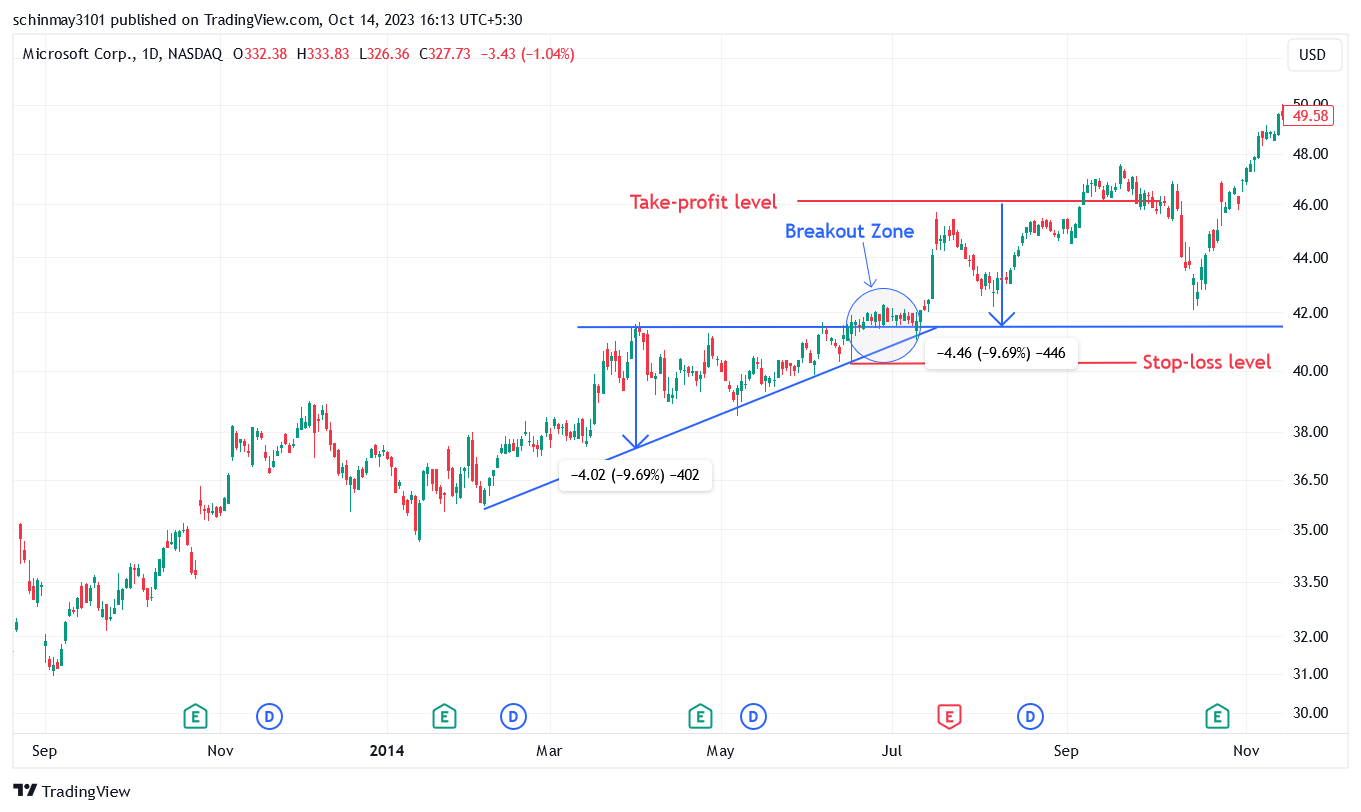
Ascending triangle pattern. To spot an ascending triangle, look for a flat line that connects two or more price peaks. Just below this flat line, there should be another line connecting a series of price lows, and these lows should be progressively rising. This pattern visually resembles a squeeze where the price is getting closer to a breakout. An ascending triangle indicates that buyers are gradually gaining control, potentially leading to an upward breakout in prices
Descending triangle pattern. To spot a descending triangle, search for a flat line that connects two or more price lows. Just above this line, there should be another line connecting a series of price highs, and these highs should be progressively lower. This pattern suggests that sellers are slowly taking over, hinting at a potential downward breakdown in prices
How to read the ascending and descending triangle patterns?
Trading the triangle patterns can be done keeping the following key factors in mind:
Confirmation. It's essential to wait until the price reaches the point where the two lines of the triangle meet, indicating a possible breakout
Entry and Stop-Loss. After the price moves above the upper line in an ascending triangle or below the lower line in a descending triangle, an entry can be made. To protect your position, set a stop-loss order just above or below the point of the breakout
Target. To estimate your target price, measure the height of the triangle (from the highest to the lowest point) and add it to/subtract it from the point where the breakout occurred
Risk management. It's important to practice sound risk management. Ensure that you don't risk an excessive portion of your trading capital
5Flag pattern
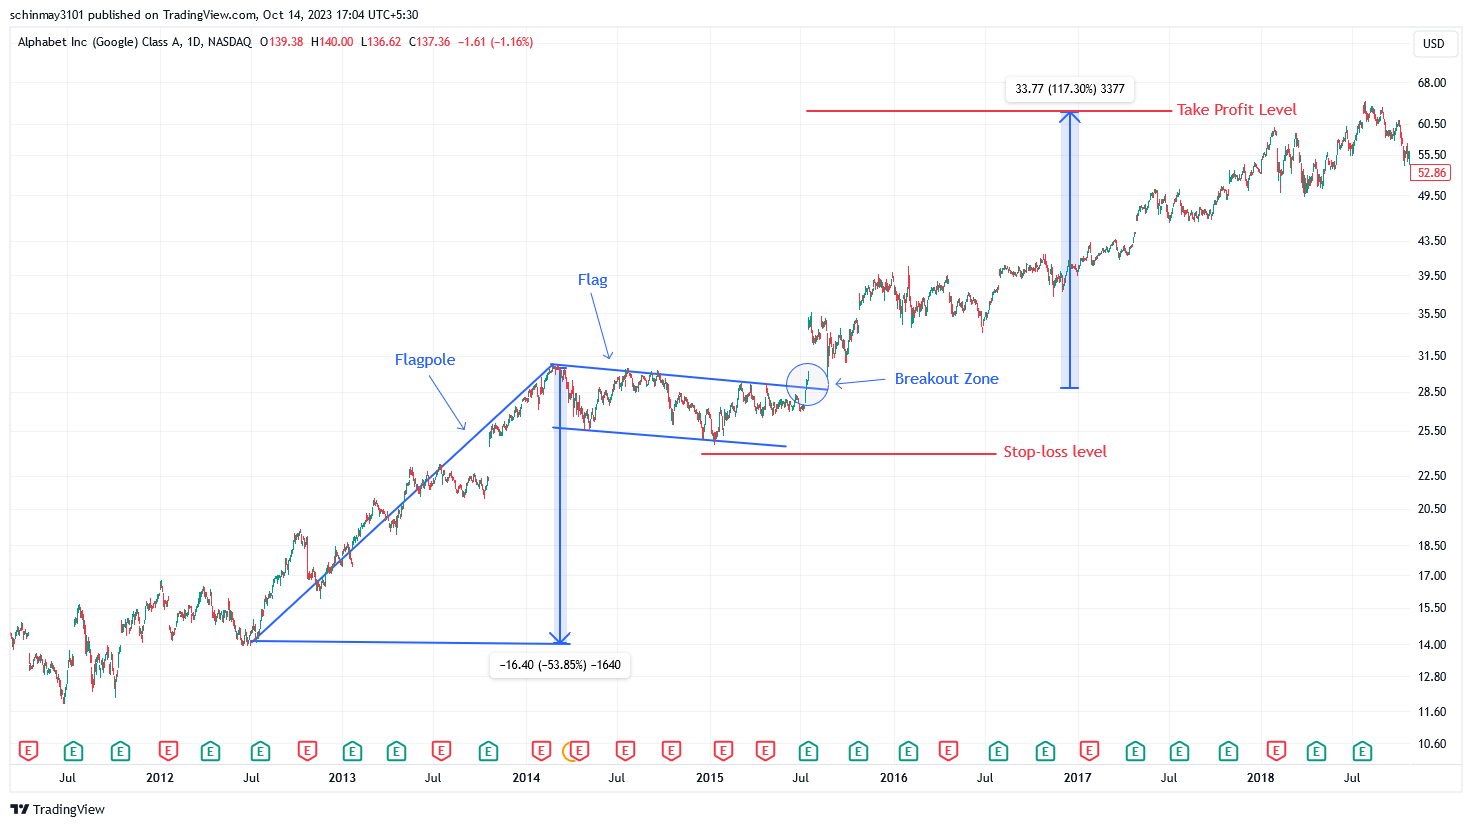
The flag pattern is another continuation pattern which indicates that after a strong price trend, the market takes a short breather before potentially resuming the prior trend.
Identifying the flag pattern
The flag pattern comprises of two main parts:
The flagpole. This is the initial strong price movement, either upwards (bullish) or downwards (bearish). It represents the trend before the consolidation phase
The flag. The flag is a rectangular-shaped pattern that forms after the flagpole. It typically slants in the opposite direction of the flagpole and can be seen as a brief pause or consolidation in price movement
How to read the flag pattern?
Trading the flag pattern can be done keeping the following key factors in mind:
Confirmation. Wait for the flag pattern to fully develop and look for a breakout from the flag in the same direction as the initial trend
Entry and Stop-Loss. Enter a trade after the breakout and place a stop-loss order just beyond the opposite side of the flag to protect against potential false breakouts
Target. Determine your target price by measuring the height of the flagpole and adding it to the breakout point
Risk management. Implement proper risk management techniques to ensure that you do not risk an excessive portion of your trading capital
6Cup and handle pattern
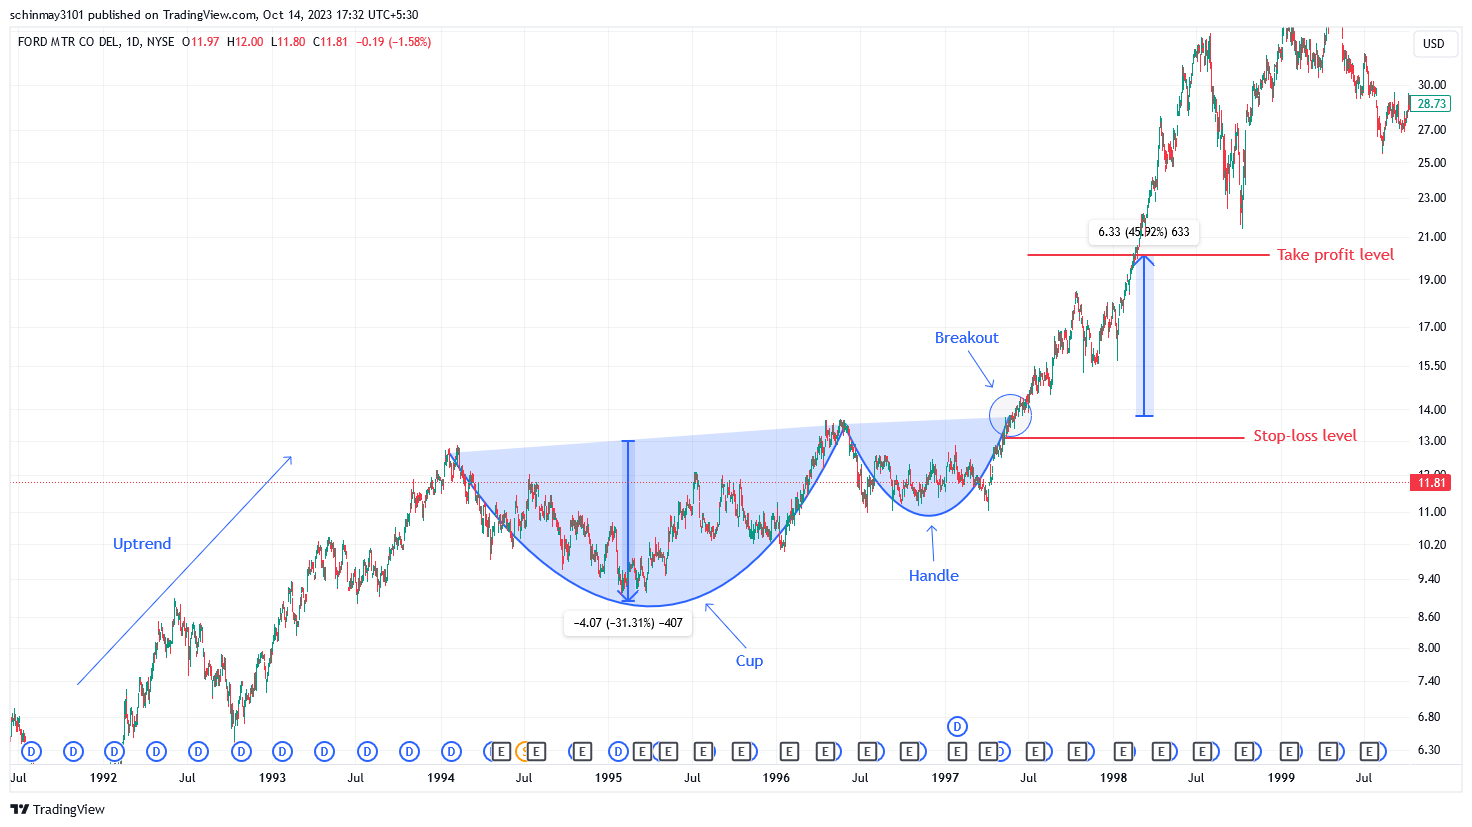
The cup and handle pattern signifies a potential bullish continuation. It is named for its distinctive shape, resembling a teacup with a handle, and often indicates a brief consolidation phase before a price breakout. This pattern is most reliable when it follows an established uptrend.
Identifying the cup and handle pattern
The cup and handle pattern typically consists of two parts:
The cup. This part forms a rounded, “U” shape on the price chart, representing a consolidation phase after a previous uptrend. The depth of the cup can vary, but it's generally smooth and curved
The handle. The handle follows the cup and is characterized by a slight downward drift in prices. This part creates a smaller, downward-sloping structure, often resembling a flag or pennant
How to read the cup and handle pattern?
Trading the cup and handle pattern can be done keeping the following key factors in mind:
Confirmation. Wait for the handle to fully form, and then enter the trade when the price breaks out above the resistance level at the top of the handle
Entry and Stop-Loss. Enter a long position after the breakout, and set a stop-loss order just below the breakout point to manage risk
Target. Determine your target price based on the depth of the cup. You can project a target by measuring the depth of the cup and adding it to the breakout point
Risk management. Apply proper risk management techniques, ensuring that you do not risk more than a predetermined portion of your trading capital
7Wedge patterns
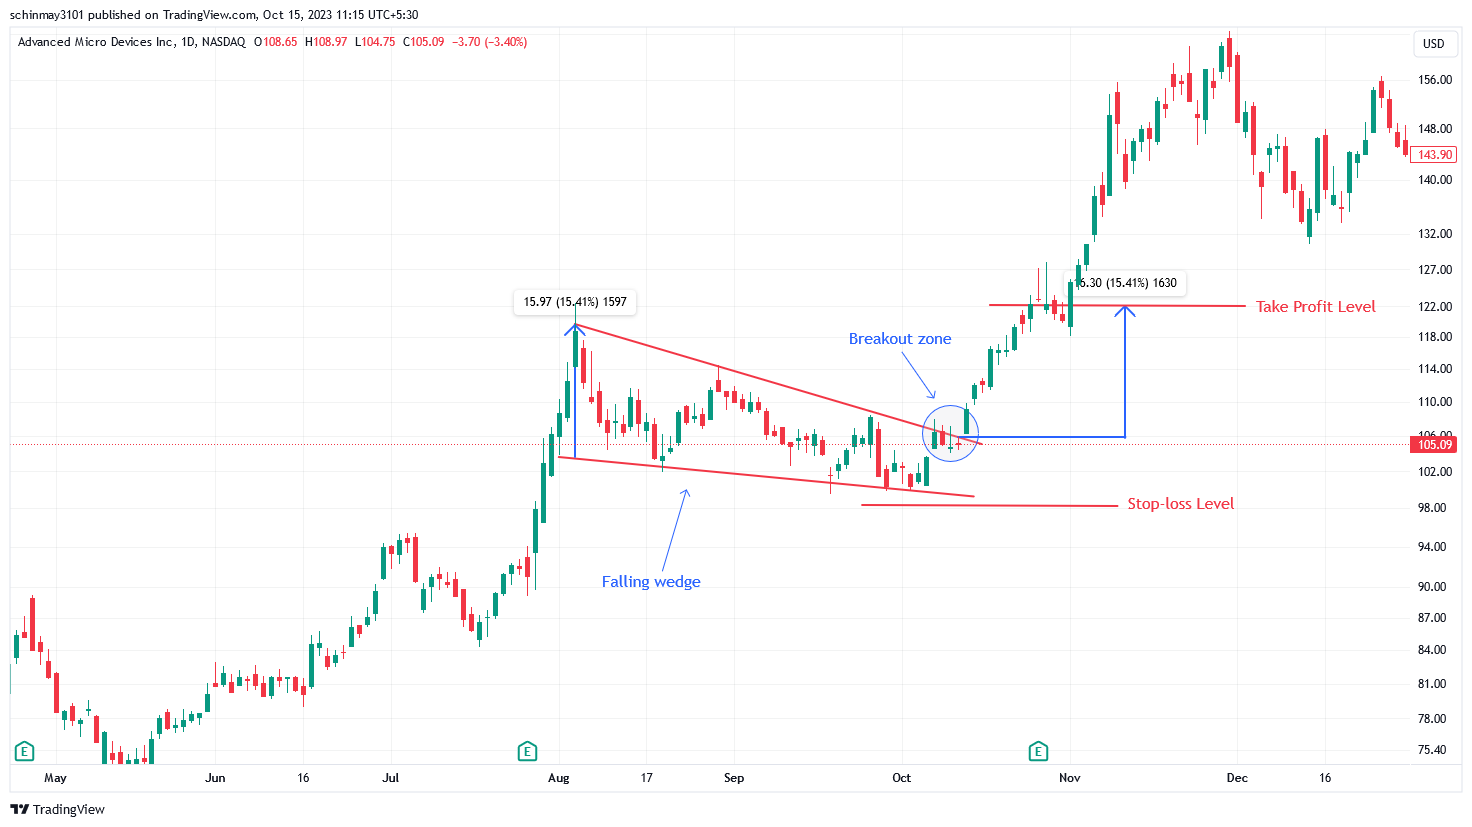
Wedge patterns are used to predict potential changes in a stock's trend. It resembles a narrowing triangle and can be highly accurate if traded with the idea of confluence. These patterns typically indicate a period of consolidation, with an impending breakout.
Identifying wedge patterns
Rising wedge. Look for two converging trendlines where both the upper resistance line and the lower support line slant upwards
Falling wedge. Look for two converging trendlines where both the upper resistance line and the lower support line angle downwards
How to read the wedge pattern?
Trading the wedge patterns can be done keeping the following key factors in mind:
Confirmation. Wait for the wedge pattern to fully develop and watch for a breakout. A breakout above the upper side of a rising wedge is seen as bearish, while a breakout below the lower side of a falling wedge is considered bullish
Entry and Stop-Loss. After a breakout, consider entering a trade and place a stop-loss order just outside the opposite side of the wedge to guard against false breakouts
Target. Determine your target price by measuring the height of the wedge and adding it to the breakout point
Risk management. Implement proper risk management to ensure you don't risk too much of your trading capital. You might be interested in learning more about How To Read Stock Charts ForBeginners.
Types of chart patterns
The three main types of chart patterns are:
Continuation patterns
These patterns indicate that the current trend is likely to persist. They offer signals for traders to stay with the existing trend and can present opportunities for strategic entriesReversal patterns
Reversal patterns suggest a potential change in the current trend's direction. Traders use these patterns to anticipate and prepare for trend reversals, allowing them to adjust their positions accordingly or take new positions at ideal entry levelsBilateral patterns
Bilateral patterns, also known as symmetrical patterns, signify market uncertainty and heightened volatility. They don't provide clear signals for continuation or reversal, making them a reflection of market indecision. Traders should be cautious and prepared for potential changes in either direction when dealing with bilateral patterns
Are chart patterns useful?
Stock market chart patterns serve as a critical component of technical analysis, forming a visual representation of historical price movements. They hold immense importance for traders and investors due to several key factors. To begin, these patterns offer vital insights into market sentiment, shedding light on the emotions and behaviors of both buyers and sellers. This understanding enables traders to make well-informed decisions regarding the timing of their entries and exits. Additionally, chart patterns play a crucial role in recognizing potential shifts in market trends, whether it be reversals or continuations, thereby creating opportunities for traders to benefit from market dynamics. Furthermore, these patterns are instrumental in establishing price targets and stop-loss levels, a fundamental aspect of effective risk management. In summary, stock market chart patterns are indispensable tools that provide traders with the confidence and precision needed to navigate the financial markets successfully.
Best stock brokers 2025


Summary
This comprehensive article provides traders with valuable insights into stock market chart patterns, essential for navigating the dynamic world of stock trading. It underscores the importance of these patterns in technical analysis, emphasizing their role in uncovering market sentiment, identifying trend reversals, and managing risk. The experts classified chart patterns into three categories – continuation, reversal, and bilateral, clarifying their significance for traders. It then explores seven key chart patterns, including the Head and Shoulders, Double Top and Double Bottom, Bullish and Bearish Engulfing, Ascending and Descending Triangles, the Flag, the Cup and Handle, and the Wedge. Each pattern is presented with a clear explanation, methods for recognition, trading strategies, and risk management techniques. In essence, this article equips traders with the knowledge and tools to enhance their trading strategies and make informed decisions in the stock market.
FAQs
What is the most successful chart pattern?
The most successful chart patterns, backed by research, are Head & Shoulders, Double Bottom, Triple Bottom, and Descending Triangle. However, it’s important to keep in mind that the accuracy of these patterns can significantly change based on the strategy used to trade them.
Do chart patterns always work?
While chart patterns represent market dynamics, they are not foolproof, and their success is not guaranteed. They should be used in conjunction with other market analysis methods for a more comprehensive assessment.
How do you read stock charts better?
For better comprehension of stock charts, beginners should focus on essential concepts. They need to recognize trendlines, locate support and resistance levels, be informed about dividend and stock split events, and consider historical trading volumes for a comprehensive analysis.
Which time frame is best for chart patterns?
When it comes to intraday trading and chart patterns, the 5-minute and 15-minute time frames are often considered the best choices by many traders, offering a balance between responsiveness and stability. While 1-minute and 30-minute charts are available, they can be too fast-paced or too slow for many intraday strategies.
Glossary for novice traders
-
1
Long position
A long position in Forex, represents a positive outlook on the future value of a currency pair. When a trader assumes a long position, they are essentially placing a bet that the base currency in the pair will appreciate in value compared to the quote currency.
-
2
Risk Management
Risk management is a risk management model that involves controlling potential losses while maximizing profits. The main risk management tools are stop loss, take profit, calculation of position volume taking into account leverage and pip value.
-
3
Cryptocurrency
Cryptocurrency is a type of digital or virtual currency that relies on cryptography for security. Unlike traditional currencies issued by governments (fiat currencies), cryptocurrencies operate on decentralized networks, typically based on blockchain technology.
-
4
Volatility
Volatility refers to the degree of variation or fluctuation in the price or value of a financial asset, such as stocks, bonds, or cryptocurrencies, over a period of time. Higher volatility indicates that an asset's price is experiencing more significant and rapid price swings, while lower volatility suggests relatively stable and gradual price movements.
-
5
Day trading
Day trading involves buying and selling financial assets within the same trading day, with the goal of profiting from short-term price fluctuations, and positions are typically not held overnight.
Related Articles


Team that worked on the article

Chinmay Soni is a financial analyst with more than 5 years of experience in working with stocks, Forex, derivatives, and other assets. As a founder of a boutique research firm and an active researcher, he covers various industries and fields, providing insights backed by statistical data. He is also an educator in the field of finance and technology.
As an author for Traders Union, he contributes his deep analytical insights on various topics, taking into account various aspects.

Dr. BJ Johnson is a PhD in English Language and an editor with over 15 years of experience. He earned his degree in English Language in the U.S and the UK. In 2020, Dr. Johnson joined the Traders Union team. Since then, he has created over 100 exclusive articles and edited over 300 articles of other authors.

Mirjan Hipolito is a journalist and news editor at Traders Union. She is an expert crypto writer with five years of experience in the financial markets. Her specialties are daily market news, price predictions, and Initial Coin Offerings (ICO).
