How to trade descending triangle patterns on Forex
Trend trading is the No. 1 priority for every trader. To identify a trend and enter the market on time means to earn a maximum return from a trade at minimum risk. Traders do not always manage to identify the beginning of a trend, but they get another chance to enter the market, when the price action forms a corresponding figure of technical analysis, which is a trend continuation figure. In this article, the Traders Union explores one of such figures, namely the descending triangle pattern.
What is a descending triangle pattern?
A descending triangle pattern forms during the consolidation phase within an active, in this case descending, trend. Bulls want to reverse the trend, expecting the price of an instrument to rise, whereas bears keep trying to push the price down.
In the continuous clash between bulls and bears, price swings are limited by the trading range, and as a sideways trend develops, one of the sides begins to gain control. In other words, price swings start shifting towards the top or bottom of the consolidation range, forming a triangle pattern. In our case, the trend is downward, so the price gradually moves to the bottom, namely the horizontal support line.
The highs are getting lower and lower, which suggests that speculators are willing to sell during any rollback, and the number of buyers is getting smaller. As a result of this clash of the Titans, and we know that large institutional players are the main market makers, the support is broken and the downtrend continues to develop.
Such a movement is usually explosive due to the triggering of protective stop-loss orders placed by the bulls below the support line. Besides that, players who use the breakouts trading strategy and open short positions give the price movement a momentum after the support breakout.
Formation of a descending triangle pattern takes at least two months. This pattern is the most reliable only within a long-term downtrend with a long-term consolidation period, when the price is flat.
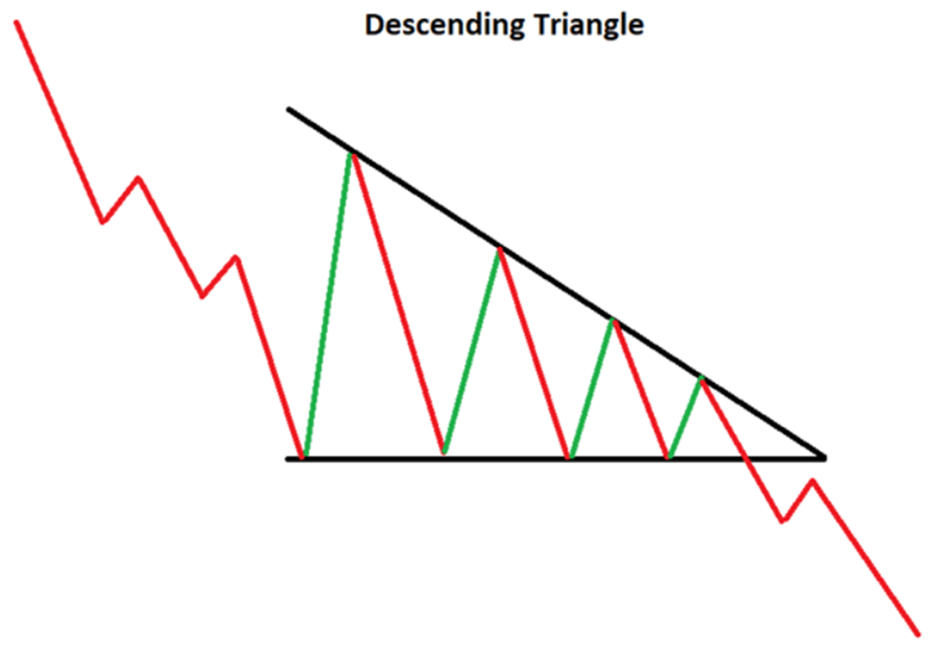
Descending Triangle
In the image above, you can see the formation of a descending triangle pattern with the downward narrowing of price swings and a breakout below the horizontal support line. After the breakout, the price continues to drop.
Besides the descending triangle, there are two more types of triangle patterns: ascending and symmetrical. Ascending triangles are formed under the influence of the same factors as descending ones, but within long-term upward trends.
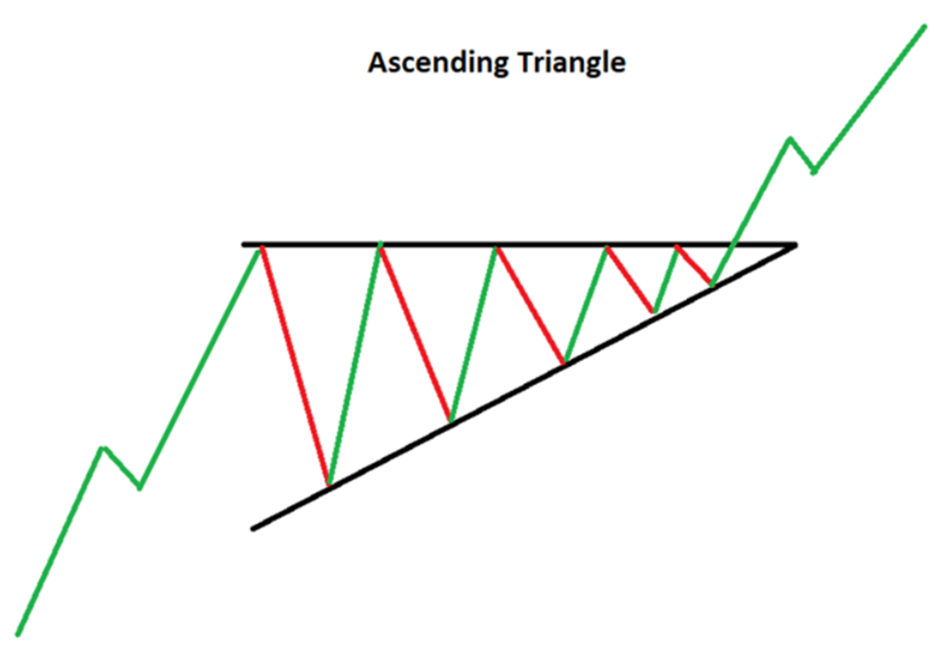
Ascending triangle
The image above shows an ascending triangle pattern. The price consolidates in a range, where the swings get narrow toward the top edge, which is the horizontal resistance line. It means that the bulls buy during any rollback down, and the interest to sell is getting smaller and smaller. As a result, the bulls regain full control over the situation, break the resistance line, and the price, stimulated by protective stop-loss orders and traders who use the breakout strategy and open long positions, goes up.
The symmetrical triangle is the third type of triangle patterns. In cases with both descending and ascending triangles, you mostly see trend continuation figures, where the ascending triangle indicates the continuation of an uptrend and the descending triangle shows the continuation of a downtrend, whereas after the symmetrical triangle is formed, the price may break it in either direction.
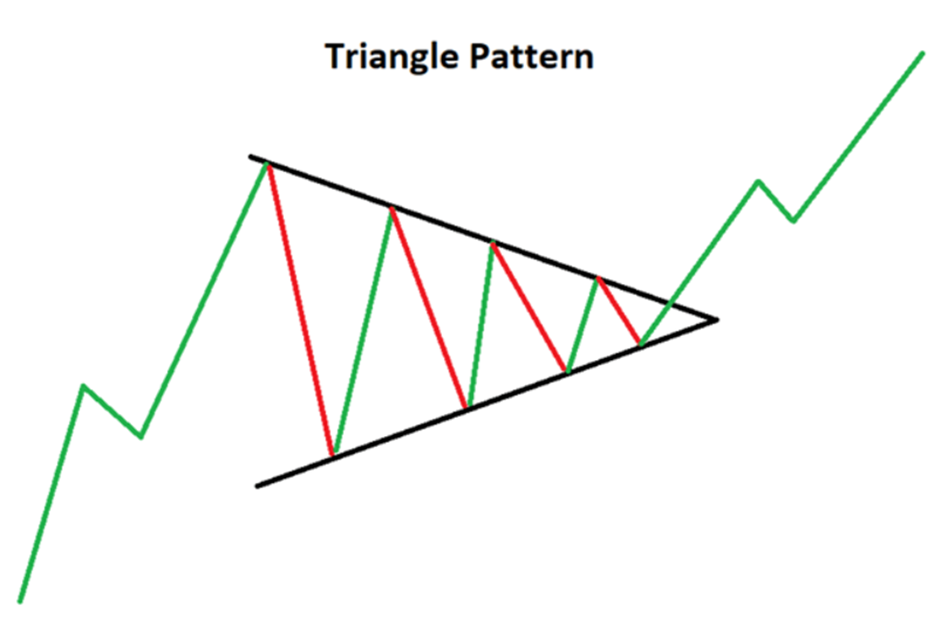
Triangle Pattern
As you can see in the image above, price swings within the consolidation phase get narrow in the middle of the triangle, then follows a breakout of the top edge of the range, i.e., the descending resistance line, and the price rises. As has been said, a breakout can happen in either direction, which is why trading symmetrical triangle patterns requires you to be as patient as possible and wait for the confirmation of a breakout. Otherwise, you could open a position on a false breakout and incur a loss out of the blue, as they say. This mistake will make you nervous, and it will be difficult for you to make a plan “B” and win back what you lost.
How to trade descending triangle patterns
The breakout strategy – in our case, the horizontal support line breakout – is the most common trading strategy that uses descending triangle patterns. Every professional trader knows from experience that breakouts of strong levels allow him to enter the market and make a great profit from the strong price movement after consolidation in the range. It hurts to miss the start of a trend, and the upset look of a trader who has just missed such a movement can evoke sympathy even in the most ruthless and unsympathetic serial killer. And here, like light at the end of the tunnel, a descending triangle pattern begins to form. The trader understands that life isn’t over yet, and birds keep singing (even louder now), and the sun is shining brightly, and he can still catch a considerable part of the trend and gain a good profit.
Therefore, the start and formation of a descending triangle pattern provides a trader with another unique opportunity to enter the market on the trend by opening a short position. Being under pressure from the sellers, the price of an asset, over a long period of time, gradually moves down to the horizontal support line and breaks it.
You can catch a breakout by placing a pending sell order below the support line. This provides an opportunity to open a position almost at the very beginning of a descending movement. The downside of this approach is that you need to correctly identify the level at which a pending sell order will be triggered, otherwise you may open a short position on a false support breakout, and when the price returns to the consolidation range, a protective stop-loss order will be triggered.
As a result, you will lose money, although, after returning to the range, the price may break a level again – this time it could be a true breakout – and move in the direction the trader needs. In this situation, you will either be in low spirits and afraid to open another position, like a burnt child who dreads the fire, or will start to desperately short the instrument and risk encountering another false breakout, because when a figure is forming, there can be several false breakouts, which is shown in the example below:
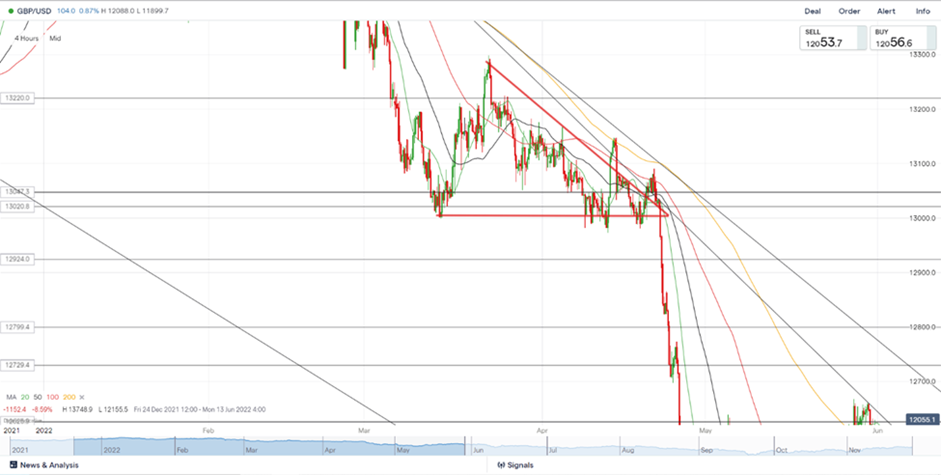
How to trade descending triangle patterns
On this chart, the GBP/USD pair drops below the support line and returns to the trading range several times. If a trader placed a pending sell order too close, he would incur a loss, like in the situation described above.
Undoubtedly, such occurrences are more typical of novice traders than professionals who use their experience and knowledge, possibly acquired from reading this article, to identify patterns more accurately and receive confirmations of breakouts through other tools of technical analysis.
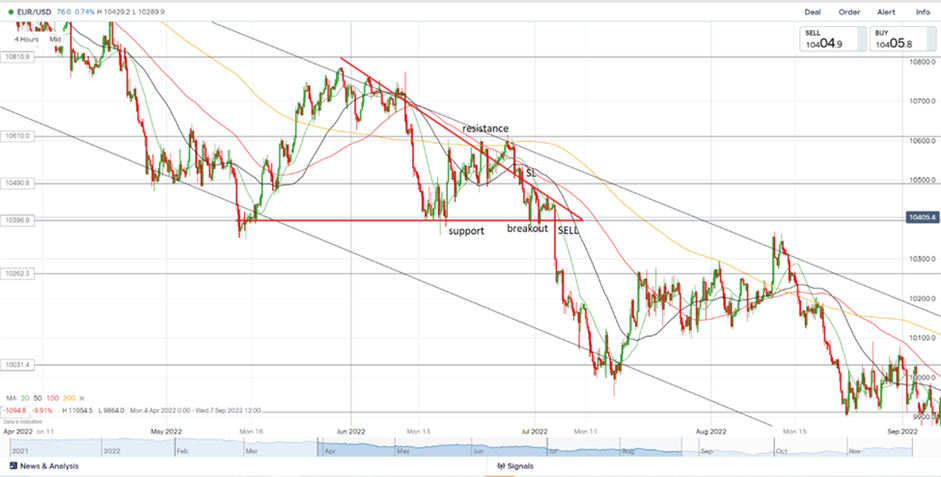
How to trade descending triangle patterns
In the example above, you see the EUR/USD pair, which is in an active downtrend. After a bounce back to resistance, price swings gradually go narrow towards the horizontal support line until it is broken, and the euro keeps dropping. Consolidation of the price takes place from May to July, i.e., it’s the classic descending triangle pattern.
In this case, placement of a pending sell order below the support line would be a very good idea, because, as you can see, the price does not roll back to the broken line, which would be a resistance line if the price did roll back to it. Now, let’s move on to the next variant of breakouts trading: opening a short position on a rollback to the broken level.
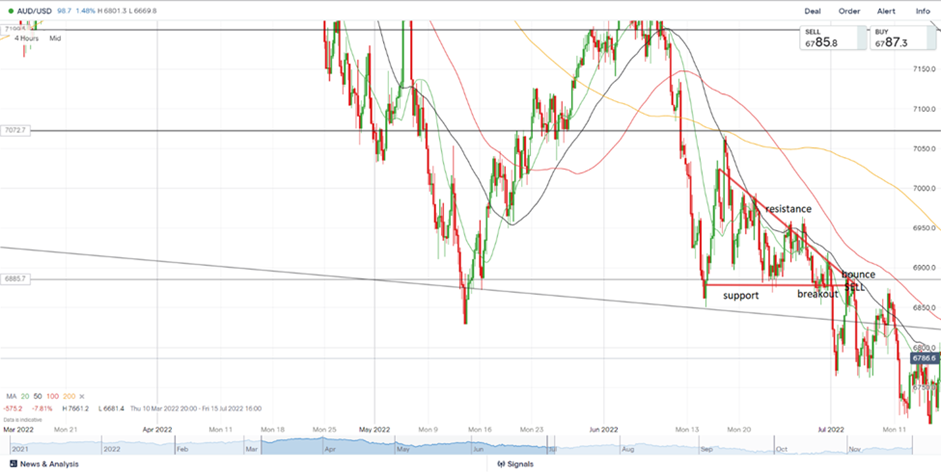
How to trade descending triangle patterns
This example of the AUD/USD chart shows the narrowing of price swings, a breakout of support and a rollback to it, where a trader can open a short position.
Of course, on real charts, triangle patterns rarely take perfect shapes like in the schematic images above but, with enough experience, traders can identify patterns on time and prepare to enter the market accordingly.
Remember that the descending triangle pattern must form within a downtrend during the consolidation phase, otherwise you may find yourself in an unpleasant situation, like on the chart below:
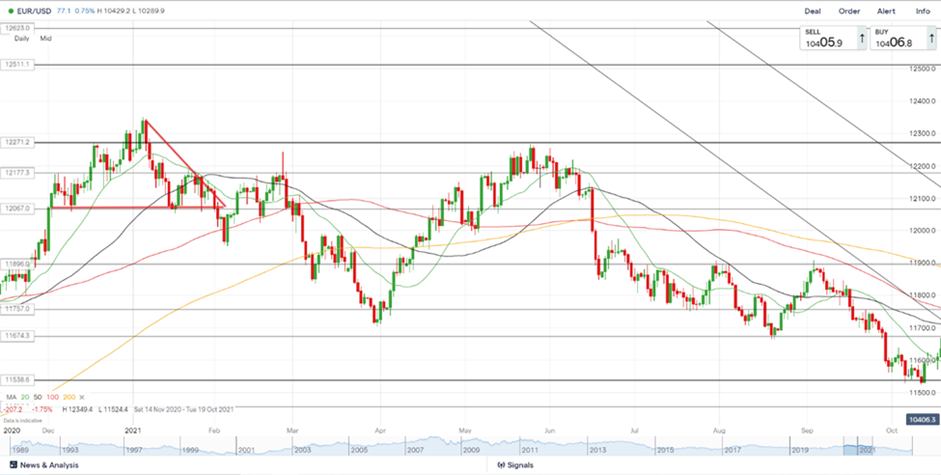
How to trade descending triangle patterns
As you can see, the price breaks the support but soon rises and comes close to the resistance outside of the triangle. In this case, the triangle does not form within a downtrend, so a trader should ignore it.
More experienced and bold traders can enter the market to sell near a descending resistance line with a stop-loss order above it, but this method will hardly be suitable for novices.
The profit target is usually set as the distance between the resistance and the highest high of the range. Having opened a position, you can also use a trailing stop-loss order, which will allow you to limit the amount of a potential loss as the price declines but, at the same time, there is a risk of an early position closure, after which the price will keep going down.
How to use descending triangle patterns more effectively
Effective use of descending triangles in trading traditionally includes the application of other tools of technical analysis, such as the RSI (relative strength index), where the price’s exit from an oversold condition may precede the trend continuation, and the volume indicator, where a decrease in the trading volume near the support line may signal its forthcoming breakout, and a volume increase on the breakout may become its confirmation. Low volume on the breakout, in turn, may indicate that this breakout is false.
The use of moving averages enables traders to identify support and resistance levels.
However, these tools are not perfect either, so traders should also use analysis of fundamental factors that can influence the asset price action.
Conclusion
The use of descending triangle patterns to open short positions within a trend is a very effective method of trading in financial, commodity, and stock markets. It enables traders to achieve great results with a practically perfect risk/reward ratio. Long periods of waiting and identification are the only drawbacks of such patterns, but a potential profit that a trader can make will become a decent reward for patience.
FAQ
What is a descending triangle pattern?
A technical analysis figure in the form of a triangle with a descending resistance line and a horizontal support line is called a descending triangle pattern.
What factors lead to the formation of a descending triangle pattern?
Increased pressure on the price of an instrument during the consolidation phase within a downtrend leads to the formation of a descending triangle pattern on the chart.
Is a descending triangle a trend continuation or trend reversal figure?
The descending triangle pattern within a downtrend is an exclusively trend continuation figure.
What trading strategy is used after the descending triangle pattern is formed?
Traditionally, the breakout strategy is used. In this case, the support line breakout strategy.
Glossary for novice traders
-
1
Index
Index in trading is the measure of the performance of a group of stocks, which can include the assets and securities in it.
-
2
Trend Trading
Trend trading is a trading strategy where traders aim to profit from the directional movements of an asset's price over an extended period.
-
3
Upward Trend
Uptrend is a market condition in which prices are generally rising. Uptrends can be identified by using moving averages, trendlines, and support and resistance levels.
-
4
Long position
A long position in Forex, represents a positive outlook on the future value of a currency pair. When a trader assumes a long position, they are essentially placing a bet that the base currency in the pair will appreciate in value compared to the quote currency.
Related Articles


Team that worked on the article

Mikhail Vnuchkov joined Traders Union as an author in 2020. He began his professional career as a journalist-observer at a small online financial publication, where he covered global economic events and discussed their impact on the segment of financial investment, including investor income. With five years of experience in finance, Mikhail joined Traders Union team, where he is in charge of forming the pool of latest news for traders, who trade stocks, cryptocurrencies, Forex instruments and fixed income.

Olga Shendetskaya has been a part of the Traders Union team as an author, editor and proofreader since 2017. Since 2020, Shendetskaya has been the assistant chief editor of the website of Traders Union, an international association of traders. She has over 10 years of experience of working with economic and financial texts. In the period of 2017-2020, Olga has worked as a journalist and editor of laftNews news agency, economic and financial news sections. At the moment, Olga is a part of the team of top industry experts involved in creation of educational articles in finance and investment, overseeing their writing and publication on the Traders Union website.
