Best Stock Software and Tools in 2026


Editorial Note: While we adhere to strict Editorial Integrity, this post may contain references to products from our partners. Here's an explanation for How We Make Money. None of the data and information on this webpage constitutes investment advice according to our Disclaimer.
The best stock software and tools in 2026 are:
Stock Rover – Best overall stock analysis software.
MetaStock – Runner-up best stock analysis software.
TC2000 – Best free stock analysis software.
TradingView – Best stock analysis software for technical analysis.
TrendSpider – Best stock analysis software for charting capabilities.
Finviz.com – Best stock analysis software for screeners.
NinjaTrader – Best stock analysis software for automation.
Bloomberg – Best stock analysis software for real-time data.
Scanz – Best stock analysis software for day trading.
The best stock software and tools are essential for traders and investors to make informed decisions and optimize their strategies. These tools provide real-time data, advanced charting, and analytics to help identify trends, manage risks, and execute trades efficiently. By simplifying complex data and offering actionable insights, they save time and improve accuracy, enabling users to stay competitive in fast-moving markets.
In this article, explore the top stock software and tools in 2026 that can elevate your trading strategy and help you stay ahead in competitive markets.
Top stock analysis software providers
While there are many stock tools available online, here are the best stock software and tools for 2026.
Stock Rover - Best overall stock analysis software

Almost every major broker, including Fidelity and Firstrade, is integrated with StockRover. Although you won't be able to trade from the charts, it will handle profit and loss reporting as well as portfolio rebalancing suggestions. Long-term investors and those trying to maximize their portfolio income will benefit the most from this program.
- Pros
- Cons
Comparative analysis of the highest level.
Recommendations with data to back them up.
There is no need to install anything.
PC, Mac, Smartphone, and Tablet versions are all available.
Real-time reports on certain stocks are incredible.
More technical indicators would be beneficial.
Stock Rover pricing model:
Essentials. ($7.99/month; $79.99/year; $139.99 / 2 yr)
Premium. ($17.99/month; $179.99/year; $319.99 / 2 yr)
Premium Plus. ($27.99/month; $279.99/year; $479.99 / 2 yr)
MetaStock – Runner-up best stock analysis software
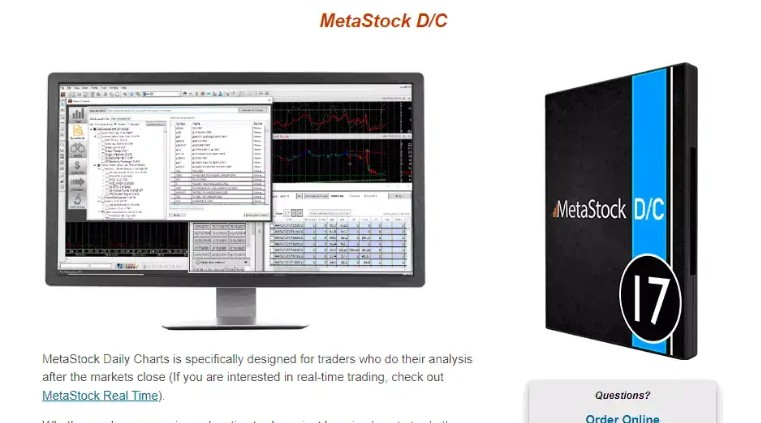
MetaStock offers comprehensive tools for expert stock research, covering both technical and fundamental analysis. The MetaStock Xenith provides real-time news from Reuters, professional insights, and extensive analytics. Traders can use Daily Charts for post-market analysis or MetaStock for real-time trading. Additionally, Refinitiv DataLink includes historical data from 1980.
- Pros
- Cons
Scanning and analyzing tools that are powerful.
A broad range of customization options are available.
The user interface is simple to use.
You may use it to create indicators and trading strategies.
Some plans are more expensive than their competitors.
MetaStock pricing model:
MetaStock Real Time (R/T) is designed for active traders requiring intraday data. This version is available for $100 per month. Alternatively, a one-time purchase is available for $1,395, with a separate subscription to Xenith for real-time data.
MetaStock Daily Charts (D/C) is ideal for end-of-day traders. This version is priced at $69 per month or $745 annually. A perpetual license can be purchased for $499.
MetaStock also provides a 30-day trial period for users to evaluate the platform before committing to a subscription.
TC2000 – Best free stock analysis software
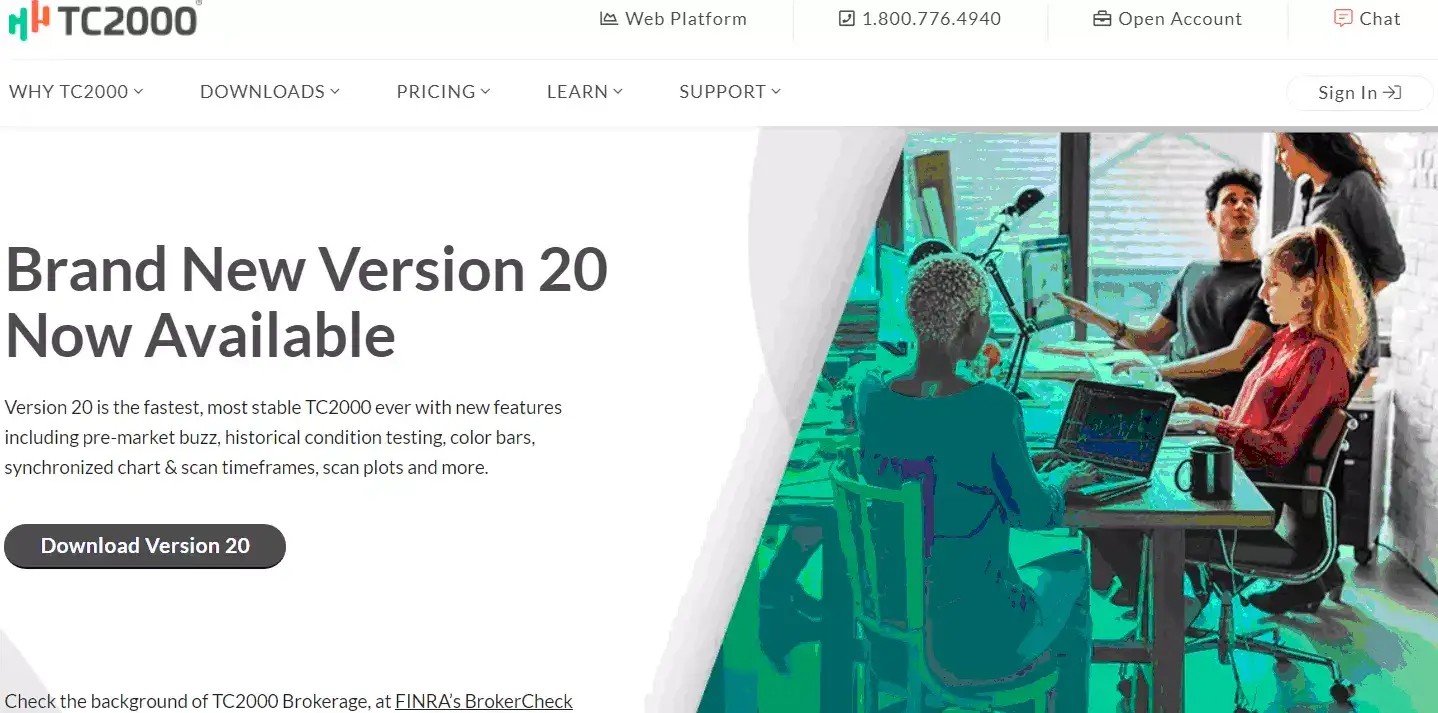
TC2000 offers stock analysis software for equities and mutual funds in the U.S. and Canada. It includes watchlists, charts, alerts, news, and backtesting tools for historical data. While it lacks automated trading and supports only stocks, ETFs, and funds, it remains a robust option for market analysis.
- Pros
- Cons
Scanning and charting technologies are powerful.
Has an interface that is simple to use.
Graphics that are detailed.
Beginners can use a virtual simulator to practice trading utilizing their techniques.
To avoid getting overwhelmed by the volume of data, filtering methods must be implemented.
TC2000 pricing model:
Silver. (Monthly: $9.99/mo; Annually: $8.32/mo; Bi-annually: $7.49/mo)
Gold. (Monthly: $29.99/mo; Annually: $24.99/mo; Bi-annually: $22.49/mo)
Platinum. (Monthly: $59.99/mo; Annually: $49.99/mo; Bi-annually: $44.99/mo)
TradingView – Best stock analysis software for technical analysis

TradingView has comprehensive broker connections, so you can place trades using charts and not bother about analysis, profit reporting, or anything else because it'll all be taken care of for you. Stock options trading, on the other hand, is not covered.
- Pros
- Cons
Development of a simple system.
It's simple to use and suitable for beginners.
Data is exchanged in real time all around the world.
Screening of high-quality stocks.
Trades Forex, equities, and cryptocurrencies in the United States and throughout the world.
There is a chat feature.
There is no real-time news available.
TradingView pricing model:
Essential. $12.95/month; $155.40/year
Plus. $24.95/month; $299.40/year
Premium. $49.95/month; $599.40/year
TrendSpider – Best stock analysis software for charting capabilities

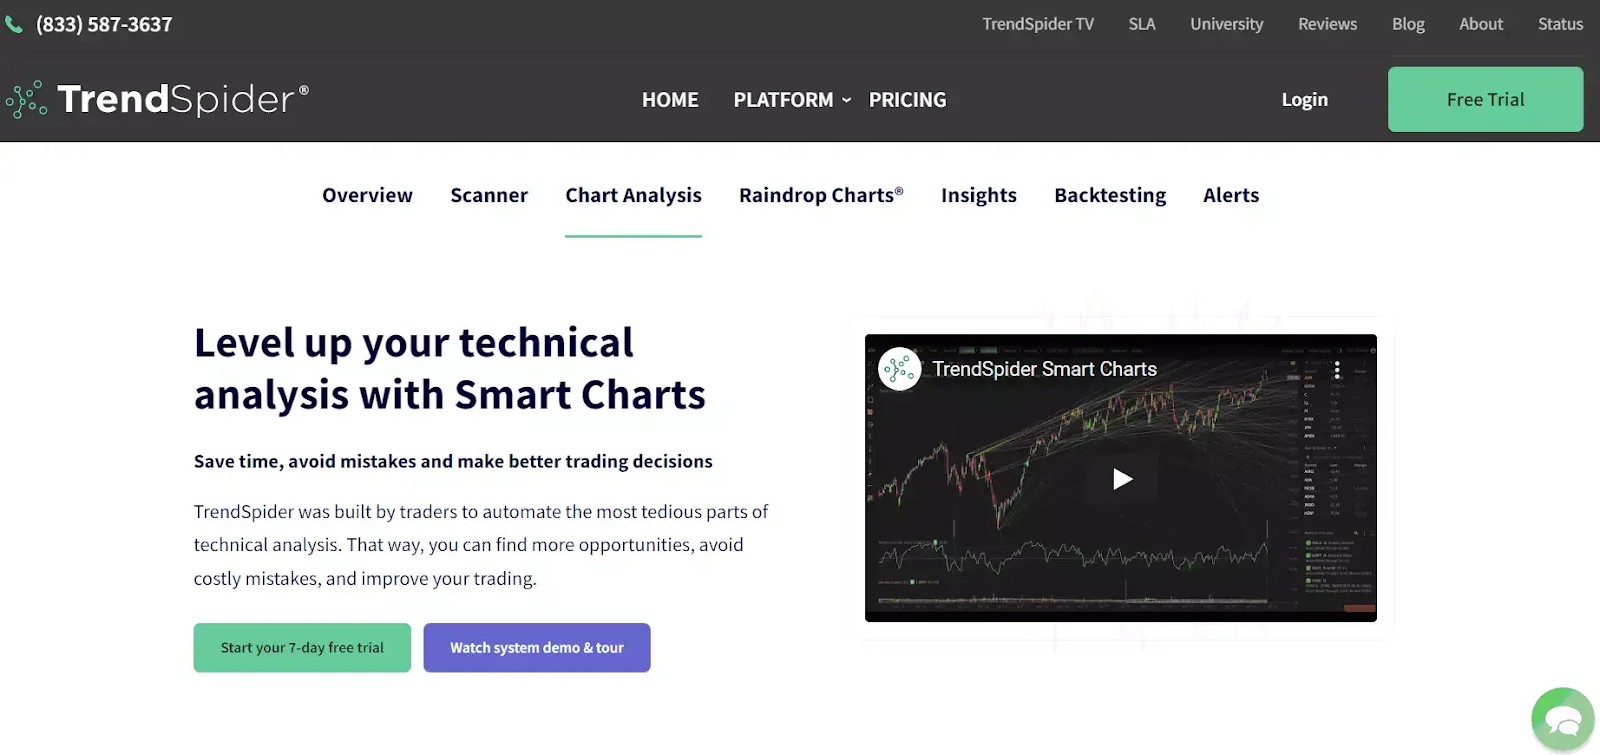
The TrendSpider program is jam-packed with technical analysis features, making it ideal for anybody serious about market analysis who wants to get the job done right the first time. TrendSpider’s automatic trend lines, which elevate the software to a top package in the finance business, will please those who prioritize backtesting.
- Pros
- Cons
Multi-Timeframe Analysis that is done automatically.
Backtesting is simple to use.
Trend Line Detection is automated.
Data is exchanged in real-time.
ETFs, stocks, Forex, futures, cryptocurrency, and indices are all examples of financial instruments.
There is no copy trading available.
There is no automated trading available.
TrendSpider pricing model:
Standard. 7% Off 1st Year ($49.76/month)
Enhanced. 48% Off 1st Year ($51.22/month)
Advanced. 67% Off 1st Year ($73.76/month)
Finviz.com – Best stock analysis software for screeners

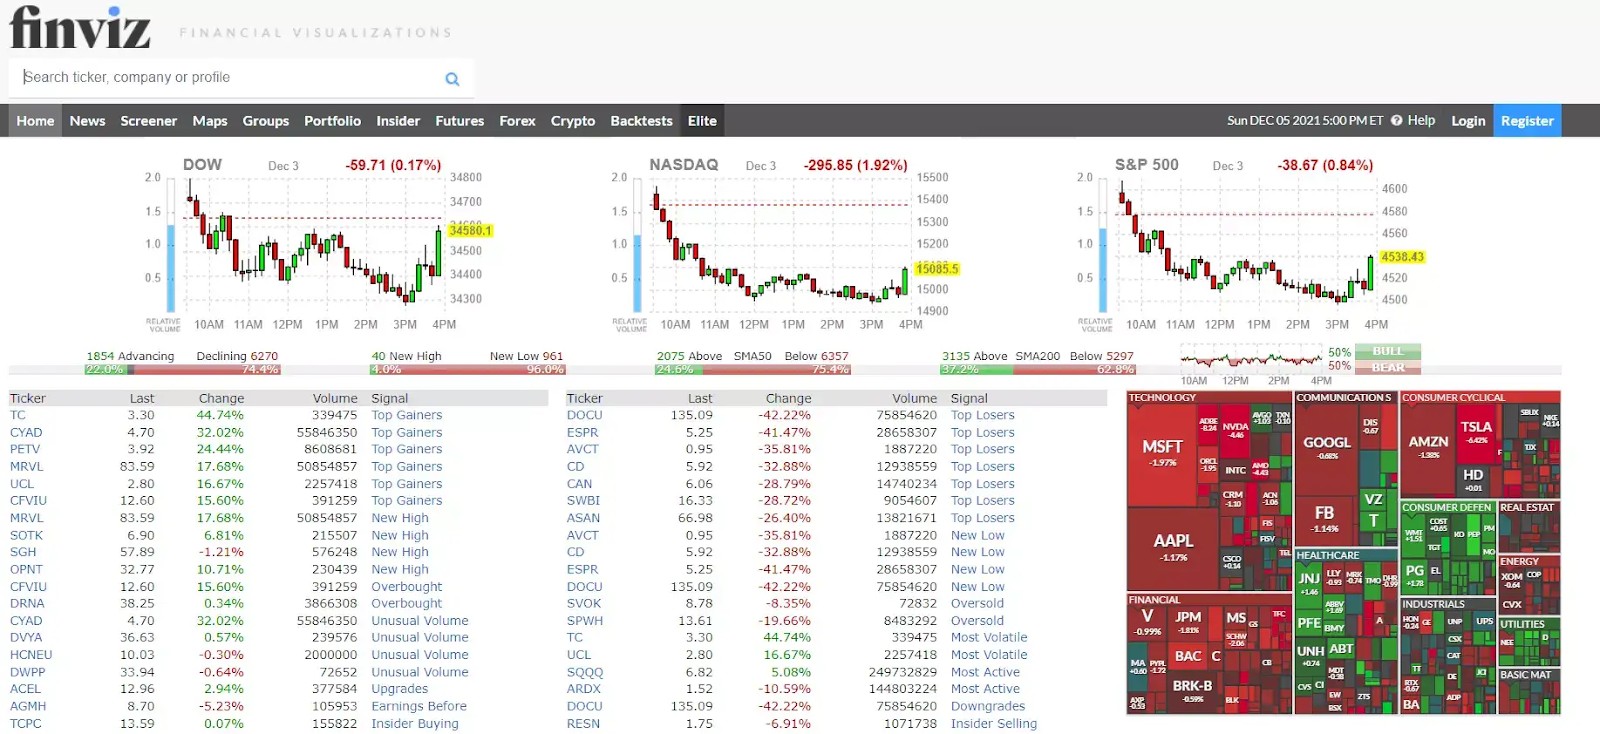
Finviz is a financial visualization application that includes a stock screener and trading tool. Finviz helps traders and investors swiftly filter and locate stocks based on pre-defined criteria, which saves time for professional traders.
- Pros
- Cons
It's free (for the most part).
It has a simple UI.
Large depth of offering.
Offers insider sales tracking
The ads for the free version are annoying.
Finviz.com pricing model:
Finviz Elite: $39.50 per month.
Finviz Yearly: $299.50.
NinjaTrader – Best stock analysis software for automation
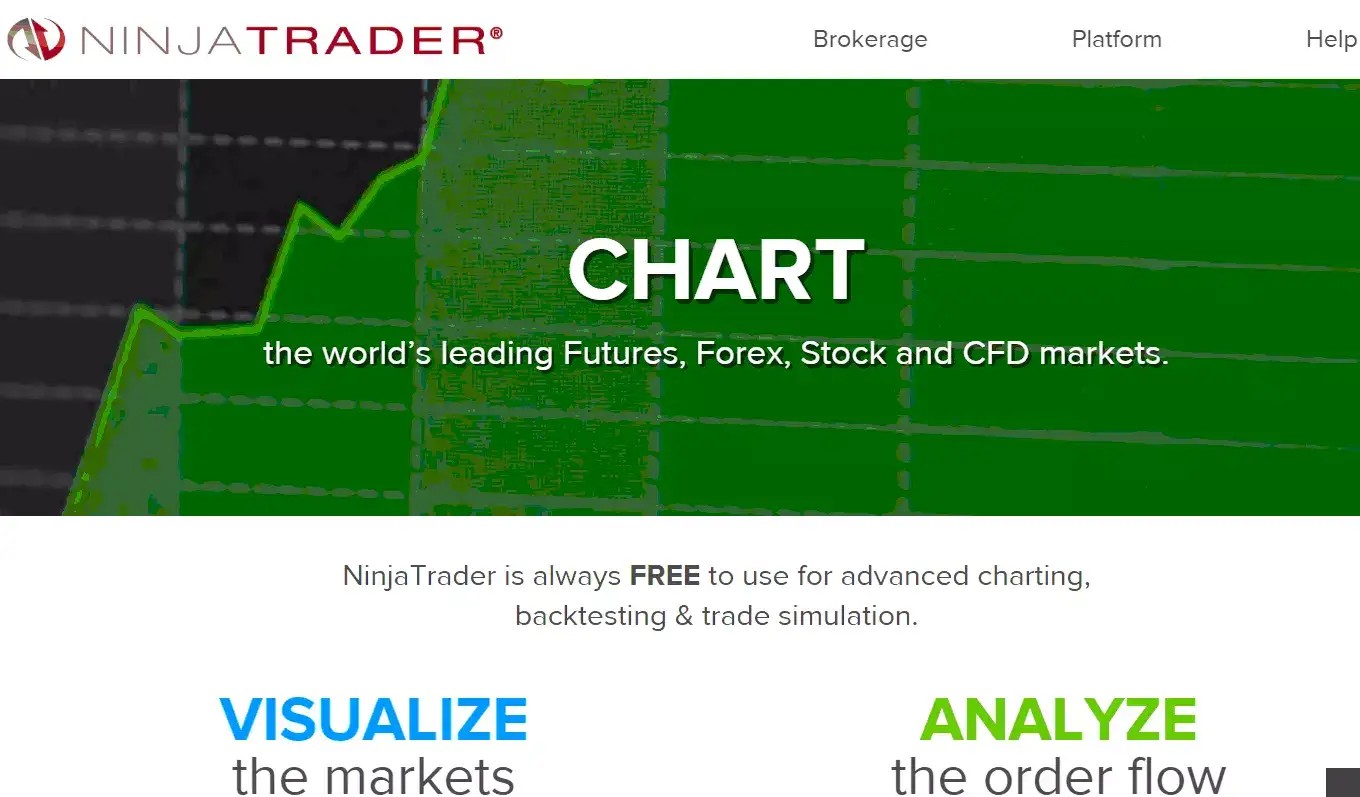
The NinjaTrader program provides traders with customizable choices as well as third-party solutions to assist them in resolving any issues. All of the main elements, including charting, technical indicators, research tools, and fundamentals, are available to traders.
- Pros
- Cons
Fees and commissions are reasonable.
This is excellent instructional content.
The platform is of high quality.
Excellent research resources.
Fees for withdrawals are higher than those charged by rivals.
There is currently no mobile app available.
Futures and options on futures are the only assets available.
NinjaTrader pricing model:
Free ($0). Pay as you trade with no monthly fee.
Monthly ($99). Reduce your per-trade commissions.
Lifetime ($1,499). Lowest Commissions and Order Flow + Add-On Included.
Bloomberg – Best stock analysis software for real-time data
Bloomberg is a comprehensive financial service aimed at traders and investors, as well as huge multinational banks and brokerage firms. This platform is comprehensive in its coverage of all aspects of finance and a wide range of services offered.
- Pros
- Cons
Excellent technical analysis graphs.
Backtesting is of the highest caliber.
Professional advisory services are available.
Excellent margin rates are available.
Very steeply priced when compared to others on this list.
There is no option for social trading.
Bloomberg pricing model:
$34.99/month ($1.99/month for first 3 months)
$180 your first year (i.e $15/month)
Scanz – Best stock analysis software for day trading
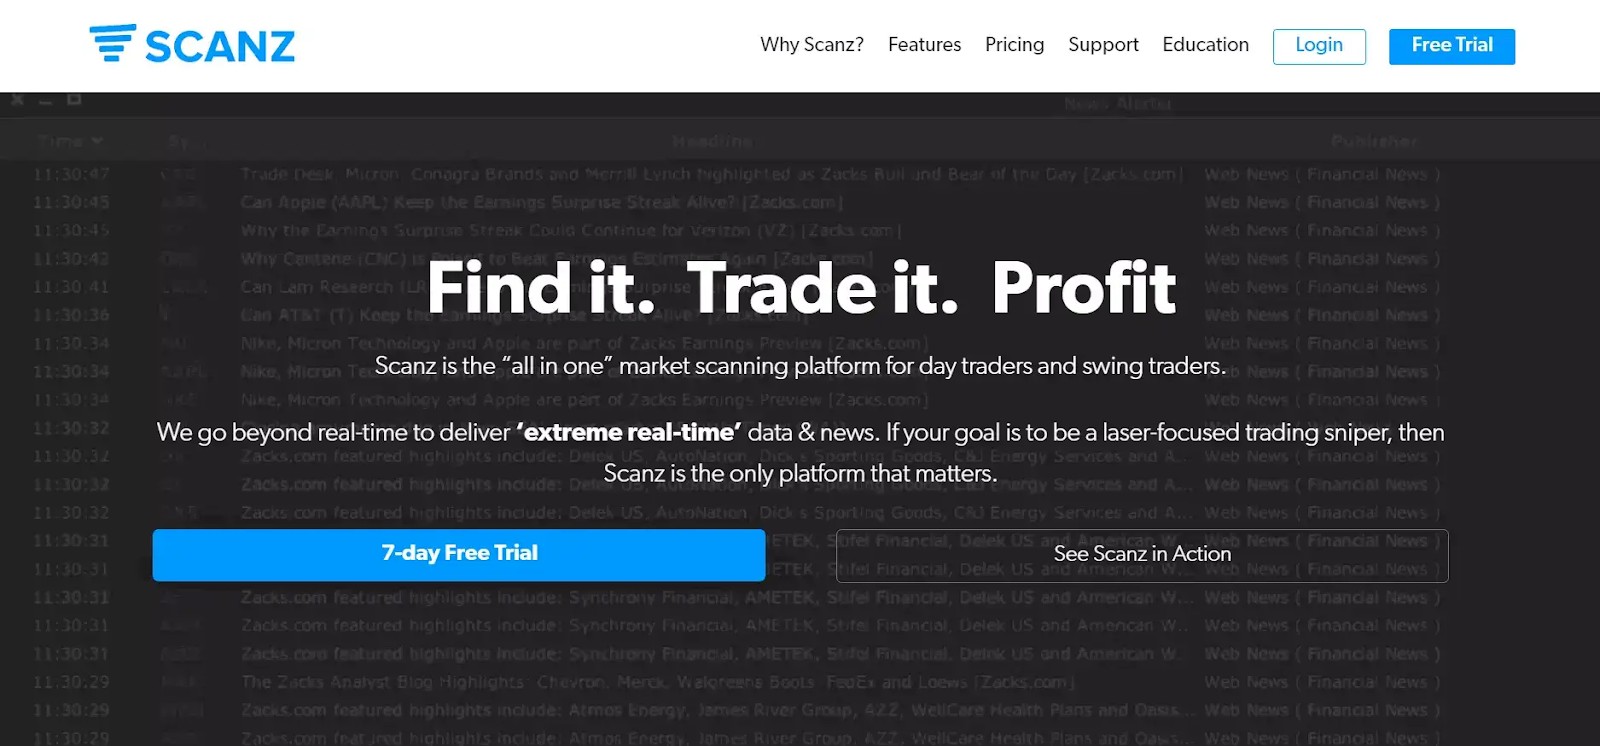
Scanz is one of the top alternatives for day traders, earning our best for day traders title for a variety of reasons. This stock market tool focuses on delivering real-time statistics and news to your computer screen. The cost is reasonable, but it also gives you a lot of your money.
- Pros
- Cons
Stock screener is of excellent quality.
It's simple to use.
Real-time news that is smart and dependable.
A large number of broker interfaces are available.
Can be pricier than other platforms of similar worth.
Scanz pricing model:
$197/month (Includes Level 1 and Level 2 quotes)
Should you use stock analysis software?
Utilizing stock analysis software can significantly enhance your investment decisions by providing comprehensive tools for evaluating market data. These platforms offer both fundamental and technical analysis capabilities, enabling investors to assess a company's financial health and interpret market trends effectively.
Fundamental analysis tools within these software solutions allow investors to examine financial statements, earnings reports, and key ratios, facilitating a deeper understanding of a company's intrinsic value. Technical analysis features provide access to historical price data, charting tools, and various indicators, assisting in identifying patterns and predicting future price movements. By integrating these analyses, investors can make more informed decisions, balancing short-term market trends with long-term financial assessments.
Moreover, stock analysis software often includes real-time data feeds, customizable alerts, and portfolio management features, streamlining the investment process. These tools can help investors stay updated on market developments, monitor their investments efficiently, and adjust their strategies as needed.
However, it's essential to recognize that while stock analysis software provides valuable insights, it does not guarantee investment success. Investors should use these tools as part of a broader strategy that includes thorough research, risk assessment, and alignment with individual financial goals.
How trading technical analysis software helps
Technical analysis software is used to download and analyze financial market data and visualize historical price movements. Below is a detailed breakdown of its functions:
Data retrieval. The software collects stock prices, including open, close, and last prices, along with bid-ask spreads and trading volume, often from an exchange requiring a fee.
Chart creation. It uses the time of transactions (X-axis), stock prices (Y-axis), and trading volumes (bars) to plot detailed stock charts.
Key inputs. Essential data includes transaction times, prices, and volumes to understand supply and demand dynamics.
Indicator options. Users can apply various price and volume-based indicators to predict future stock price movements.
How to choose the best stock software?
In general, you can apply the following best practices and tips to choose the best stock software for you:
Price. Set a budget and compare one-time fees to recurring costs to find the most cost-effective option.
Speed. Prioritize software with fast trade execution; check customer reviews for speed-related issues.
Accessibility. Ensure compatibility with your hardware or operating system; some tools work only on Windows, while others are web-based.
Features and metrics. Identify key features and metrics important to your trading style to select the best fit.
Demo accounts. Opt for software offering demo accounts to test the platform risk-free before purchasing.
Indicators. Explore tools with unique indicators, such as MetaStock's RMO trading indicator, for added trading insights.
Free trials. Take advantage of free trials to evaluate the software’s usability and features before committing.
| Account min. | Demo | Signals | Research and data | Basic stock/ETF fee | Min. stock/ETF fee | Deposit fee, % | Withdrawal fee | Open an account | |
|---|---|---|---|---|---|---|---|---|---|
| 50 | Yes | Yes | Yes | No | No | No | No | Go to broker Your capital is at risk. |
|
| EUR500 | Yes | Yes | Yes | $0.006 | Not specified | No | No | Go to broker 80% of retail CFD accounts lose money. |
|
| No | Yes | Yes | Yes | $0 | $0 | Not specified | Not specified | Study review | |
| No | No | Yes | Yes | 0.12%-0.25% | £1.00/€1.00 | No | No charge up to a limit | Study review | |
| No | Yes | Yes | Yes | 0-0,0035% | $1,00 | No | No | Study review |
By leveraging AI, beginners can gain a deeper understanding of market dynamics

Diving into the world of stock analysis software can be overwhelming for beginners, but focusing on platforms that offer AI-driven insights can provide a significant edge. For instance, some software utilizes artificial intelligence to analyze vast amounts of data, identifying patterns and trends that might be missed by the human eye. This feature not only enhances decision-making but also accelerates the learning curve for newcomers. By leveraging AI, beginners can gain a deeper understanding of market dynamics without getting bogged down by complex data analysis.
Another crucial aspect to consider is the availability of community-driven insights within the software. Platforms that foster a collaborative environment allow users to share strategies, discuss market movements, and learn from experienced traders. Engaging with a community can provide real-time feedback and diverse perspectives, which are invaluable for honing trading skills.
Conclusion
In conclusion, leveraging the best technical analysis software in 2026 is crucial for traders seeking a competitive edge in the fast-evolving financial markets. With platforms like TradeAlgo and ChartMaster offering real-time data integration, advanced charting, and intuitive analytics, users can make smarter, faster decisions. The key takeaway is clear: harnessing innovative tools not only streamlines the analysis process but also empowers traders to seize opportunities as they arise. Ultimately, those who invest in cutting-edge technology will remain ahead of the curve, turning insights into consistent results.
FAQs
What key factors should beginners consider when choosing the best technical analysis software and tools in 2026?
How do pricing models vary among top technical analysis software and tools in 2026?
In what ways can technical analysis software improve portfolio management for traders and investors?
What role do screeners and customizable filters play in maximizing the effectiveness of technical analysis software?
Editors' Top Picks and Insights

SpaceX falls out of orbit: Does anyone still want Musk’s stock?

The crypto IPO problem: How high-profile listings became investor traps

U.S. Bitcoin reserve: Trump’s unrealized crypto promise

Aiming for leadership: Payment giants prepare a new stablecoin

Proof of Reserves: the new standard for cryptocurrency exchanges

Three trends that could reshape the crypto market over the next decade
Related Articles
Team that worked on the article
Parshwa is a content expert and finance professional possessing deep knowledge of stock and options trading, technical and fundamental analysis, and equity research. As a Chartered Accountant Finalist, Parshwa also has expertise in Forex, crypto trading, and personal taxation.
Chinmay Soni is a financial analyst with more than 5 years of experience in working with stocks, Forex, derivatives, and other assets. As a founder of a boutique research firm and an active researcher, he covers various industries and fields, providing insights backed by statistical data.
Mirjan Hipolito is a journalist and news editor at Traders Union. She is an expert crypto writer with five years of experience in the financial markets.
Trade execution is knowing how to place and close trades at the right price. This is the key to turning your trading plans into real action and has a direct impact on your profits.
Copy trading is an investing tactic where traders replicate the trading strategies of more experienced traders, automatically mirroring their trades in their own accounts to potentially achieve similar results.
Fundamental analysis is a method or tool that investors use that seeks to determine the intrinsic value of a security by examining economic and financial factors. It considers macroeconomic factors such as the state of the economy and industry conditions.
Crypto trading involves the buying and selling of cryptocurrencies, such as Bitcoin, Ethereum, or other digital assets, with the aim of making a profit from price fluctuations.
Day trading involves buying and selling financial assets within the same trading day, with the goal of profiting from short-term price fluctuations, and positions are typically not held overnight.

-
 Afghanistan
-
 Albania
-
 Algeria
-
 Angola
-
 Argentina
-
 Armenia
-
 Australia
-
 Austria
-
 Azerbaijan
-
 Bahamas
-
 Bahrain
-
 Bangladesh
-
 Belarus
-
 Belgium
-
 Bolivia
-
 Botswana
-
 Brazil
-
 Brunei
-
 Bulgaria
-
 Cambodia
-
 Cameroon
-
 Canada
-
 Chile
Chile
-
 China
China
-
 Colombia
-
 Congo
Congo
-
 Costa Rica
-
 Cote d'Ivoire
-
 Croatia
-
 Cuba
Cuba
-
 Cyprus
-
 Czechia
-
 DR Congo
-
 Denmark
-
 Dominican Republic
-
 Ecuador
-
 Egypt
Egypt
-
 El Salvador
-
 Estonia
-
 Eswatini
-
 Ethiopia
-
 Finland
-
 France
-
 Georgia
-
 Germany
-
 Ghana
Ghana
-
 Greece
-
 Haiti
Haiti
-
 Hong Kong
-
 Hungary
-
 India
India
-
 Indonesia
-
 Iran, Islamic republic
-
 Iraq
Iraq
-
 Ireland
-
 Israel
-
 Italy
Italy
-
 Jamaica
-
 Japan
Japan
-
 Jordan
-
 Kazakhstan
-
 Kenya
Kenya
-
 Korea
Korea
-
 Kuwait
-
 Kyrgyzstan
-
 Laos
Laos
-
 Latvia
-
 Lebanon
-
 Lesotho
-
 Libya
Libya
-
 Lithuania
-
 Luxembourg
-
 Madagascar
-
 Malaysia
-
 Malta
Malta
-
 Mauritius
-
 Mexico
-
 Moldova
-
 Mongolia
-
 Montenegro
-
 Morocco
-
 Mozambique
-
 Myanmar
-
 Namibia
-
 Nepal
Nepal
-
 Netherlands
-
 New Zealand
-
 Nigeria
-
 North Macedonia
-
 Norway
-
 Oman
Oman
-
 Pakistan
-
 Palestine
-
 Panama
-
 Papua New Guinea
-
 Paraguay
-
 Peru
Peru
-
 Philippines
-
 Poland
-
 Portugal
-
 Puerto Rico
-
 Qatar
Qatar
-
 Reunion
-
 Romania
-
 Rwanda
-
 Saudi Arabia
-
 Serbia
-
 Singapore
-
 Slovakia
-
 Slovenia
-
 Somalia
-
 South Africa
-
 Spain
Spain
-
 Sri Lanka
-
 Sweden
-
 Switzerland
-
 Syria
Syria
-
 Taiwan
-
 Tajikistan
-
 Tanzania
-
 Thailand
-
 Trinidad and Tobago
-
 Tunisia
-
 Turkey
-
 UAE
UAE
-
 Uganda
-
 Ukraine
-
 United Kingdom
-
United States
-
 Uruguay
-
 Uzbekistan
-
 Venezuela
-
 Vietnam
-
 Yemen
Yemen
-
 Zambia
-
 Zimbabwe
- Forex
- Crypto
