Top 6 Best Free Stock Charting Software Tools & Apps 2026


Editorial Note: While we adhere to strict Editorial Integrity, this post may contain references to products from our partners. Here's an explanation for How We Make Money. None of the data and information on this webpage constitutes investment advice according to our Disclaimer.
The best free charting software in 2026 are:
- Trade Ideas - data analysis using AI for stock market insights
- MetaTrader 4 (MT4) - platform offering advanced trading and analysis tools
- TrendSpider - charts, for traders who anticipate price movements
- BlackBoxStocks - easy to customize with institutional-grade charts and indicators
- TradingView - charting with a vibrant user community
- Thinkorswim - charting program with technical indicators
When it comes to navigating the intricate world of financial markets, having a keen eye on price movements is essential for success. In this comprehensive review to the best free charting software in 2026, the experts at TU delve into the options available to traders, shedding light on their features, advantages, and usability.
What is a free charting software?
A free charting software serves as a valuable tool enabling investors and traders to craft charts and graphs for the purpose of analyzing stock market data. These software applications are readily available at no cost and prove indispensable for tasks like technical analysis, backtesting, and stock forecasting.
To grasp the essence of stock charting, it's essential to understand that it entails visualizing the price movements of a stock over a specific time frame, be it hourly, daily, weekly, monthly, quarterly, or annually, tailored to individual requirements. Day traders often opt for hourly and daily charts to monitor short-term price fluctuations, while long-term investors favor monthly or yearly charts to forecast extended price trends. These charts provide a comprehensive view of price changes, including opening and closing prices, as well as high and low points. Stock charting software helps users to generate diverse chart types and offers an array of technical indicators along with filter options. While most free stock charting software cover time frames such as one-minute, three-minute, five-minute, and fifteen-minute intervals, it's important to note that they often rely on a single data provider, which can lead to data gaps but still proves valuable for informed decision-making by traders.
Best free charting softwares in 2026
Trade Ideas
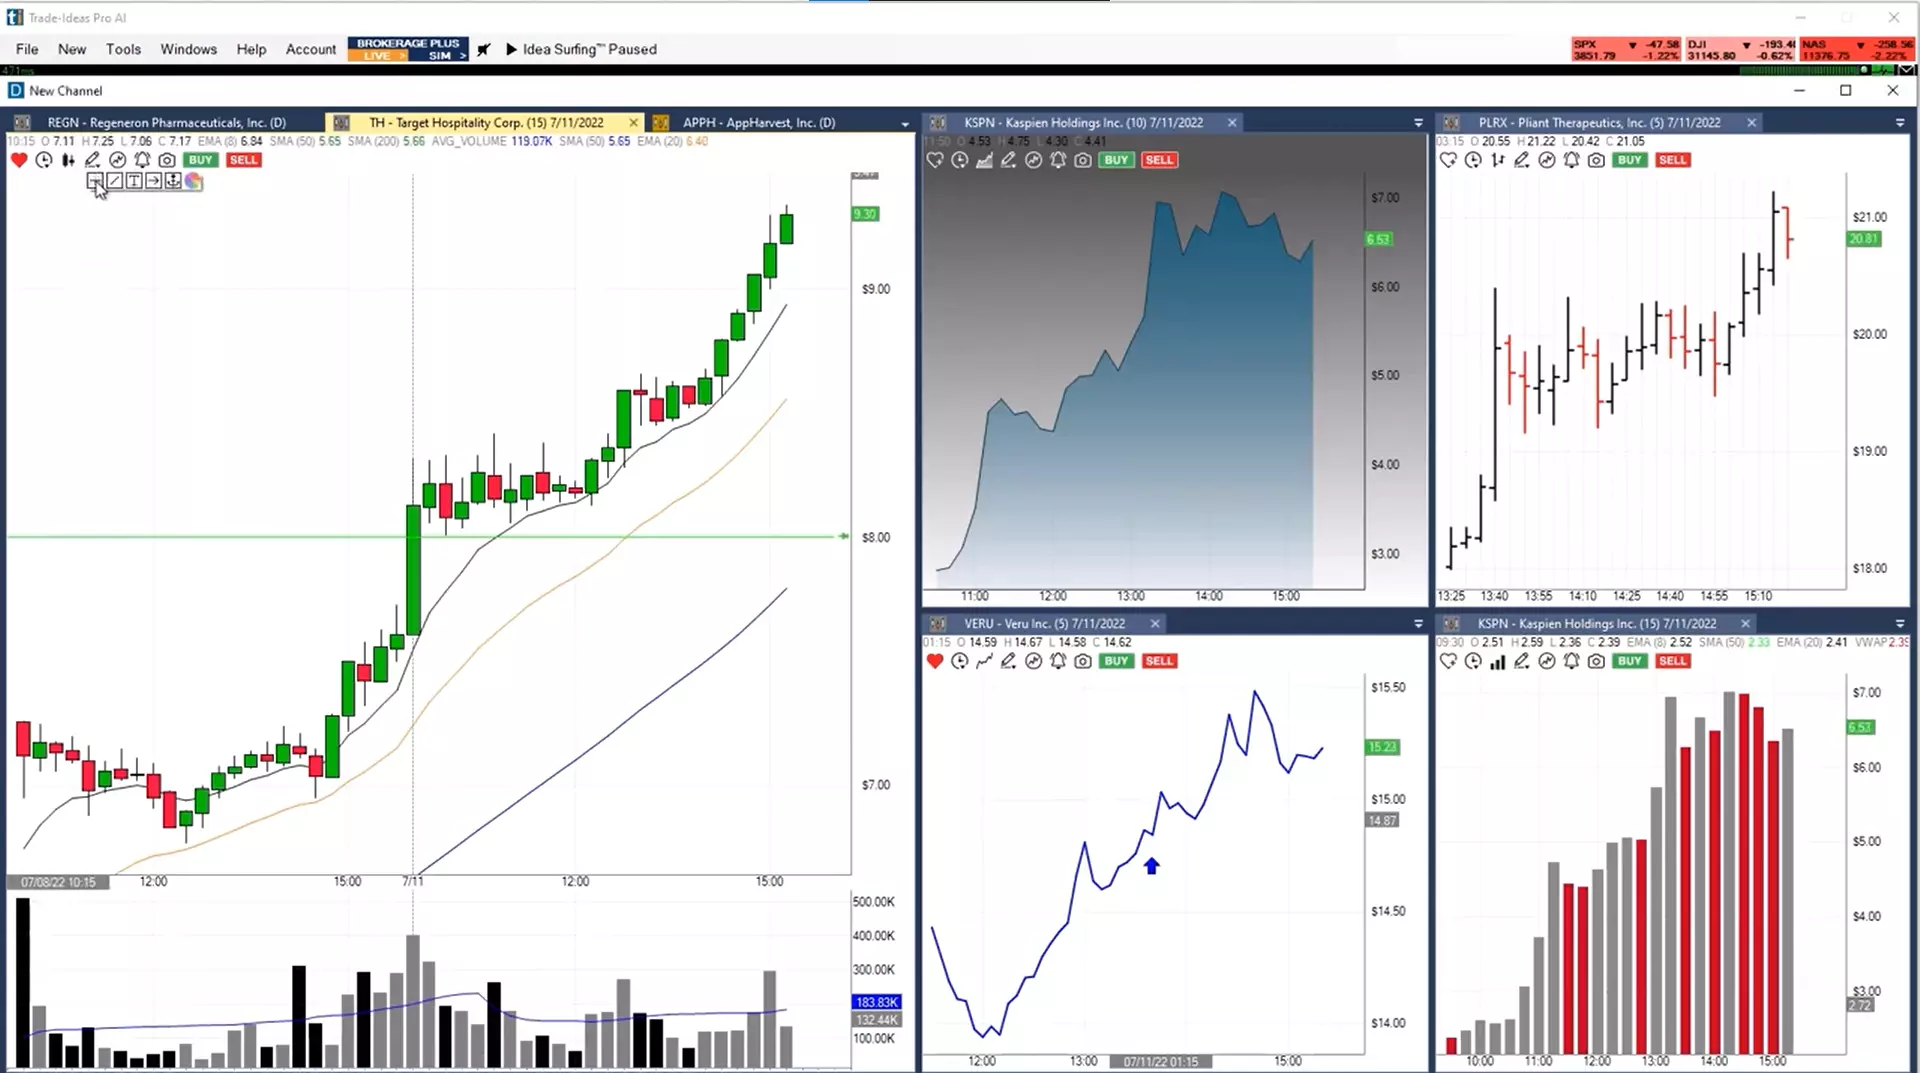 Source: Trade Ideas
Trade Ideas is primarily a stock scanner that has been in the market since 2003. It was initially developed by a group of financial experts known for pioneering automated intraday trading in the 1990s. Today, Trade Ideas is owned by Interactive Brokers, one of the largest U.S. brokers with a significant global presence. Their headquarters are situated in Greenwich, Connecticut. This platform employs cloud technologies, machine learning, and artificial intelligence to analyze stock charts comprehensively. It stands out by alerting users to abnormal price movements based on selected presets.
At the core of Trade Ideas lies its stock scanner, featuring both customizable and pre-built scans. Novices can easily configure a few settings and initiate scans immediately. Examples include the 1-2-3 Patterns and Social Media Stream scans, which offer plug-and-play functionality.
Using Trade Ideas, you can conveniently access your preferred charts directly on the platform and even set price alerts directly on these charts. Moreover, Trade Ideas provides a range of essential indicators to assist in your trading decisions. Trade Ideas also incorporates built-in strategies and stock screeners that can be accessed through the Alert Window. These scans can be used as-is, customized, or created from scratch to suit your trading preferences.
The highlight of Trade Ideas software is undoubtedly its scanner capabilities. Day traders favor Trade Ideas for its exceptional flexibility and power in generating custom alerts for diverse trading strategies. These alerts are color-coded for easy identification. Further refine scan results using criteria like intraday volume, change from close, relative volume, and specific exchanges.
MetaTrader 4 (MT4)
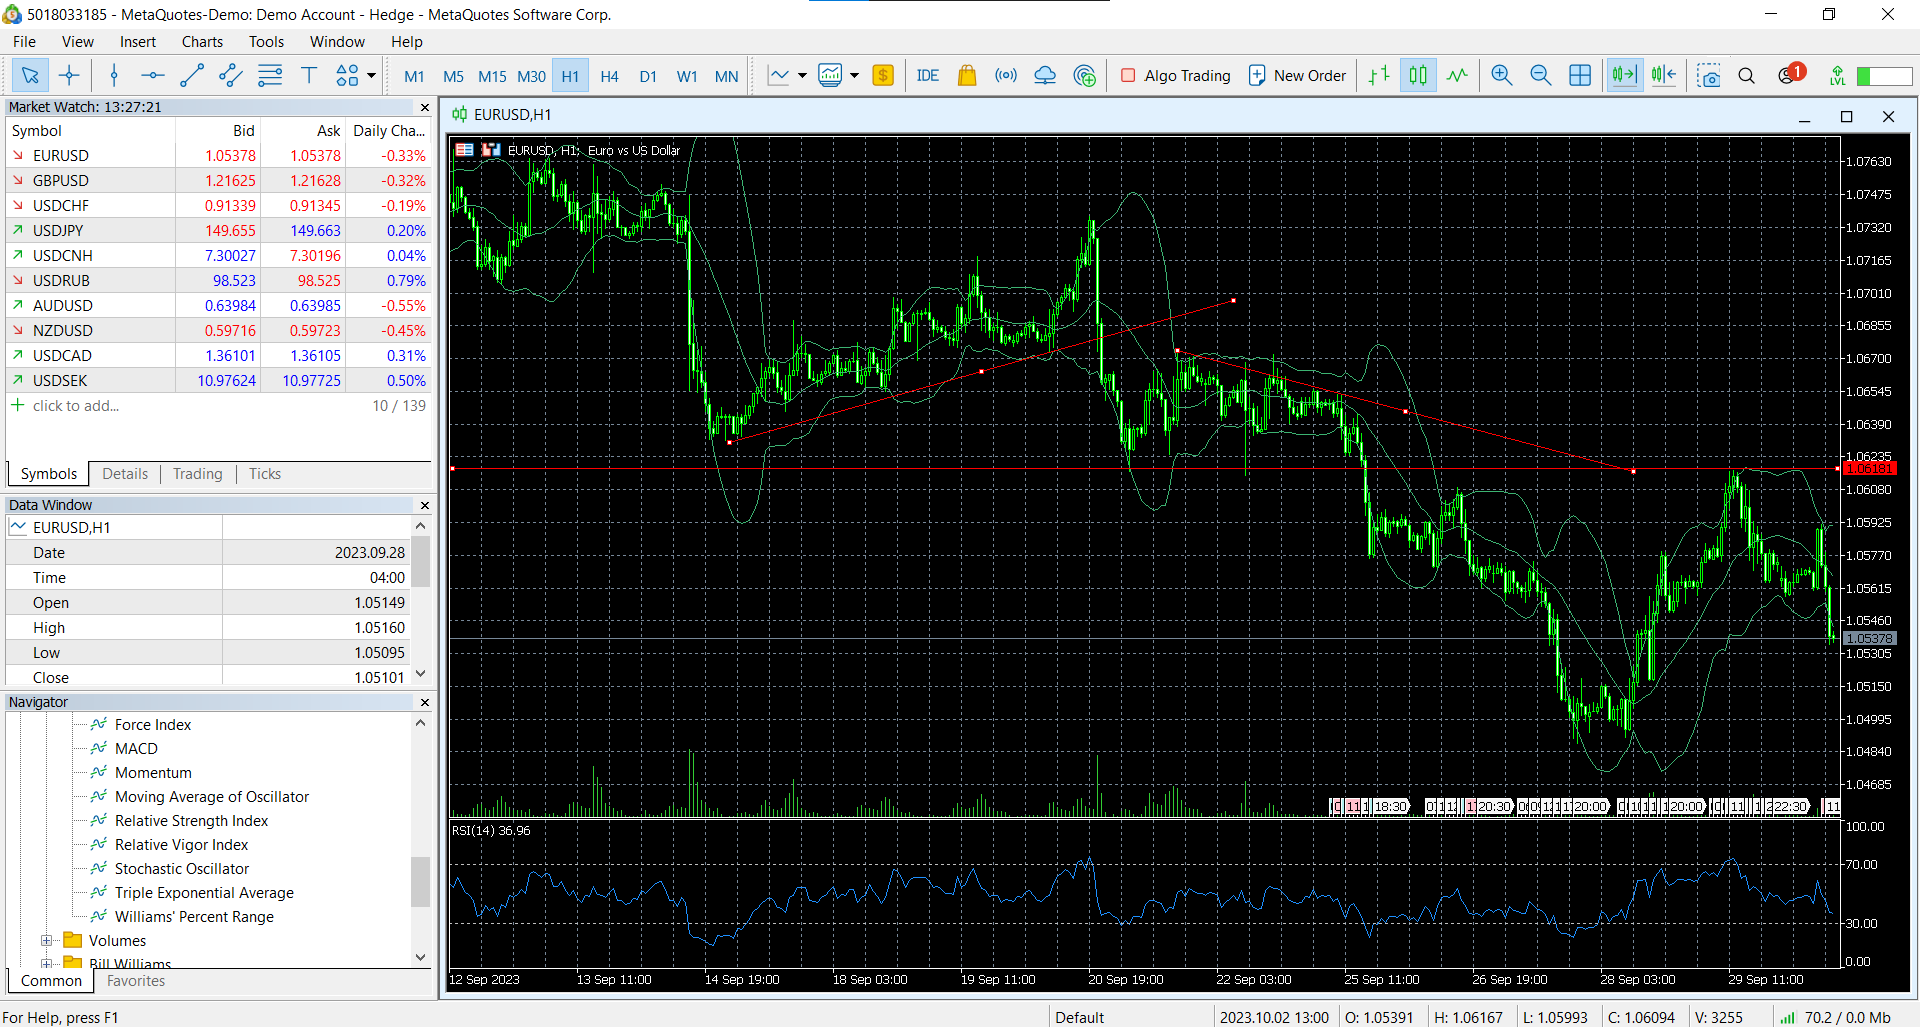
MetaTrader 4 is a versatile trading platform primarily designed for Forex trading but also accommodating various financial instruments like CFDs, commodities, and cryptocurrencies. It offers desktop, web, and mobile versions, supporting over 30 languages, making it accessible to a global audience. MT4 facilitates in-depth market analysis, advanced trading operations, automated trading via robots, and copy trading. It provides traders with three execution modes: instant execution, execution on request, and execution by market. Orders can be market orders executed at current market prices or pending orders committed to buying or selling securities at predefined future prices.
MetaTrader 4 has quick trading options with one-click order execution directly from charts. Its built-in tick feature enhances precision in determining entry and exit points, offering analysis across nine timeframes. The platform comes equipped with 30 built-in technical indicators and 24 graphic objects for comprehensive chart analysis.
For MT4 developers, security is top priority, with data encryption and RSA digital signatures ensuring the protection of trading accounts. The web platform is accessible across browsers and operating systems, offering various trading orders, execution modes, and one-click trading. Real-time quotes are readily available on its charts.
An outstanding feature of MetaTrader 4 is its support for automated trading through custom indicators programmed in its proprietary coding language. The platform's multilingual support and the option to copy successful traders make it adaptable for various markets beyond Forex, including options and futures.
Top 3 MetaTrader Brokers
When trading with MetaTrader, it's best to choose brokers with strong regulation that offer a wide range of additional features, such as free VPS, and provide ECN accounts for cost-effective trading and maximum execution speed.
| zForex | OANDA | FOREX.com | |
|---|---|---|---|
|
MT4 |
No | Yes | Yes |
|
MT5 |
Yes | Yes | Yes |
|
ECN Commission |
7 | 3.5 | 5 |
|
ECN Spread EUR/USD |
0.1 | 0.15 | 0.2 |
|
Regulation |
No | FSC (BVI), ASIC, IIROC, FCA, CFTC, NFA | CIMA, FCA, FSA (Japan), NFA, IIROC, ASIC, CFTC |
|
Open account |
Go to broker Your capital is at risk.
|
Go to broker Your capital is at risk. |
Study review |
TrendSpider
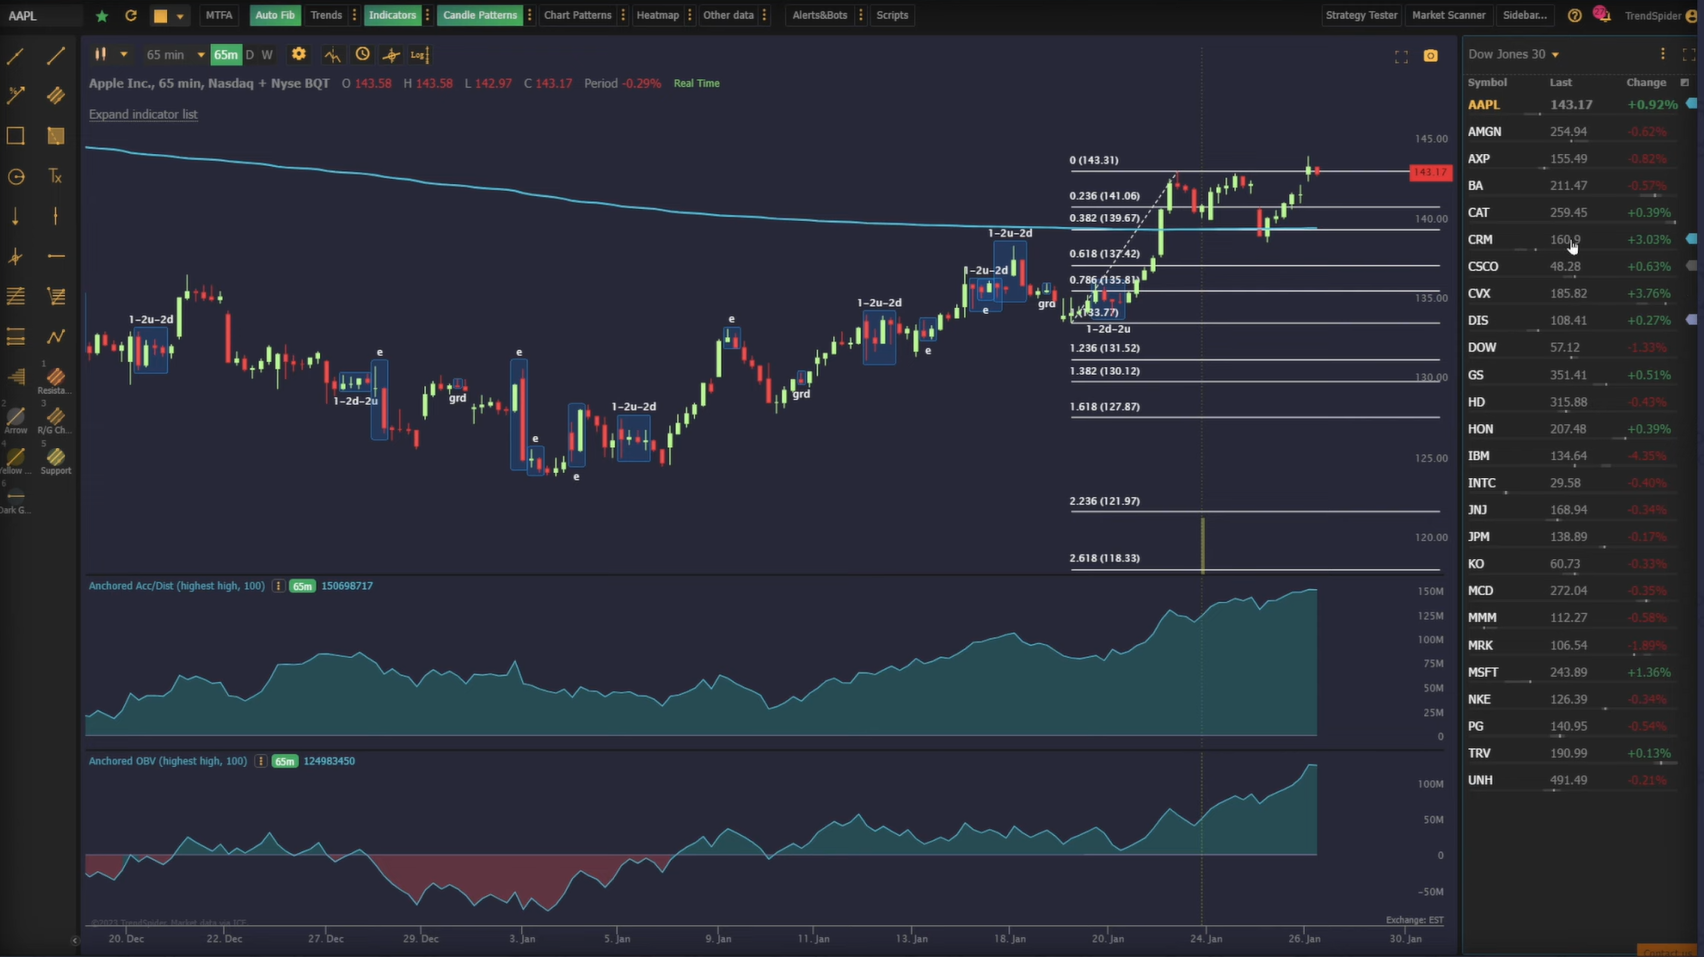 Source: TrendSpider
TrendSpider positions itself as an all-in-one trading solution with a wide range of capabilities. Its web interface provides substantial information, making it ideal for users with ample screen space. While there is a mobile app available, its primary purpose is to complement the web interface by offering basic charts and updated stock watchlists for on-the-go traders.
One of TrendSpider's standout features lies in its robust charting abilities. It offers traditional chart types like line, candlestick, and bar charts, along with innovative options such as Hollow Candles, Heikin Ashi, and Raindrop Charts. The Raindrop Charts, in particular, provide a unique perspective on price movements based on volume-weighted average price (VWAP) data, enhancing analytical depth.
TrendSpider supports the overlay of multiple popular indicators, allowing traders to customize their chart analysis. With automated trendline analysis and heatmap features seamlessly integrated, the platform offers valuable insights into potential support and resistance areas. These tools collectively empower traders to employ technical analysis effectively, not merely to follow trends, but to anticipate and capitalize on them.
BlackBoxStocks
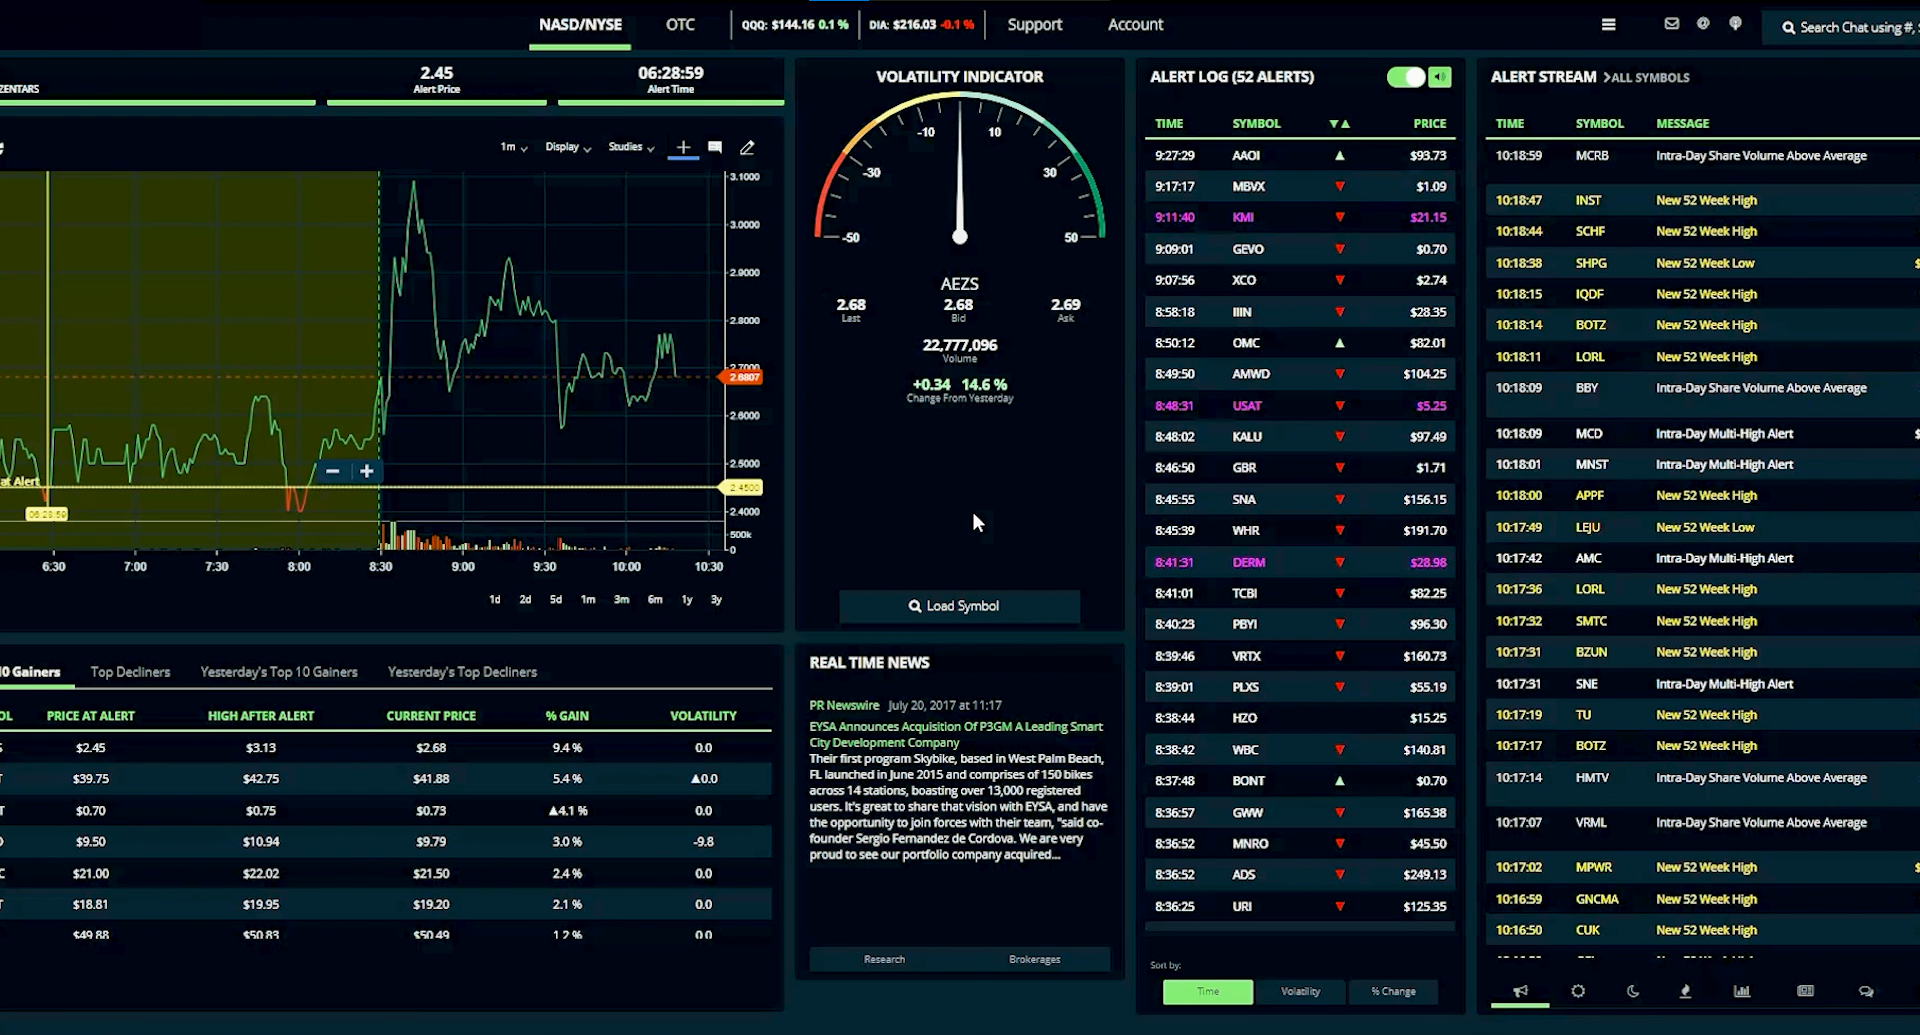 Source: BlackBoxStocks
BlackBoxStocks is a comprehensive stock and options trading platform designed to assist traders in identifying trading opportunities. While some indicators are proprietary, the platform's true strength lies in its convenience. It offers a unified screen displaying everything from charts to options order flow and customizable alerts. Moreover, BlackBoxStocks features an integrated social community to foster trader connections and idea sharing.
The platform offers institutional-grade charts for over 13,000 US and international stocks, including candlestick, line, and bar chart options with the ability to add numerous technical studies. Users can even display multiple charts in a single window, a valuable feature for real-time monitoring of multiple setups.
In addition to standard indicators, BlackBoxStocks includes proprietary indicators such as dark pool volume, options dollar flow, and gamma exposure. Charts for stocks triggering alerts are annotated to show their trading position at the time of the alert, enhancing the user's ability to follow evolving setups.
BlackBoxStocks also has a dark pool scanner that highlights large off-exchange trades, often associated with institutional investors. This scanner provides insights into smart money movements. The feed displays trade details, including ticker, price, and volume, with the ability to filter by ticker or trade size.
TradingView
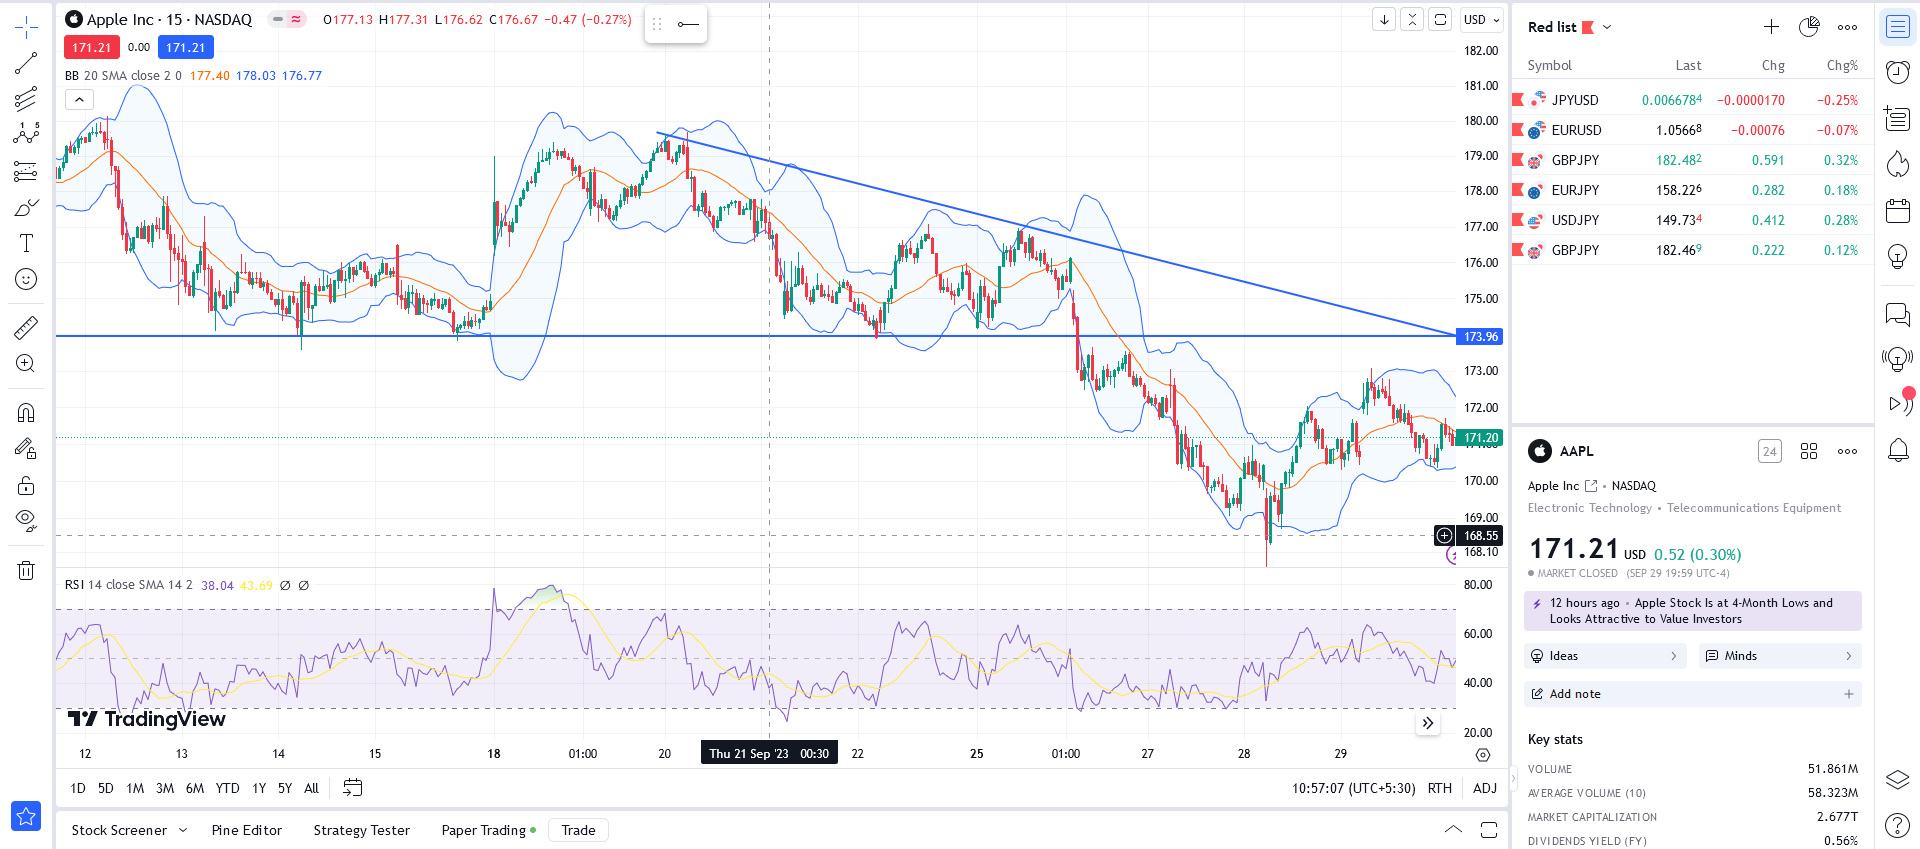
TradingView stands out as a top choice for free stock charting software, supported by a thriving social community. While users can opt for the pro version at a reasonable $10 per month, it offers a free version that might just do the work for beginners.
The platform provides access to extensive market data, covering a wide range of financial instruments, including stocks, ETFs, futures, mutual funds, bonds, and cryptocurrencies, all at no cost. Notable features include real-time scanning and filtering, fundamental watchlists, economic indicators, a vibrant community with chat rooms and essay sharing, as well as a comprehensive news feed from industry leaders.
TradingView has an impressive array of technical analysis tools, surpassing many competitors. It offers 14 chart types, over 20 timeframes, 90+ drawing tools, and a library of 100+ pre-built indicators. A unique feature is its ability to chart fundamental data from income statements, balance sheets, cash flow metrics, and statistics, offering traders valuable insights into how fundamentals impact stock price movements.
The platform's immense, global community enhances the experience with live video streaming, chat, and a repository of over 100,000 community-built indicators, enriching traders with additional tools and charting ideas.
Top 3 TradingView Brokers
Some brokers offer TradingView integration as an additional trading platform, allowing you to trade directly from the charts, which enhances the trading experience.
| zForex | Plus500 | OANDA | |
|---|---|---|---|
|
TradingView |
No | Yes | Yes |
|
ECN Commission |
7 | No | 3.5 |
|
ECN Spread EUR/USD |
0.1 | No | 0.15 |
|
Regulation |
No | CySEC, FCA, ASIC, FMA, FSCA, FSA Seychelles, EFSA, MAS, DFSA, SCB | FSC (BVI), ASIC, IIROC, FCA, CFTC, NFA |
|
Open account |
Go to broker Your capital is at risk.
|
Go to broker 80% of retail CFD accounts lose money. |
Go to broker Your capital is at risk. |
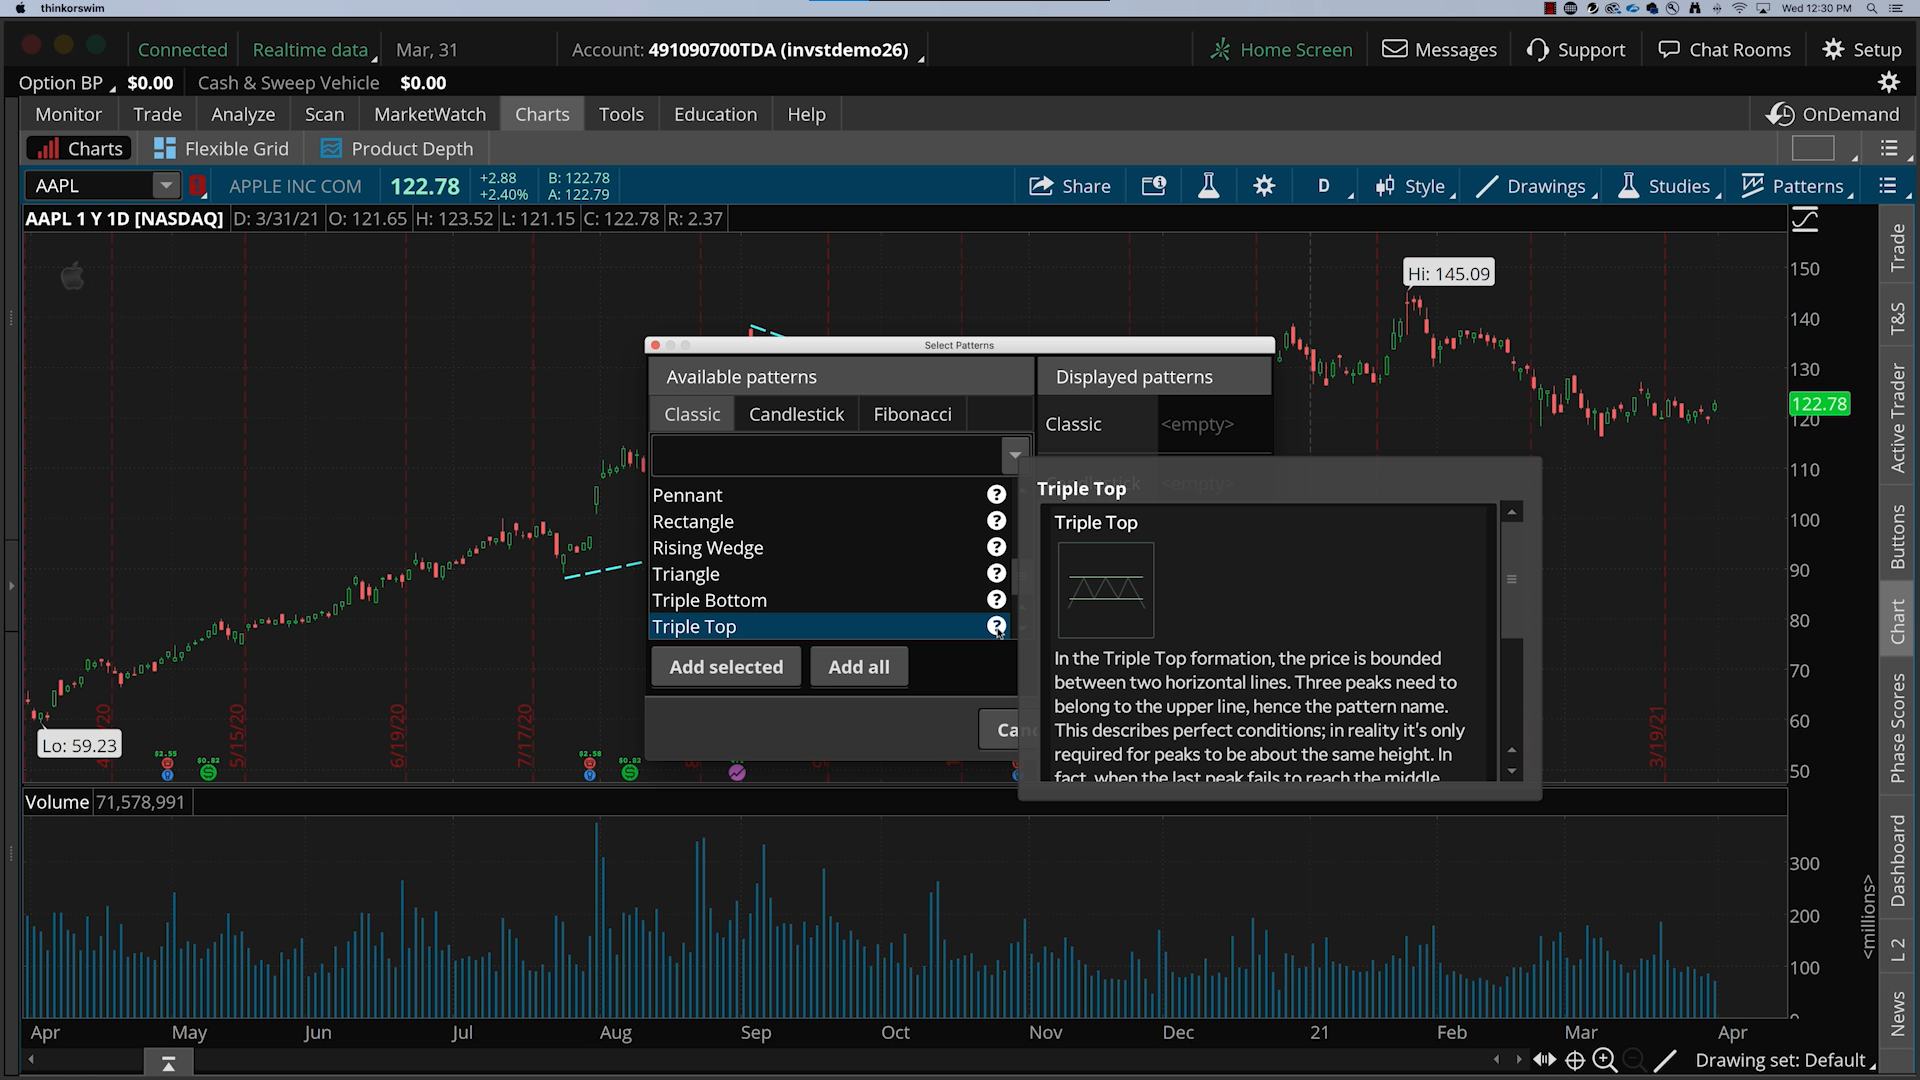
Thinkorswim
 Source: Thinkorswim
Thinkorswim, offered by TD Ameritrade (now part of Schwab), is a comprehensive investment platform tailored for serious investors. It complements TD Ameritrade's core retail platform with advanced features designed to cater to experienced traders.
Thinkorswim supports a wide range of asset classes, including stocks, ETFs, mutual funds, bonds, futures, foreign exchange, and even micro cryptocurrency futures. The platform's charting capabilities are particularly robust, offering an extensive collection of several hundred technical indicators, setting it apart from competitors. Notable indicators include SVE Pivots, TTM Squeeze, Breakaway, Disparity Index, and Morning Doji Star. Drawing tools like trendlines, Fibonacci retracements, regression lines, and cycle brackets further enhance its charting prowess.
Users can customize charts extensively, from color schemes to scaling options and even company event overlays. A standout feature is the right-click menu on charts, providing convenient access to alerts and order placement. Thinkorswim's charting program helps traders with technical analysis tools and customization options, making it a good choice for serious investors.
Why is charting software needed?
Charting software plays a crucial role in the world of trading for several reasons:
Real-time data and technical analysis
Charting software serve as a gateway to real-time market data and sophisticated technical analysis. They equip traders with the tools they need to seize opportunities swiftly. By offering a real-time view of market conditions, they help traders to make informed decisions based on price movements, indicators, and patterns.
Trade monitoring
Traders rely on charting software to keep a watchful eye on their investments. These software provides a comprehensive overview of a stock's performance, allowing investors to spot potential profit opportunities. By incorporating a range of indicators and data points into the charts, traders can identify critical support and resistance levels, aiding them in making well-timed entry and exit decisions.
Visualization of complex data sets
Charting software excel in simplifying complex data sets. They’re an important tool for traders, as they help them uncover patterns and insights within market data. With the ability to visualize extensive data points, traders can swiftly recognize trends and evaluate potential trading opportunities. This capability translates into faster decision-making and increased trading confidence.
Pattern recognition
The ability of charting software to detect chart patterns such as head and shoulders, double tops, and flags is an undeniable advantage. Recognizing these patterns can assist traders in making predictions about future price movements, enhancing their overall trading strategies.
Risk management
Effective risk management is paramount in trading. Charting software aid traders in setting stop-loss orders and profit targets. It enables them to visualize potential reward-to-risk ratios, helping make calculated decisions that align with their risk tolerance.
Historical analysis
Traders often review historical price data to gain insights into how a particular asset has performed over time. Charting software allow users to access and analyze historical data, aiding in the development of trading strategies based on past trends.
Customization
Generally, charting software are highly customizable, allowing traders to tailor charts and indicators to their specific preferences and trading styles. This flexibility ensures that traders can work with a tool that aligns with their unique needs and strategies.
Benefits of using free charting software
Utilizing free charting software offers a multitude of advantages for traders and investors, enhancing their trading experiences in several ways:
Tailored customization
Free charting software provide users with the flexibility to customize their charts according to their preferences. This includes choosing from various chart types like candlestick, line, or bar charts. Additionally, these tools often offer a wide array of technical indicators, such as MACD and RSI, which can be applied to identify potential trading opportunities. This level of customization helps traders to fine-tune their charts to align precisely with their unique needs and trading strategies.
Cost-effective solution
Free charting software are a budget-friendly alternative for traders and investors, particularly those who are just embarking on their trading journeys or prefer not to invest in expensive charting software. Despite being cost-free, many of these platforms offer robust features and tools that facilitate well-informed decision-making, ensuring that traders can navigate financial markets without incurring substantial expenses.
In-depth analysis
Free charting software equip traders and investors with the tools needed to identify market trends and make informed predictions regarding future stock performance. By integrating diverse indicators and data points into their charts, users can pinpoint crucial support and resistance levels. This analytical capability helps traders to make strategic decisions about when to enter or exit positions, increasing their likelihood of achieving success in the market.
User-friendly interfaces
These platforms typically feature user-friendly interfaces, making them accessible to traders of all experience levels. Whether you're a novice or a seasoned trader, most free charting software are designed to accommodate various skill levels.
Community and support
Many free charting software platforms foster vibrant user communities and offer support resources. Traders can engage with peers, share insights, and seek assistance when needed, creating a collaborative environment for learning and growth.
How to select the best free charting software?
When it comes to selecting the best free charting software, making an informed choice involves considering several crucial factors:
Comprehensive features
Prioritize charting software that provides the specific features you require. Whether it's real-time data, a variety of technical indicators, or customization options, ensure that the software aligns with your trading needs. Some platforms even offer advanced features like backtesting and forecasting, which can be advantageous for seasoned traders.
User-friendly interface
Opt for charting software that has an intuitive and user-friendly interface. Even if you're a seasoned trader, the software should be easy to navigate for hassle-free execution. An intuitive design ensures a smoother learning curve and efficient use of the tool.
Device and OS compatibility
Verify that the charting software is compatible with your device and operating system. Compatibility issues can hinder your trading experience, so ensure that the software is available for your specific setup. Some charting tools may be restricted to certain devices or operating systems.
Community reviews
See the insights of fellow traders and investors by exploring reviews of the charting software. These reviews provide valuable information about the software's strengths and weaknesses. Pay particular attention to aspects like ease of use, available features, and overall performance. This firsthand feedback can guide your decision.
Cost considerations
While the basic features in most charting software are free, be aware that some platforms may offer additional features or services at a cost. Evaluate whether these supplementary features align with your trading requirements and whether they fit comfortably within your budget.
Reliable data sources
Ensure that the charting software relies on reputable and reliable data sources. Accurate and up-to-date data is essential for making informed trading decisions. Confirm that the software's data feeds are trustworthy and capable of providing real-time information.
Customer support
Check if the charting software offers adequate customer support. In case you encounter technical issues or have inquiries, accessible customer support can be invaluable. Reliable support channels, such as email or live chat, ensure that you can seek assistance when needed.
Community and resources
Some charting software options foster vibrant user communities and provide additional resources like tutorials, webinars, and forums. These resources can be immensely beneficial for learning, troubleshooting, and staying updated on market trends.
Security measures
Prioritize charting software that upholds robust security measures. Your financial data and trading activities must be safeguarded from potential threats. Look for features like data encryption and two-factor authentication to enhance your online security.
Tips to keep in mind while using free charting software
When using free charting software, consider the following expert tips to make the most of your trading experience:
Design well-organized charts
Craft well-organized stock charts by thoughtfully selecting colors, fonts, layouts, indicators, and overlays. Clarity and simplicity are key. Creating clean, easily readable charts enhances your ability to grasp market dynamics and make informed decisions.
Understand software features
Familiarize yourself with the features offered by your chosen charting software. Some packages come with additional costs, so it's essential to comprehend any associated expenses, including subscription fees or premium features. While some software is entirely free, others may require payments for specific functionalities or access to premium data.
Know your support options
Prior to investing in any charting software, explore the available support options. Determine whether the software provides customer support, tutorials, or additional resources to aid in your onboarding process and address any potential issues. Adequate support ensures a smoother user experience.
Choose the right chart type
Different types of charts are tailored to analyze distinct data sets. For instance, candlestick charts excel in revealing price fluctuations over time, whereas line charts are ideal for depicting trends. Select the appropriate chart type that aligns with the data you intend to analyze.
Сombinе two or three charting solutions for better results

From my own trading experience, free charting software is rarely about finding a single “best” platform – it’s about choosing the right tool for a specific task. Over the years, I’ve found that combining two or three charting solutions often delivers better results than relying on just one.
For example, when I actively trade short-term market movements, I tend to use platforms with strong real-time scanning and alert systems. Tools like Trade Ideas have helped me spot momentum shifts early, especially during volatile market sessions, when manual chart monitoring simply isn’t fast enough. In contrast, for more structured technical analysis and strategy testing, I prefer environments where I can fully customize indicators and timeframes, such as MetaTrader or TradingView.
Another lesson I’ve learned is that simplicity often matters more than feature overload. Early in my career, I spent too much time experimenting with dozens of indicators, which led to conflicting signals and hesitation. Today, I focus on a limited set of tools and use charting software primarily to confirm ideas, not to generate them from scratch. Platforms with clean interfaces and flexible layouts make this process far more efficient.
I also recommend paying attention to how charting software fits into your broader trading workflow. For instance, if you trade directly from charts, integration with a broker or fast execution tools can be more important than advanced visualization. On the other hand, if your approach is research-driven, community-driven platforms like TradingView can add value through shared ideas and alternative market perspectives.
Ultimately, the best free charting software is the one that supports disciplined decision-making rather than constant experimentation. My advice is to test several platforms in parallel, identify where each one adds real value, and then narrow your toolkit to what genuinely improves consistency and risk control.
Conclusion
Editors' Top Picks and Insights

Do politicians make the best stock traders?

Crypto test drive: How automakers are exploring digital assets

Lindsey Graham death: U.S. senator’s crypto legacy

Tether under pressure: USDT in Europe, audit questions, and the fight for trust

Lean Ethereum: Why Buterin wants to rebuild the network

SK Hynix debuts on Nasdaq: Largest U.S. offering by foreign company
Related Articles
Team that worked on the article
Alamin Morshed is a contributor at Traders Union. He specializes in writing articles for businesses that want to improve their Google search rankings to compete with their competition.
Chinmay Soni is a financial analyst with more than 5 years of experience in working with stocks, Forex, derivatives, and other assets. As a founder of a boutique research firm and an active researcher, he covers various industries and fields, providing insights backed by statistical data.
Mirjan Hipolito is a journalist and news editor at Traders Union. She is an expert crypto writer with five years of experience in the financial markets.
Index in trading is the measure of the performance of a group of stocks, which can include the assets and securities in it.
An ECN, or Electronic Communication Network, is a technology that connects traders directly to market participants, facilitating transparent and direct access to financial markets.
Forex trading, short for foreign exchange trading, is the practice of buying and selling currencies in the global foreign exchange market with the aim of profiting from fluctuations in exchange rates. Traders speculate on whether one currency will rise or fall in value relative to another currency and make trading decisions accordingly. However, beware that trading carries risks, and you can lose your whole capital.
Bitcoin is a decentralized digital cryptocurrency that was created in 2009 by an anonymous individual or group using the pseudonym Satoshi Nakamoto. It operates on a technology called blockchain, which is a distributed ledger that records all transactions across a network of computers.
Risk management in Forex involves strategies and techniques used by traders to minimize potential losses while trading currencies, such as setting stop-loss orders and position sizing, to protect their capital from adverse market movements.

-
 Afghanistan
-
 Albania
-
 Algeria
-
 Angola
-
 Argentina
-
 Armenia
-
 Australia
-
 Austria
-
 Azerbaijan
-
 Bahamas
-
 Bahrain
-
 Bangladesh
-
 Belarus
-
 Belgium
-
 Bolivia
-
 Botswana
-
 Brazil
-
 Brunei
-
 Bulgaria
-
 Cambodia
-
 Cameroon
-
 Canada
-
 Chile
Chile
-
 China
China
-
 Colombia
-
 Congo
Congo
-
 Costa Rica
-
 Cote d'Ivoire
-
 Croatia
-
 Cuba
Cuba
-
 Cyprus
-
 Czechia
-
 DR Congo
-
 Denmark
-
 Dominican Republic
-
 Ecuador
-
 Egypt
Egypt
-
 El Salvador
-
 Estonia
-
 Eswatini
-
 Ethiopia
-
 Finland
-
 France
-
 Georgia
-
 Germany
-
 Ghana
Ghana
-
 Greece
-
 Haiti
Haiti
-
 Hong Kong
-
 Hungary
-
 India
India
-
 Indonesia
-
 Iran, Islamic republic
-
 Iraq
Iraq
-
 Ireland
-
 Israel
-
 Italy
Italy
-
 Jamaica
-
 Japan
Japan
-
 Jordan
-
 Kazakhstan
-
 Kenya
Kenya
-
 Korea
Korea
-
 Kuwait
-
 Kyrgyzstan
-
 Laos
Laos
-
 Latvia
-
 Lebanon
-
 Lesotho
-
 Libya
Libya
-
 Lithuania
-
 Luxembourg
-
 Madagascar
-
 Malaysia
-
 Malta
Malta
-
 Mauritius
-
 Mexico
-
 Moldova
-
 Mongolia
-
 Montenegro
-
 Morocco
-
 Mozambique
-
 Myanmar
-
 Namibia
-
 Nepal
Nepal
-
 Netherlands
-
 New Zealand
-
 Nigeria
-
 North Macedonia
-
 Norway
-
 Oman
Oman
-
 Pakistan
-
 Palestine
-
 Panama
-
 Papua New Guinea
-
 Paraguay
-
 Peru
Peru
-
 Philippines
-
 Poland
-
 Portugal
-
 Puerto Rico
-
 Qatar
Qatar
-
 Reunion
-
 Romania
-
 Rwanda
-
 Saudi Arabia
-
 Serbia
-
 Singapore
-
 Slovakia
-
 Slovenia
-
 Somalia
-
 South Africa
-
 Spain
Spain
-
 Sri Lanka
-
 Sweden
-
 Switzerland
-
 Syria
Syria
-
 Taiwan
-
 Tajikistan
-
 Tanzania
-
 Thailand
-
 Trinidad and Tobago
-
 Tunisia
-
 Turkey
-
 UAE
UAE
-
 Uganda
-
 Ukraine
-
 United Kingdom
-
United States
-
 Uruguay
-
 Uzbekistan
-
 Venezuela
-
 Vietnam
-
 Yemen
Yemen
-
 Zambia
-
 Zimbabwe
- Forex
- Crypto
