VWAP Indicator In MT4: Setup And Application


Editorial Note: While we adhere to strict Editorial Integrity, this post may contain references to products from our partners. Here's an explanation for How We Make Money. None of the data and information on this webpage constitutes investment advice according to our Disclaimer.
How to use VWAP indicator in MT4:
In Forex trading, indicators are valuable technical analysis tools that show how the market is moving and allow you to more accurately time your entry and exit. The point is that when using indicators, you should know and understand how they work and what they are telling you. This way, you will be able to interpret their signals better. Let's take a closer look at the Volume Weighted Average Price (VWAP) indicator in MT4. You will learn how it works, how to calculate the VWAP value and, more importantly, how to use the VWAP indicator.
How to use VWAP indicator in MT4
The Volume-Weighted Average Price (VWAP) indicator is a technical analysis tool that calculates the average price of a security over a specific time, weighted by trading volume. It provides a more accurate reflection of market sentiment compared to simple moving averages, as it considers both price and trading activity.
The VWAP (Volume Weighted Average Price) indicator is a powerful tool for analyzing intraday price trends, helping traders identify the average price at which an asset has traded throughout the day based on both price and volume. Here's how to use the VWAP indicator in MT4:
Step 1. Download the VWAP indicator
Search for a VWAP indicator compatible with MT4. Popular sources include the MQL5 marketplace or trusted Forex websites offering free or paid versions

Step 2. Install the indicator
Place the downloaded file into the “Indicators” folder within the MT4 data directory. Restart MT4 and find the VWAP under “Navigator” > “Custom Indicators”. Drag it onto your chart.
Step 3. Configure the settings
VWAP often includes adjustable parameters like timeframes (daily, weekly, monthly) and standard deviation bands. Customize these settings to fit your trading strategy.
Step 4. Interpret the indicator
Trend analysis. When the price is above the VWAP line, it indicates a bullish trend, while prices below suggest a bearish trend.
Entry and exit points. Use the VWAP line as dynamic support or resistance. Breaks above or below the VWAP can signal potential trading opportunities.
Step 5. Combine with other tools
Enhance the effectiveness of VWAP by pairing it with additional indicators like RSI or Moving Averages for confirmation of trends.
How to calculate VWAP?
Fortunately, by adding the VWAP indicator to a chart, you won’t need to calculate it yourself. However, it is important to understand how the indicator works, and here, knowing how to calculate it is valuable.
To calculate the volume-weighted-average-price of a security, you’ll need to multiply the price the security traded at for a specific period by the volume that was traded and then divide that number by the total volume traded.
To illustrate the concept better, let’s look at a simple example:
Let’s assume you’re looking at the 1-hour price chart for a specific security. Based on the formula above, you’ll then need to calculate the price of the security for the first 1-hour period. To do this, you’ll add the high, low, and closing prices for the period and then divide by 3.
You’ll then multiply this number by the volume traded to arrive at a figure we’ll call the PV number. You’ll then divide the PV number by the total volume to arrive at the VWAP. This means, for the first period, the VWAP will basically be the average price the security traded for.
For the following periods you’ll do the same. In other words, you’ll calculate the average price for the security for the period and then multiply it by the volume for the period. You’ll then add this number to the previous PV numbers you calculated to arrive at a cumulative value.
Once calculated, you’ll divide this by the total volume. In other words, you’ll divide the figure by the total volume for all periods. This will allow you to calculate the VWAP over time.
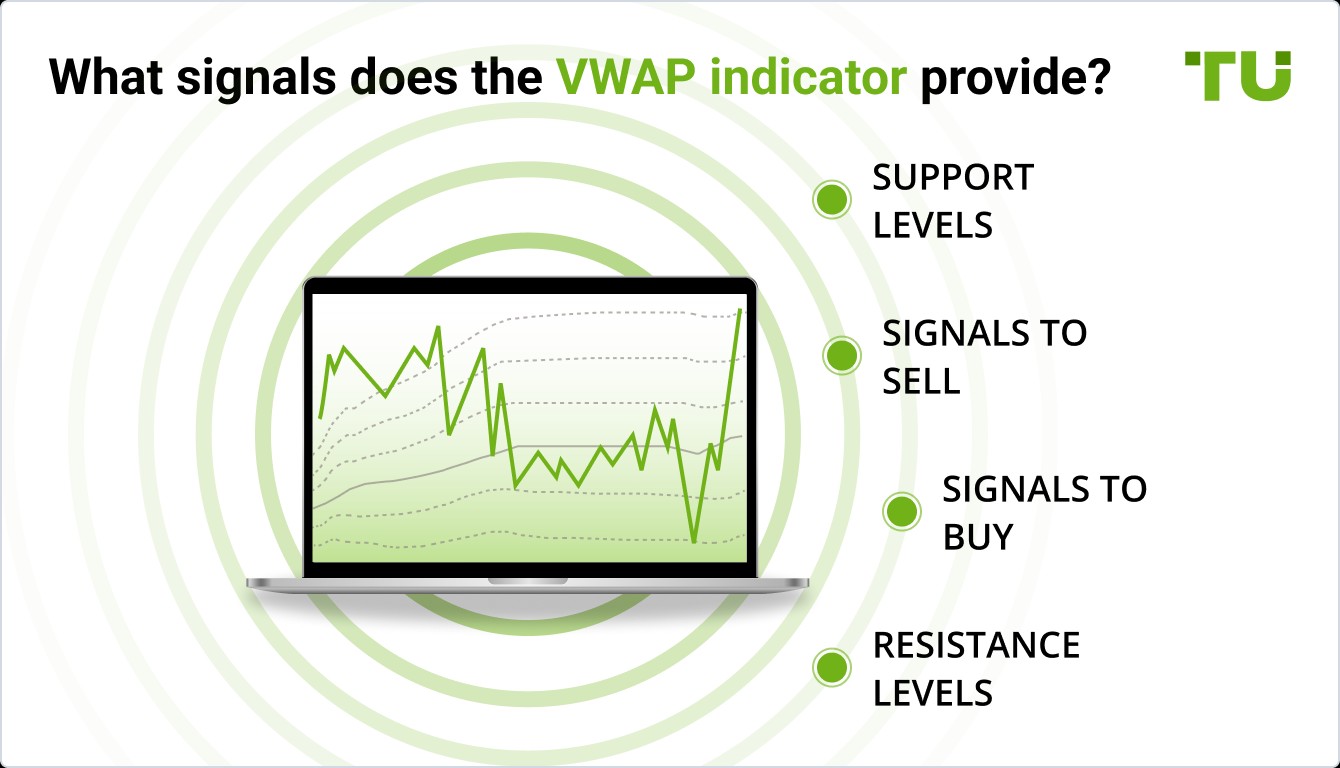
VWAP signals
Now that we’ve looked at what the VWAP indicator is and how its value is calculated, let’s look at some simple signals that you can use when using the VWAP when trading. Keep in mind, though, that these are just some simple examples and there are many other strategies where you can use the VWAP indicator.
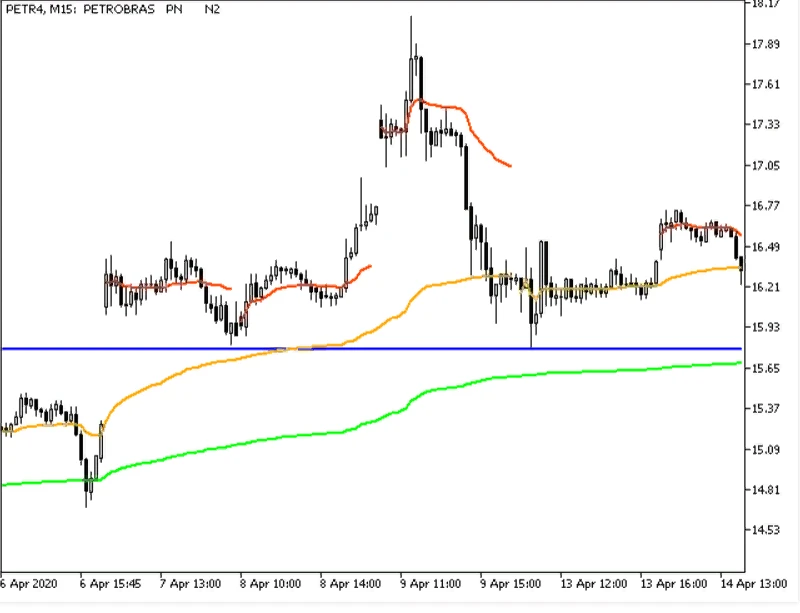
Buy signals
At its most basic, if the current price of a security is below the VWAP line, you can consider it to trade at below value which would mean that it’s a buy signal. Other traders prefer to use two VWAP indicators and then look for crossovers to signal a buy.
For instance, let’s say you use an 8-period VWAP and a 20-period VWAP. When the 5-period line crosses the 8-period line from below, this would be a buy signal.
Sell signals
For sell signals, you’ll reverse the above. So, if the current price of a security is above the VWAP line, it could mean that that the security is trading at a premium which would then be a sell signal.
Likewise, if we once again use two VWAP indicators with different timeframes, the sell signal would occur when the line with the lowest value crosses the line with the highest value from above. So, if you’re using an 8-period VWAP and a 20-period VWAP, the sell signal would be when the 8-period line crosses the 20-period line from above.
Support and resistance signals
The VWAP line can be a strong indicator of support and resistance. So, if the price hovers below the VWAP line but doesn’t break it for several periods, it could indicate resistance. Likewise, if the price stays just above the VWAP line and doesn’t go below, it could indicate that the price has found support.
How to use the VWAP indicator in your strategy?
There are several ways in which you can use the VWAP indicator in your trading strategy. You can, for instance, use it by itself to give you buy and sell signals as described above. Here, another example would be when the price of the security goes far beyond the VWAP on either side.
This could mean that the security is either overbought or oversold which, in turn, could signal a reversal. For example, if the price is way above the VWAP line, it could be overbought, and that traders might start going short. The opposite is true if the price goes far below the VWAP line. Here, it could signal that traders might go long.
Another possibility is using the VWAP indicator alongside other indicators to give more precise and accurate signals. A perfect example of this is where you’ll use the VWAP indicator with the MACD indicator. In this case, you’ll then get confirmation of any buying or selling signals described above.

VWAP in institutional trading
Here are some ways that large institutional investors and traders use VWAP:
Benchmark for execution performance. Large trades are often broken into many smaller child orders to be executed over the course of the day. VWAP provides a key benchmark for how close the average execution price of those child orders came to the volume-weighted average price for the full trading session. Coming close to VWAP is seen as a good execution that minimizes market impact.
Order type for algorithmic trading. Some advanced algorithmic trading systems are specially programmed to target the execution of orders as close to the VWAP as possible for the current day. This aims to systematically buy and sell portions of the overall order over the course of the day at a price level equal to the volume-weighted average. Getting good VWAP execution can help improve fill rates and minimize costs.
Benchmark for block trades. Extremely large block trades are often priced at a slight discount or premium to VWAP depending on whether the order is buying or selling pressure. VWAP serves as a transparent reference price point for negotiating and valuing these substantial transactions that involve millions of dollars of capital
Performance measurement over time. Institutional traders may track their VWAP execution performance over weeks or months to ensure their usage of various order types and trading algorithms remains optimized. Consistently beating average VWAP levels can provide an edge and improve returns over the long run.
So in summary, VWAP is a crucial benchmark that institutional investors reference at multiple levels to gauge trading results, fine-tune algorithms, value block trades, and enhance overall performance over extended time periods.
Best MT4 brokers
To maximize the effectiveness of the VWAP strategy on MetaTrader 4 (MT4), selecting the right broker is crucial. A reliable broker ensures smooth execution, minimal spreads, and access to robust trading features compatible with VWAP-based strategies.
We have curated a list of the best MT4 brokers offering optimal conditions for using the VWAP indicator. These brokers provide fast order execution, competitive spreads, and flexible trading options, making them ideal for traders using advanced strategies like VWAP.
| OANDA | FOREX.com | IG Markets | XPro Markets | iBroker | |
|---|---|---|---|---|---|
|
MT4 |
Yes | Yes | Yes | Yes | Yes |
|
Currency pairs |
68 | 80 | 80 | 50 | 120 |
|
Min. deposit, $ |
No | 100 | 1 | 250 | 1 |
|
Max. leverage |
1:200 | 1:50 | 1:200 | 1:400 | 1:30 |
|
Standard EUR/USD spread |
0.3 | 1.0 | 0.9 | 0.5 | 0.2 |
|
Investor protection |
£85,000 SGD 75,000 $500,000 | £85,000 | £85,000 €100,000 SGD 75,000 | €20,000 | €100,000 (ES) |
|
Regulation level |
Tier-1 | Tier-1 | Tier-1 | Tier-1 | Tier-1 |
|
Open an account |
Go to broker Your capital is at risk. |
Study review | Study review | Study review | Study review |
Combine VWAP with price action signals

To enhance the effectiveness of VWAP in MT4, combine VWAP with price action signals rather than relying solely on the indicator. Use VWAP as a reference point for trend confirmation and execute trades when candlestick patterns like engulfing candles or pin bars form near the VWAP line. This increases the probability of accurate entries by aligning both technical and market sentiment signals. Additionally, adjust the VWAP calculation period based on market volatility. During high-volatility periods like news releases, shorten the VWAP timeframe to capture more dynamic price shifts. In contrast, extend it in stable markets to filter out noise.
Another powerful technique is to apply VWAP in a multi-timeframe analysis. Use a higher timeframe (such as H4 or Daily) to identify long-term VWAP trend direction, while deploying a lower timeframe (such as M15) to pinpoint entry points during pullbacks. This dual perspective reduces false signals and improves trade accuracy. Additionally, watch for VWAP deviation bands to spot overbought or oversold conditions. When prices deviate significantly from VWAP, consider mean-reversion strategies or continuation patterns depending on market momentum. These tailored techniques help traders unlock VWAP’s full potential on MT4.
Conclusion
Mastering the use of the VWAP indicator in MT4 empowers traders to pinpoint meaningful support and resistance levels, enhancing decision-making in dynamic Forex markets. By accurately calculating and interpreting VWAP, traders can filter out market noise and identify genuine price trends, leading to more consistent trading outcomes. For example, employing VWAP to confirm breakout trades or to validate mean-reversion strategies can significantly increase success rates. Ultimately, integrating VWAP into your MT4 trading toolkit is a game-changer—transforming raw market data into actionable signals and giving you the edge to trade with greater confidence and precision.
FAQs
How does VWAP differ from simple moving averages when applied in MT4?
Can VWAP be used for mean-reversion strategies in MT4?
What role does VWAP play in algorithmic trading on MT4?
How can multi-timeframe analysis enhance the use of VWAP in MT4?
Editors' Top Picks and Insights

Bitcoin price prediction based on RSI: Is BTC poised for a new rally?

Toncoin becomes Gram: Why Durov restored token's original name

Why Tether flipping Ethereum is a pivotal moment for crypto

MiCA deadline: Why crypto companies are leaving Europe

From “Holy Trinity” to WLD crash: How Arthur Hayes became a market-moving seller

The world's first trillionaire: How Musk built his fortune on electric cars, space and AI
Related Articles
Team that worked on the article
Maxim Nechiporenko has been a contributor to Traders Union since 2023. He started his professional career in the media in 2006.
Dan Blystone began his trading career in 1998 as an arbitrage clerk on the floor of the Chicago Mercantile Exchange (CME). He later traded bond and Eurex futures at proprietary firms such as Altea Trading, gaining valuable experience in high-frequency trading and risk management.
Chinmay Soni is a financial analyst with more than 5 years of experience in working with stocks, Forex, derivatives, and other assets. As a founder of a boutique research firm and an active researcher, he covers various industries and fields, providing insights backed by statistical data.
Algorithmic trading is an advanced method that relies on advanced coding and formulas based on a mathematical model. However, compared to traditional trading methods, the process differs by being automated.
Ethereum is a decentralized blockchain platform and cryptocurrency that was proposed by Vitalik Buterin in late 2013 and development began in early 2014. It was designed as a versatile platform for creating decentralized applications (DApps) and smart contracts.
An investor is an individual, who invests money in an asset with the expectation that its value would appreciate in the future. The asset can be anything, including a bond, debenture, mutual fund, equity, gold, silver, exchange-traded funds (ETFs), and real-estate property.
Forex trading, short for foreign exchange trading, is the practice of buying and selling currencies in the global foreign exchange market with the aim of profiting from fluctuations in exchange rates. Traders speculate on whether one currency will rise or fall in value relative to another currency and make trading decisions accordingly. However, beware that trading carries risks, and you can lose your whole capital.
Risk management is a risk management model that involves controlling potential losses while maximizing profits. The main risk management tools are stop loss, take profit, calculation of position volume taking into account leverage and pip value.

-
 Afghanistan
-
 Albania
-
 Algeria
-
 Angola
-
 Argentina
-
 Armenia
-
 Australia
-
 Austria
-
 Azerbaijan
-
 Bahamas
-
 Bahrain
-
 Bangladesh
-
 Belarus
-
 Belgium
-
 Bolivia
-
 Botswana
-
 Brazil
-
 Brunei
-
 Bulgaria
-
 Cambodia
-
 Cameroon
-
 Canada
-
 Chile
Chile
-
 China
China
-
 Colombia
-
 Congo
Congo
-
 Costa Rica
-
 Cote d'Ivoire
-
 Croatia
-
 Cuba
Cuba
-
 Cyprus
-
 Czechia
-
 DR Congo
-
 Denmark
-
 Dominican Republic
-
 Ecuador
-
 Egypt
Egypt
-
 El Salvador
-
 Estonia
-
 Eswatini
-
 Ethiopia
-
 Finland
-
 France
-
 Georgia
-
 Germany
-
 Ghana
Ghana
-
 Greece
-
 Haiti
Haiti
-
 Hong Kong
-
 Hungary
-
 India
India
-
 Indonesia
-
 Iran, Islamic republic
-
 Iraq
Iraq
-
 Ireland
-
 Israel
-
 Italy
Italy
-
 Jamaica
-
 Japan
Japan
-
 Jordan
-
 Kazakhstan
-
 Kenya
Kenya
-
 Korea
Korea
-
 Kuwait
-
 Kyrgyzstan
-
 Laos
Laos
-
 Latvia
-
 Lebanon
-
 Lesotho
-
 Libya
Libya
-
 Lithuania
-
 Luxembourg
-
 Madagascar
-
 Malaysia
-
 Malta
Malta
-
 Mauritius
-
 Mexico
-
 Moldova
-
 Mongolia
-
 Montenegro
-
 Morocco
-
 Mozambique
-
 Myanmar
-
 Namibia
-
 Nepal
Nepal
-
 Netherlands
-
 New Zealand
-
 Nigeria
-
 North Macedonia
-
 Norway
-
 Oman
Oman
-
 Pakistan
-
 Palestine
-
 Panama
-
 Papua New Guinea
-
 Paraguay
-
 Peru
Peru
-
 Philippines
-
 Poland
-
 Portugal
-
 Puerto Rico
-
 Qatar
Qatar
-
 Reunion
-
 Romania
-
 Rwanda
-
 Saudi Arabia
-
 Serbia
-
 Singapore
-
 Slovakia
-
 Slovenia
-
 Somalia
-
 South Africa
-
 Spain
Spain
-
 Sri Lanka
-
 Sweden
-
 Switzerland
-
 Syria
Syria
-
 Taiwan
-
 Tajikistan
-
 Tanzania
-
 Thailand
-
 Trinidad and Tobago
-
 Tunisia
-
 Turkey
-
 UAE
UAE
-
 Uganda
-
 Ukraine
-
 United Kingdom
-
United States
-
 Uruguay
-
 Uzbekistan
-
 Venezuela
-
 Vietnam
-
 Yemen
Yemen
-
 Zambia
-
 Zimbabwe
- Forex
- Crypto
