TrendSpider overview
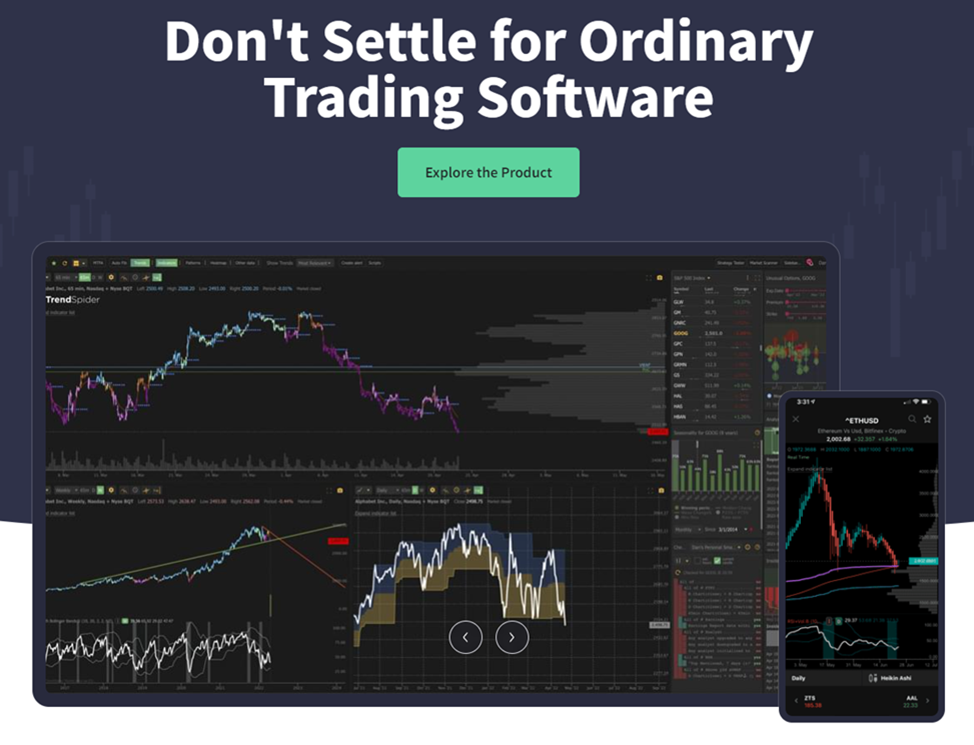
TrendSpider is a technical analysis platform with automated routine processes. Its mechanism is based on patented algorithms and a complex mathematical approach. It contains no “expert opinions” or “intuitive feelings”. Regardless of chart types or filters, the analysis takes less than a minute.
An integrated scanner allows you to quickly find recurring patterns and predict chart movement with maximum accuracy. Users can track charts in real-time, compare charts, make retrospections, and filter data by dozens of guidelines. Fine adjustments of alerts are possible, as well as automatic order execution, and other tools that make a trader’s goals much easier to achieve.
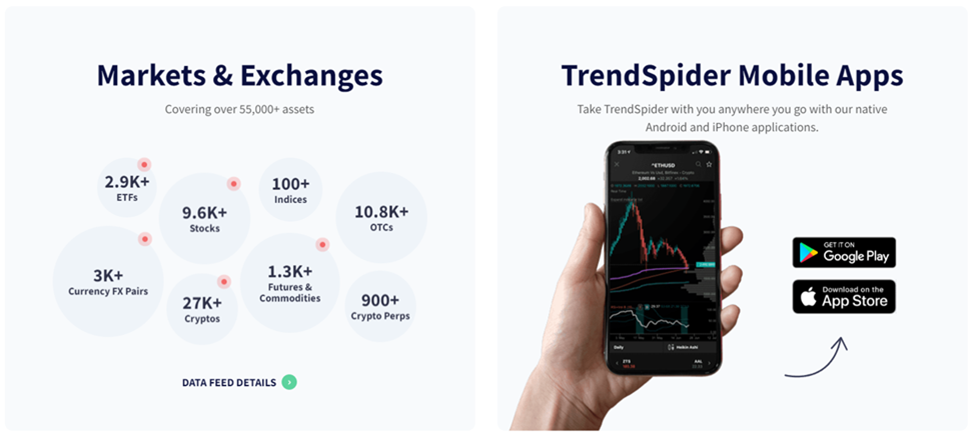
The TrendSpider software works with over 55 thousand assets, including stocks, cryptocurrencies, ETFs, and commodities. Besides a web version, there is a mobile app.
TrendSpider
What is TrendSpider?
GO TO THE WEBSITEThe TrendSpider analytic platform was launched in 2016, but the present-day website first appeared in 2018. The company has offices in the USA (Austin, Chicago, and Denver), India, Russia, and other countries. TrendSpider is positioned as a technical analysis automation software.
TrendSpider is suitable for all traders regardless of the trading style they prefer: intraday, swing trading, or long-term investing. The basic elements of the interface are charts to which you can add filters and indicators. A trader doesn’t have to find patterns himself as he does in standard trading platform charts. He makes a request and receives analysis results with a prediction.
Expert testing of TrendSpider confirms that the program effectively finds trend lines and patterns. The software can analyze several charts simultaneously and compare them by specified criteria, make historical comparisons, assess different time frames, and instantly test predictions. A user can set guidelines, and as soon as the chart meets them, TrendSpider will send an alert.
Advanced individualization of alerts allows users to get signals right after the automatic testing so that they can instantly react to the best trade entry points. Thus, traders save huge amounts of time. The mobile version is an additional benefit.
The cost of TrendSpider depends on the plan. If you pay for each month separately, the price varies from $39 to $139. If you pay for a year in advance, you get a 16-28% discount. However, to assess the features of this service, you don’t have to pay for a subscription right away. All new clients get free access for 7 days. The features of the trial version correspond to the Premium plan.
TrendSpider
Basic features of TrendSpider
In some reviews, TrendSpider is called a scanner but that’s not accurate. Unlike typical scanners, this service has several integrated and combined features that allow a client to not only get a result at his request but also use it instantly while trading.
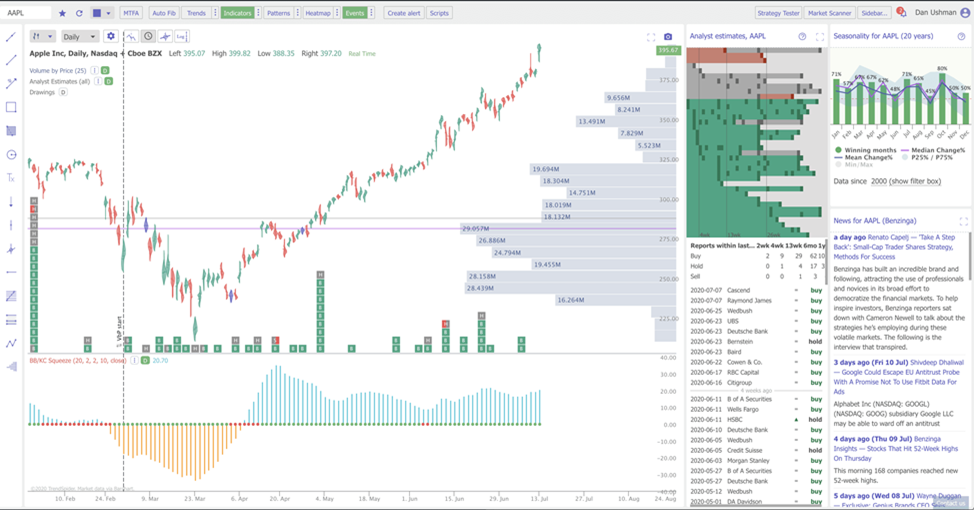
For example, there is a complex feature called Asset Insights, which combines technical and fundamental analysis methods, thereby granting instant visual access to current trades directly in charts. Analyst Action Stacking visualizations are easy to understand. They provide automatic recommendations based on user requests. You can choose a particular asset, index, and sector and assess their “bias” considering insider trades. The Benzinga option integrates news headlines into the working window. They are placed to the right of the diagram on the sidebar.
TrendSpider automatically displays the short position volume data from FINRA and allows you to see asset yield from any period. It also shows dividends and data on Nasdaq retail trading and OTC trades. All that together is an incredible volume of information, which even dozens of experienced financiers won’t be able to synthesize. However, such an analysis is well within reach of a smart system with tried and tested algorithms that are constantly being upgraded. TrendSpider uses many external resources, e.g., over 5 thousand data sets from the Federal Reserve System.
It would take a long time to discuss particular functions and general capabilities of TrendSpider. Users don’t need to know all the mechanisms that allow this software to cope with its tasks. So, TU will focus on particular features that a trader can use once he launches the program.
TrendSpider
Key features of TrendSpider charts
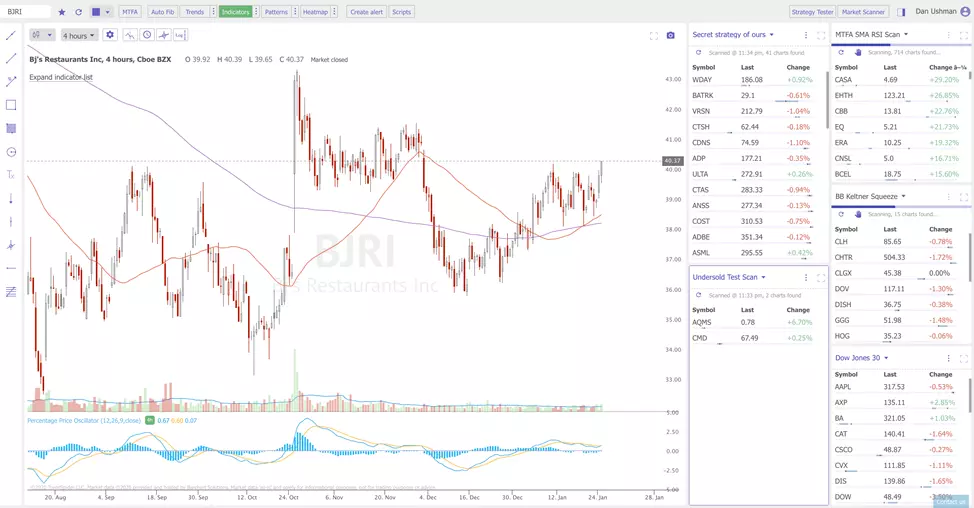
The backbone of any scanner is its diagrams. In the web and mobile versions of TrendSpider, diagrams can be customized by several dozen specifications, including colors of working elements and size, location, and content of the sections. The chart is typically placed in the main window and to the right. Also, there is a sidebar with widgets for scanning, monitoring, alerts, and notes.
Indicators are added to the chart using same-name options, and each indicator can be customized. Presently, TrendSpider offers 96 indicators. Experts don’t recommend adding a lot of them at once. But the app has a convenient feature: users can organize indicators and show or hide them at will.
Users can simultaneously view up to four charts in one window. For some strategies, that is crucially important. This feature is most often used when each chart shows a separate time frame. For instance, a trader uses daily and weekly charts for position trading and hourly and minute charts for rate fluctuation trading. Of course, time frames are customized individually but traders can use standard template settings if they have enough experience.
Trend Spider Charts
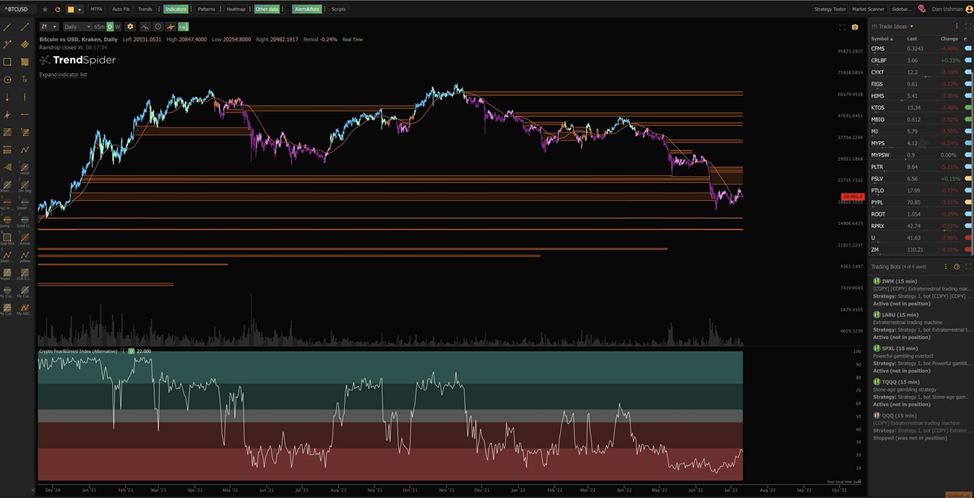
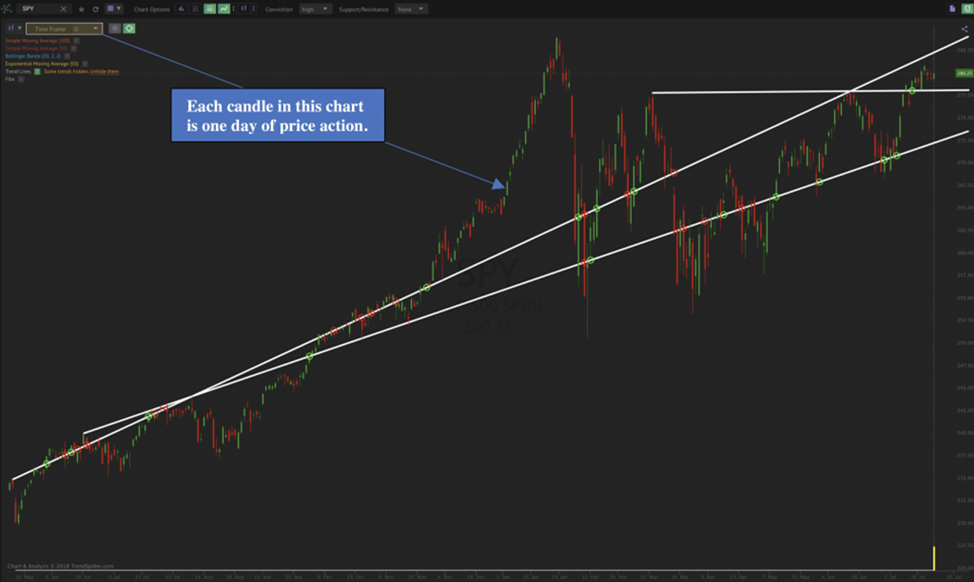
Automatic identification of trend lines
The cost of TrendSpider may seem to be too expensive but only until you learn to use the program’s tools that essentially do up to 90% of the work for you, for example, trend lines. This is one of the basic tools of technical analysis that was successfully applied long before moving averages first appeared. However, moving averages are lagging indicators, whereas trend lines are leading indicators.
Some traders underestimate the importance of trend lines because they draw them themselves. This invites subjectivity, which you can get rid of by using TrendSpider’s automated algorithms. TrendSpider draws trend lines based on precise data and without mistakes. This is convenient when you track a hundred charts at the same time and are physically unable to draw trend lines for each of them. You get a powerful and easy-to-use tool that helps to quickly find price movement patterns.
The “Show trends” tool allows you to use any number of trend lines with individual settings. Experts recommend experimenting with this alternative to find the best variant for a particular strategy or situation. Many traders simply choose the “Most relevant” option, which is best to start with.
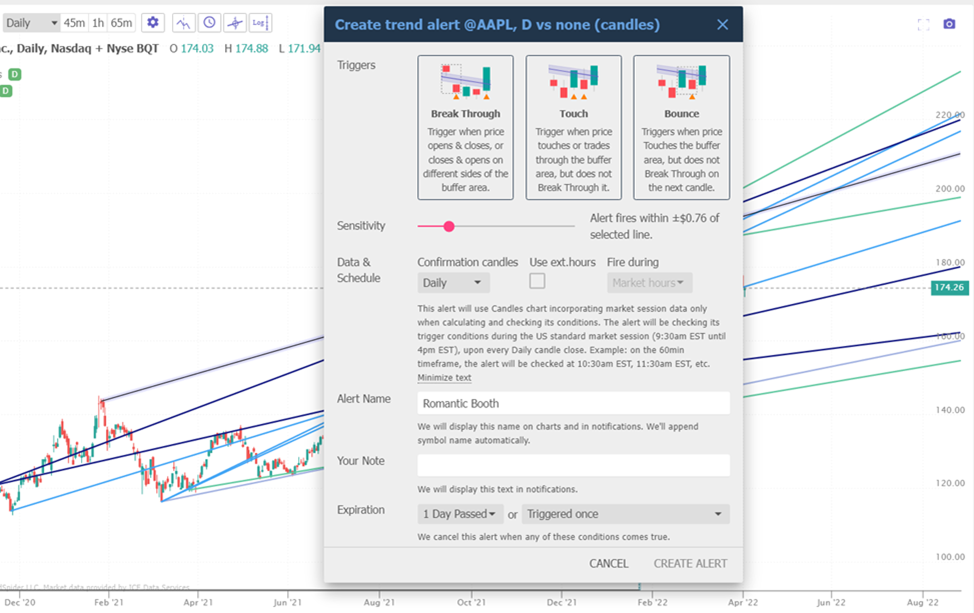
Creating trend alert
Automatic heatmaps
Heatmaps are used to determine strong and weak assets. In charts, they underline prominent areas of resistance and support. Automatic heatmaps are convenient in that they save time by determining crucial trend changes. For instance, when particular stocks arrive in large volumes after being supported at a level that was marked in the heatmap.
In TrendSpider charts, traders can combine heatmaps and trend lines to make detailed predictions. It’s possible to add other tools, such as Fibonacci levels, which the program will also draw automatically. Tool combinations that are made without human intervention are equally practical for currency pairs, futures, and cryptocurrencies.
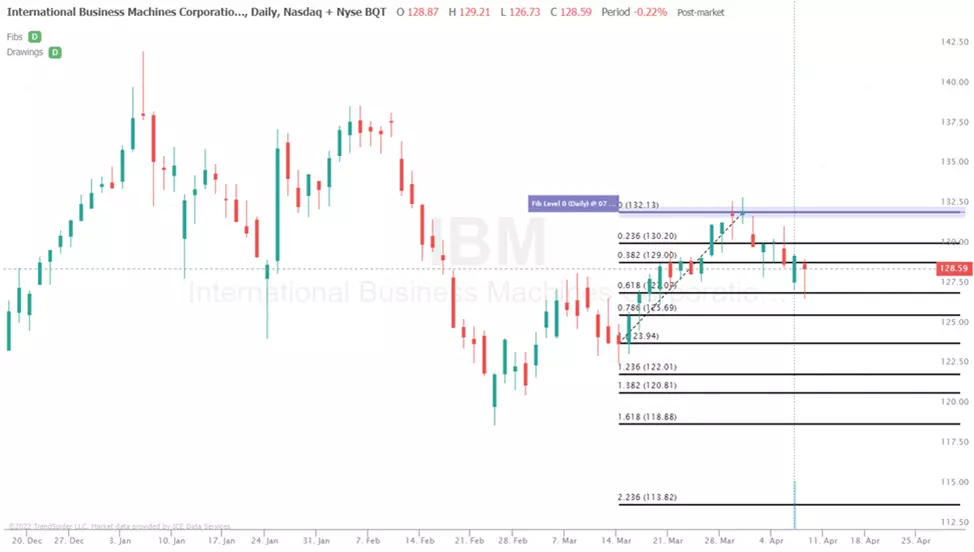
Automatic heatmaps
Recognition of candle patterns
Many services claim that they can effectively determine candle patterns. But in most cases, they don’t do it well, so traders can’t benefit from it. TrendSpider is great at finding candle patterns in charts, and traders can choose several patterns at once.
Novices usually look for “doji” and “hammer”, i.e., simple patterns that develop quite predictably. Experienced players use patterns with three candles, such as “morning doji star”, which emerges when a price bounces off a support level or at reversal points. Candle patterns and indicators prove themselves in market scanning.
Recognition of candle patterns
Multiple time frames
Traders often view several charts at once but indicators with settings for two time frames can overload the diagram. To solve this problem, TrendSpider offers the MTFA feature, which allows you to view two time frames in one chart without worsening the visual perception of the diagram.
Intraday traders who trade in short positions set higher time frames to predict resistance and support areas. But day traders often lose money because they only focus on low time frames. That’s why to holistically assess market situations, it’s important to set two time frames at once. Add heatmaps, and you will have no problem finding support and resistance areas.
Experts state that the feature of multiple time frames should be used by all traders without exception irrespective of their trading style. Even if you trade in one chart, it’s reasonable to set different time frames.
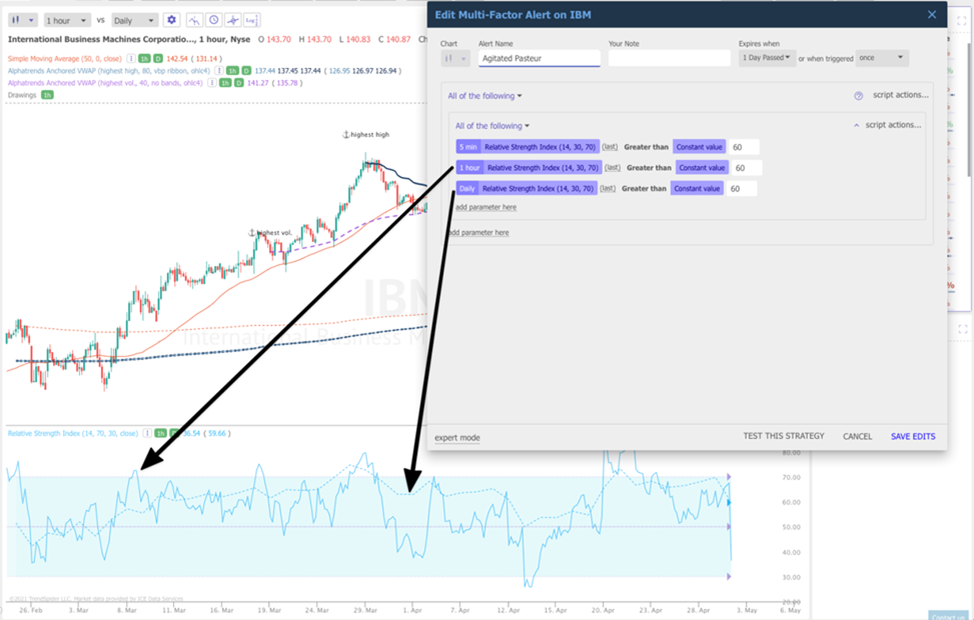
Editing multi-factor alerts
TrendSpider scanner
Many technical analysis services have much the same features as Market Scanner. The TrendSpider scanner is special in that a trader sets criteria for three time frames at once. Scanning allows you to set any criteria, such as candle patterns, volumes, technical indicators, etc. A retrospective review of TrendSpider shows that the service adds new specifications every month to make scanning more goal-oriented and improve its efficiency.
Here's an example of a successfully solved scanning problem. You are looking for stocks from the Russell 2000 Index with a profit increase in three quarters and with a bullish pattern in 15-minute and daily charts. Plus, you need a golden cross in a monthly chart and a recently published article that mentions the chosen subjects. Market Scanner can do the job because it allows you to use any combination of technical dynamic indicators and conditions for several time frames. Moreover, the scanner has ready-made configurations. This is a truly unique and invaluable market analysis tool.
TrendSpider scanner
TrendSpider alerts
Every trader knows this situation: he is intently watching particular stocks, waiting for their retracement or breakout, then gets distracted by a one-minute talk on the phone and gets back to the monitor when the stocks have already dropped or surged. For this reason, experienced players appreciate warnings (alerts) no less than filters. Besides that, when you see a basic situation in the chart, it doesn’t mean that you should enter the trade immediately. Sometimes, it’s better to minimize risks by setting additional conditions.
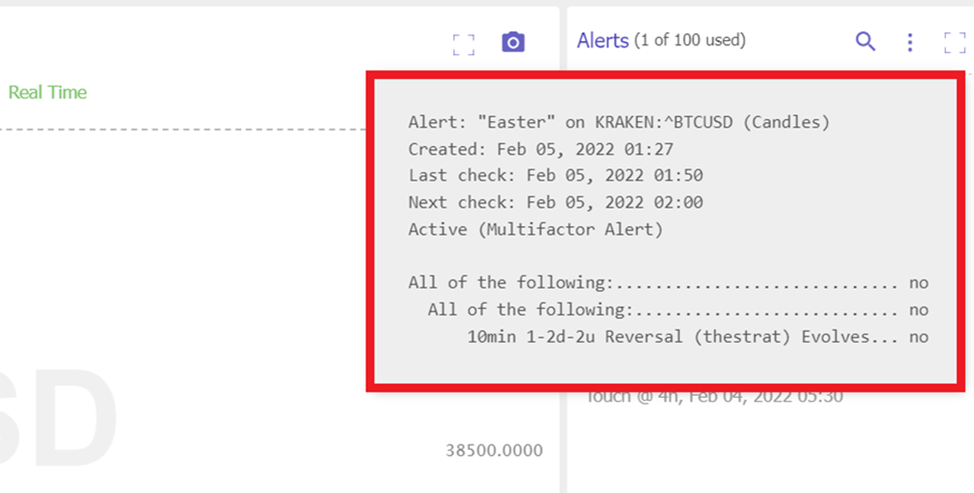
Alerts help to not miss a truly perfect moment. They can also be used to exit a trade at the best price. In TrendSpider, a trader can choose any combination of criteria and get alerts about it. They can work separately for different groups of specifications or only when every condition in a chart is fulfilled.
Alerts offered by most competitors work differently. Usually, they warn about average prices but TrendSpider alerts are more like scanning. Of course, multiple frameworks can also be used. Dynamic price alerts that are based on trend lines, Fibonacci levels, indicators, etc., are set by clicking the right mouse button on a chart. This tool is very easy to use.
TrendSpider developers understand that it would be unfortunate not to get alerted just because a current price of an asset is slightly out of the price range that was set by the user. That’s why the program has the “Sensitivity” adjustment that allows you to receive warnings even if the situation doesn’t exactly meet the specified conditions.
Here is a simple example of the effective use of an alert. Forex traders often enter a trade too early, reacting to a bounce at a Fibonacci level, and then see the price continue to go down. Not to risk entering early and making a mistake, it’s reasonable to set up a bounce alert. In TrendSpider, you can set up alerts to appear on the screen or be sent to your email address or phone.
TrendSpider alerts
TrendSpider backtesting
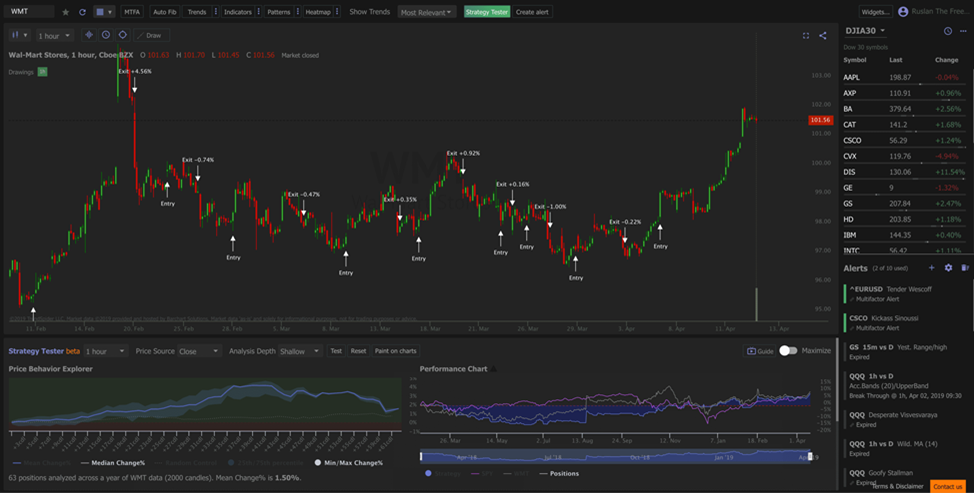
This feature is called Strategy Tester. It allows you to apply a chosen strategy to historical data, i.e., you can project your action plan onto a historical chart and see how successful it is regarding the shift and timing conditions. You can only test one market and one asset at a time. Test results are displayed in a chart or copied to a CSV or Excel file if needed.
The feature of testing strategies in TrendSpider provides a unique opportunity to get perfect entry and exit points. You need to understand, however, that success in the past doesn’t guarantee success in the future. Backtesting suggests that you can’t take into account the broker fee or other related expenses. By default, testing is performed under perfect conditions but the “Trade by next” feature allows you to make more realistic predictions.
TrendSpider backtesting
TrendSpider prices
The cost of TrendSpider depends entirely on the plan chosen. Plans differ by available features. You can’t say that a more expensive plan is undoubtedly better than a cheaper one. Plans are specialized and each of them is suitable for traders with particular experience, trading styles, and strategic goals. Below, there is a list of the plans, their costs, and basic features.
Premium is perfect for retail traders who are focused on day trading. It costs $39 per month and has basic features but doesn’t offer indices, backtesting, multi-factor alerts, automatic linking, or some other features.
Elite is intended for active traders with flexible strategies and investors that prefer long-term projects. It costs $79 per month and has all basic and additional features, including indices, backtesting, automatic linking, insider trading, and asset seasonality. You can switch on up to three bots and receive up to 100 alerts and 100 scanning results.
Advanced. This plan is intended for professional traders and investors who work full-time. It costs $129 per month and includes all features, including 6 workspaces, 250 alerts, 250 scanning results, 5 active trading robots, and unlimited individual support.
Note that the above prices are valid if you pay once a month. If you pay for a year in advance, the use of TrendSpider will become considerably cheaper, and the monthly cost of the Premium, Elite, and Advanced plans will be $33, $65, and $97, respectively.
Education and support
TrendSpider has one of the best educational systems. TrendSpider University provides guides on all aspects of trading in fiat and cryptocurrencies, stocks, and other assets. The interface and features of the platform itself may be studied separately. Educational materials are presented in text and video formats and as online lectures with tests for comprehension.
A separate tab contains all the technical documentation. The company conducts free and regular webinars with leading financial experts and offers individual learning courses. The courses are available to all registered users, including those who are currently using the free trial version of the platform.
TrendSpider provides tech support by phone, email, and LiveChat. The chatroom is also available to unregistered users. The company’s official Discord channel can be used as an additional communication means. There is a typical FAQs section, and users can turn to tech support with individual requests. TrendSpider's blog includes a lot of technical and fundamental analytics, as well as posts pertaining to economic and political news, and detailed information on the platform updates. The articles are conveniently organized into categories.
TrendSpider TV is a collection of video materials such as guides, instructions, analytics, useful advice from experts, webinar posts, current predictions, etc. All videos can also be viewed on the company’s YouTube channel. Short videos are considered to be some of the easiest to understand and memorize. Also, you can just listen to them while doing something else.
Is TrendSpider safe and can it be trusted?
The company is officially registered in Chicago. It has transparent tax data and works in compliance with U.S. laws. It doesn’t have a financial regulator but regulation of this kind of service is not required.
Market data is provided by NYSE, ICE, CME Group, Nasdaq, IEX, CBOE, Barchart Solutions, Polygo, Benzinga, Intrinio, and Quiver Quant. Historical data and lists of securities are taken from ICE Data Services. TrendSpider developers have decided to patent their service, and the patent is pending.
There is no reason not to trust the TrendSpider platform. It has been in business for 6 years, and in this time, no evidence of fraud or nonfulfillment of its obligations to its clients has been reported. This is a reputable company whose reliability is confirmed by its high status in the international market.
Best AI Trading Software - Top 6 Providers ReviewHow to start using TrendSpider?
To get access to the TrendSpider features, you have to register your user account on the official website. Then you can continue working with the program through the website or download the mobile app to your phone.
Follow these step-by-step instructions:
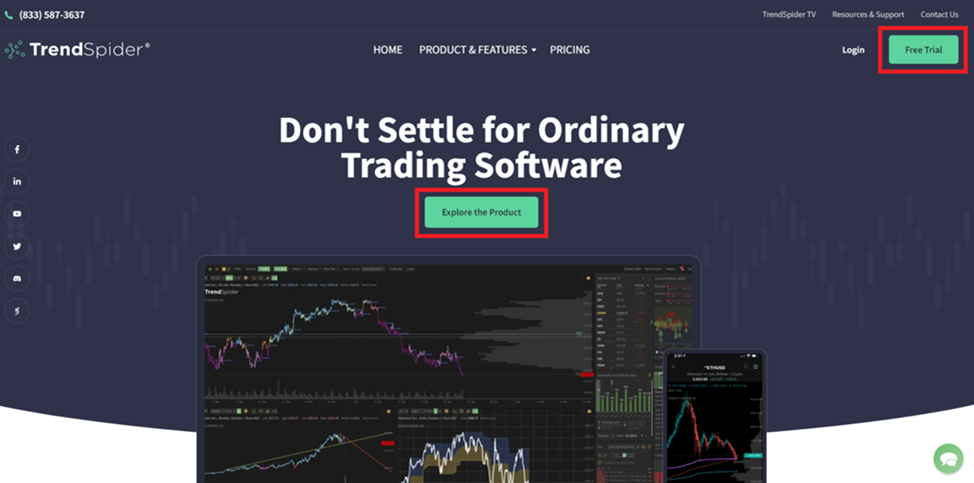
1. Go to the official website of TrendSpider. In the top right corner of the screen, click the “Free Trial” button. An alternative option is to click “Explore the Product” in the center of the screen and then click “Try TrendSpider for Free”. Buttons with the offer to try the platform’s features for free are on many pages of the website and all of them lead to the next step.
How to start using TrendSpider
2. Choose the rate plan that is suitable for you. Note that the cost of using TrendSpider will depend on whether you choose to pay every month or buy an annual subscription. Later, the plan can be changed. Click “See Plan Comparison” in the bottom left corner of the screen to learn the differences among the plans. When you make your choice, click “Next”.
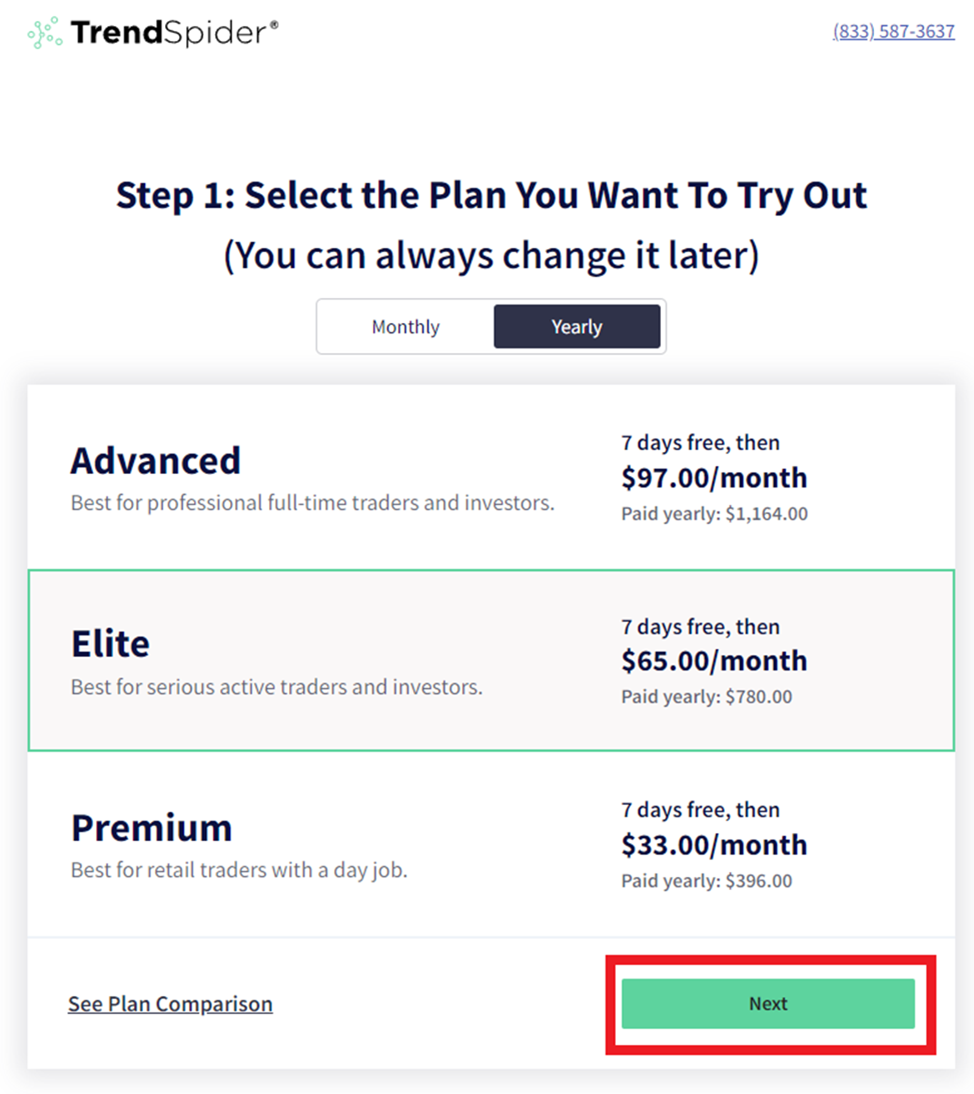
Choosing the rate plan
3. Provide registration data such as your first and last names, email, and phone number. You cannot give false information because it will be reviewed, and your email and phone will be used for confirmations and notifications. Then include the number for the bank card from which payments for the plan will be collected. Note that at first you will be provided with the free 7-day period, and then the platform will start to automatically collect payments per the plan you chose. For payments not to be collected, you need to cancel your subscription in the account settings before the free period ends. When registering, be sure to check the box to agree to the terms of service. Click “Continue”.
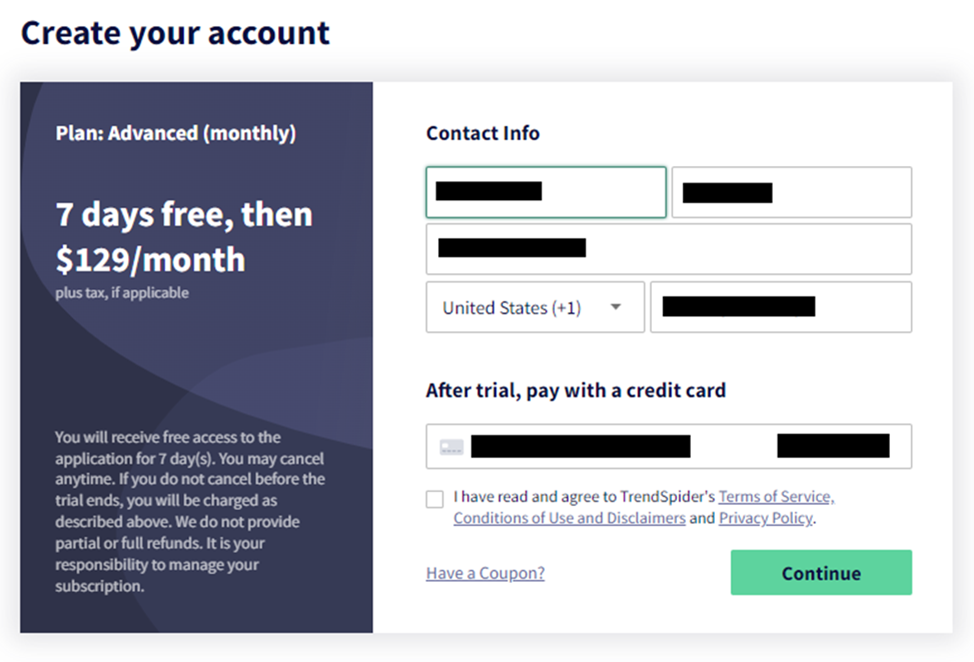
Registration
4. Follow the on-screen instructions. Your card number will be verified automatically, and you will have to confirm your email and phone number. Later, you will be able to change your registration data in the account settings. For maximum safety, the Traders Union recommends setting up all the methods of account protection. Account settings also allow you to select a theme and other customization restrictions.
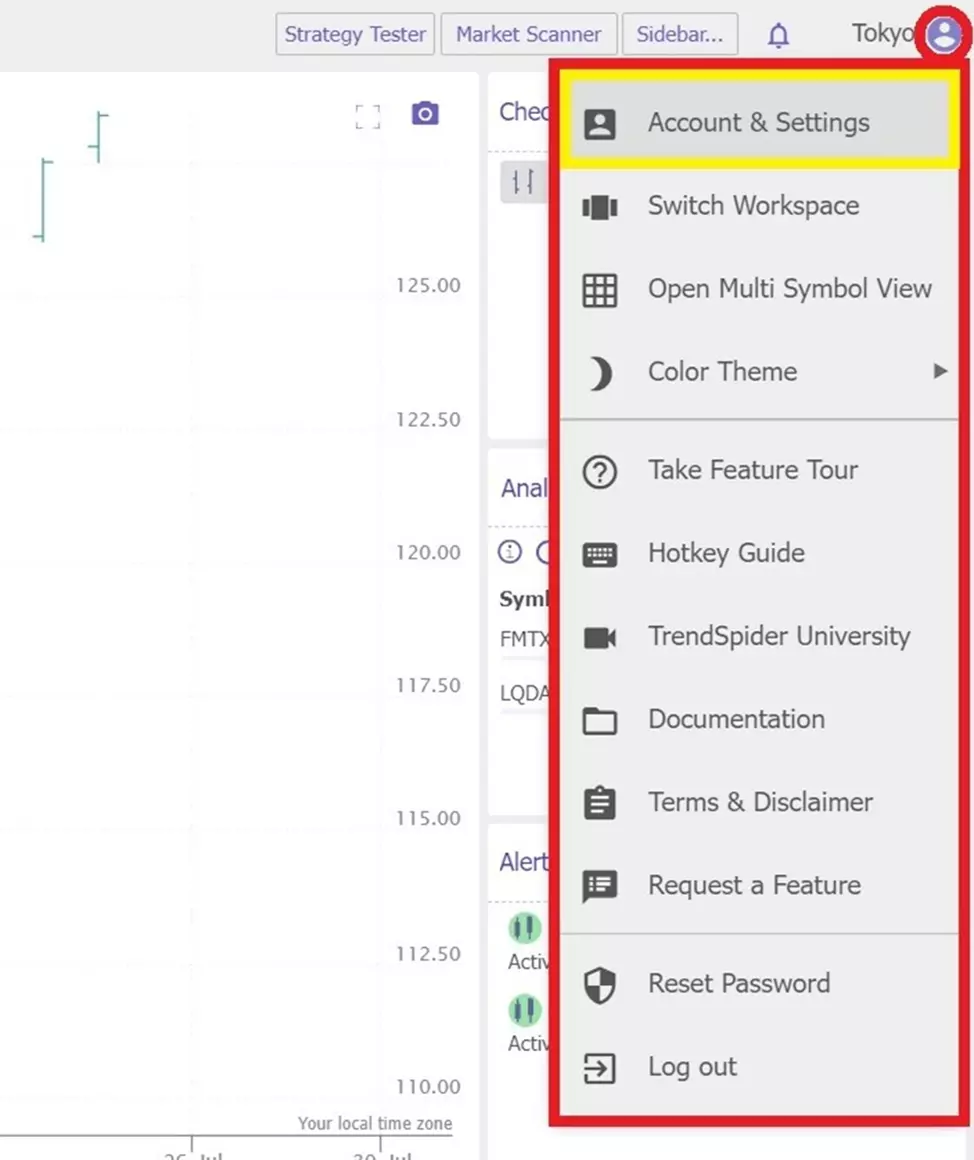
Account&Settings
5. If you want to use the mobile app, go to the homepage of the TrendSpider website. Scroll the page down until you see the section that mentions the app. There, you will find the links to the App Store and Google Play. Click the one that corresponds to your phone’s operating system. If your PC is synchronized with your phone, installation can be performed remotely. Otherwise, you will have to visit the store on your phone, enter “TrendSpider” in the search box, and download and install the app.
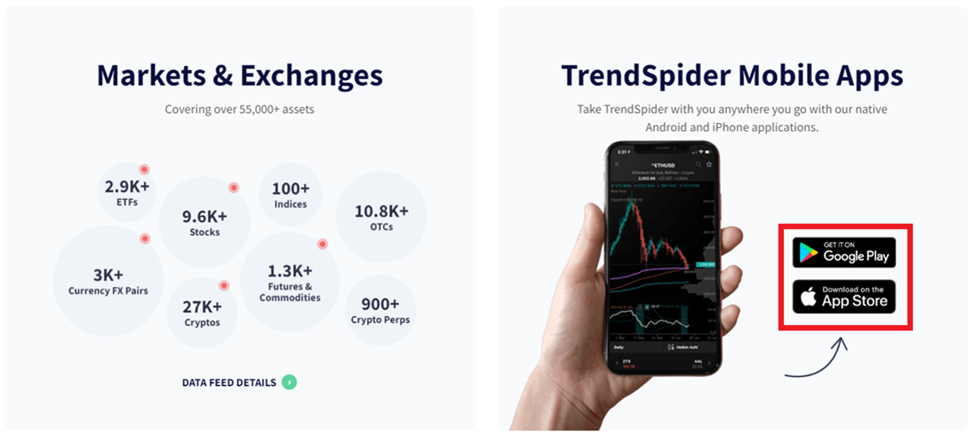
The mobile app
As you can see, registration is simple and doesn’t take much time. The web version and the mobile app have the same interface with the same features. The app was released in 2021 at the request of clients. Like the web version, the app is updated regularly.
FAQ
How does TrendSpider differ from similar services?
TrendSpider has a number of unique features such as multiple time frames, backstacking, automatic heatmaps, and smart recognition of candle patterns. Some of these features are also offered by its competitors but only TrendSpider provides them all at such a high technical level.
What is the basis of all TrendSpider features?
The basis is the charts. A trader can view several charts at the same time and apply numerous indicators, including those that are automatic such as trend lines, heatmaps, and patterns (96 types). It’s possible to set almost any combination of specifications to get perfect entry and exit points.
What are TrendSpider alerts used for?
Alerts allow a trader time to react when a chart meets the parameters set by the user. It’s possible to set almost limitless criteria at once. Warnings can be received as pop-up boxes, emails, or text messages on your phone.
What is the best TrendSpider plan?
The cost of using TrendSpider is determined by the rate plan. It’s more favorable to buy a subscription for a year because this way you will get a 16%-25% discount, depending on the plan. The more expensive the plan, the more features it provides. The Premium plan, however, is usually enough for beginners. There is no point in paying more for the features you don’t need so far. For the first 7 days after registration, the platform is free to use.
Glossary for novice traders
-
1
Fundamental Analysis
Fundamental analysis is a method or tool that investors use that seeks to determine the intrinsic value of a security by examining economic and financial factors. It considers macroeconomic factors such as the state of the economy and industry conditions.
-
2
Investor
An investor is an individual, who invests money in an asset with the expectation that its value would appreciate in the future. The asset can be anything, including a bond, debenture, mutual fund, equity, gold, silver, exchange-traded funds (ETFs), and real-estate property.
-
3
Day trader
A day trader is an individual who engages in buying and selling financial assets within the same trading day, seeking to profit from short-term price movements.
-
4
Day trading
Day trading involves buying and selling financial assets within the same trading day, with the goal of profiting from short-term price fluctuations, and positions are typically not held overnight.
-
5
Backtesting
Backtesting is the process of testing a trading strategy on historical data. It allows you to evaluate the strategy's performance in the past and identify its potential risks and benefits.
Related Articles


Team that worked on the article

Rinat Gismatullin is an entrepreneur and a business expert with 9 years of experience in trading. He focuses on long-term investing, but also uses intraday trading. He is a private consultant on investing in digital assets and personal finance. Rinat holds two degrees in Economy and Linguistics.

Dr. BJ Johnson is a PhD in English Language and an editor with over 15 years of experience. He earned his degree in English Language in the U.S and the UK. In 2020, Dr. Johnson joined the Traders Union team. Since then, he has created over 100 exclusive articles and edited over 300 articles of other authors.
