How do momentum indicators work?
Description of the momentum indicator. The indicator compares the current price with the price that was a few candles ago. The calculation formula is as follows:
Momentum = Close(i)/Close(i-n) * 100%
Close(i) is the closing price of the current candle.
Close(i-n) is the closing price n candles ago.
The oscillator is placed under the price chart and is a single solid line.
In the description of the momentum indicator, most often in the settings, the level of 100% is indicated as the median line, which means that the current price is equal to the price that was n-candles ago. This level is called the zero mark. This is not entirely correct, because depending on the period, this “zero level” will be located on different horizontal lines.
Interpretation of indicator signals:
1
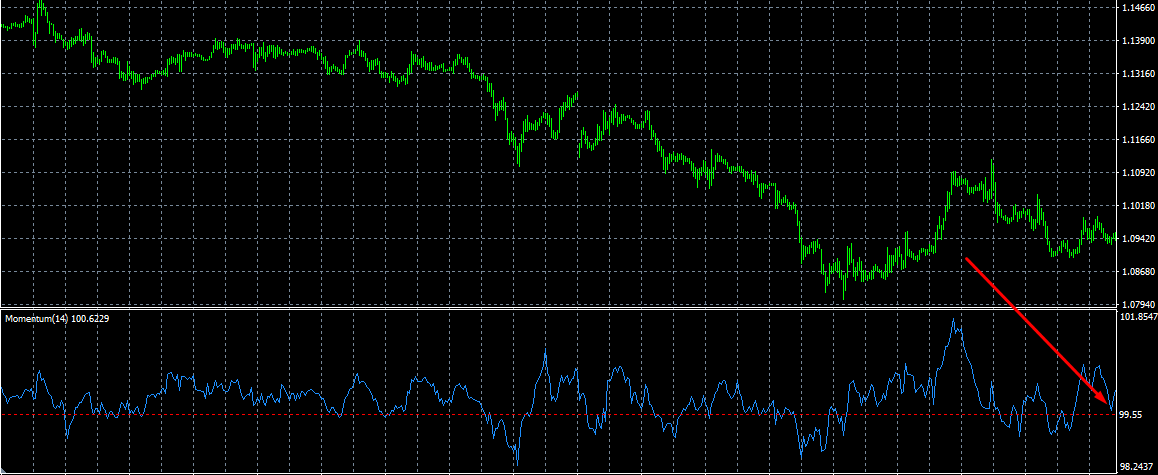
Indicator reversal at the highest extremes. The signal to open a short position is formed at the time of the formation of the highest top, while the long position is formed at the lowest point.
To search for a strong extremum, you need to plot the level of the previous highs/lows on the chart.
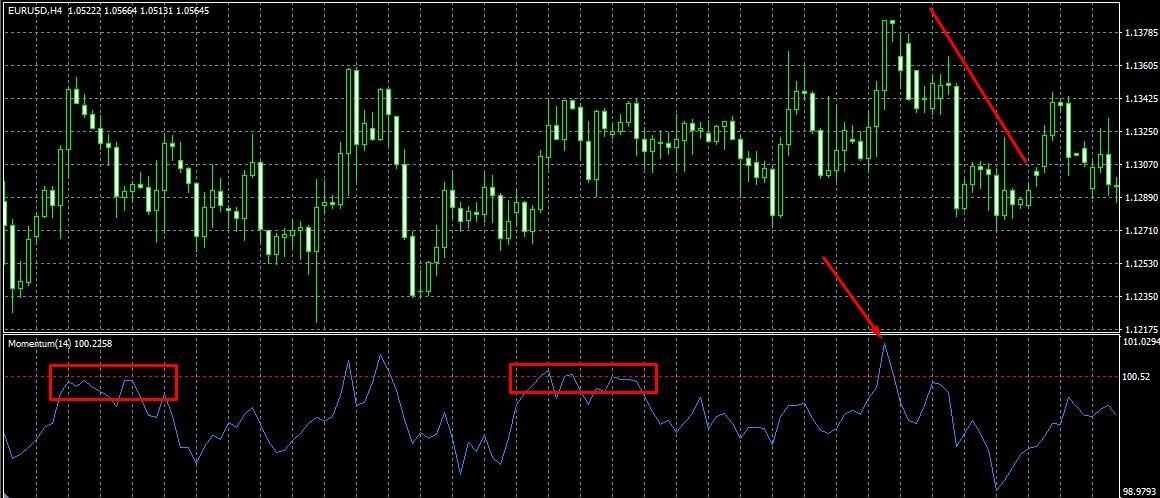
Interpretation of indicator signals
This graphic shows that the indicator most often reversed at the level of 100.52. A breakdown at this level is a preliminary signal. When the indicator reverses, open a short position.
This approach reduces the number of signals but makes them more accurate. In theory, you can target any highs and lows above or below the median level. But such a strategy gives a lot of false signals and does not allow you to estimate the duration of the reversal movement. In the proposed system, weak signals are eliminated and the transaction is opened in the direction of a strong reversal movement.
2
Divergence. Momentum is a leading indicator. If the chart shows a diversified movement of the price and the indicator, this indicates that the momentum is ahead of the price and the price will turn towards the indicator in a few candles.
Bullish divergence is built on the lows. The lows of the indicator are rising, and prices are falling. Bearish divergence is built on the highs. The highs of the indicator are falling while prices are rising.
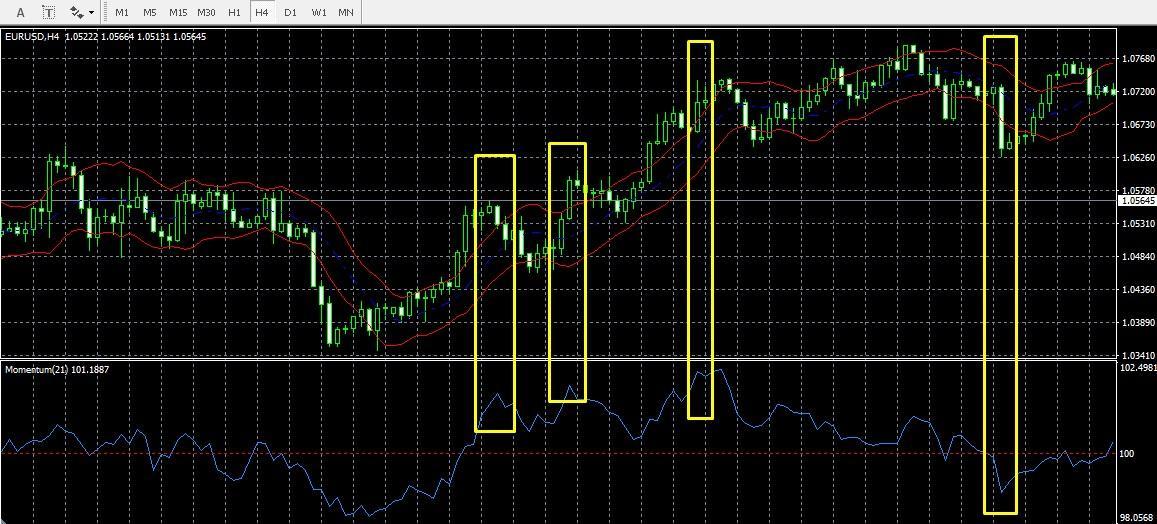
An example of a bullish divergence.
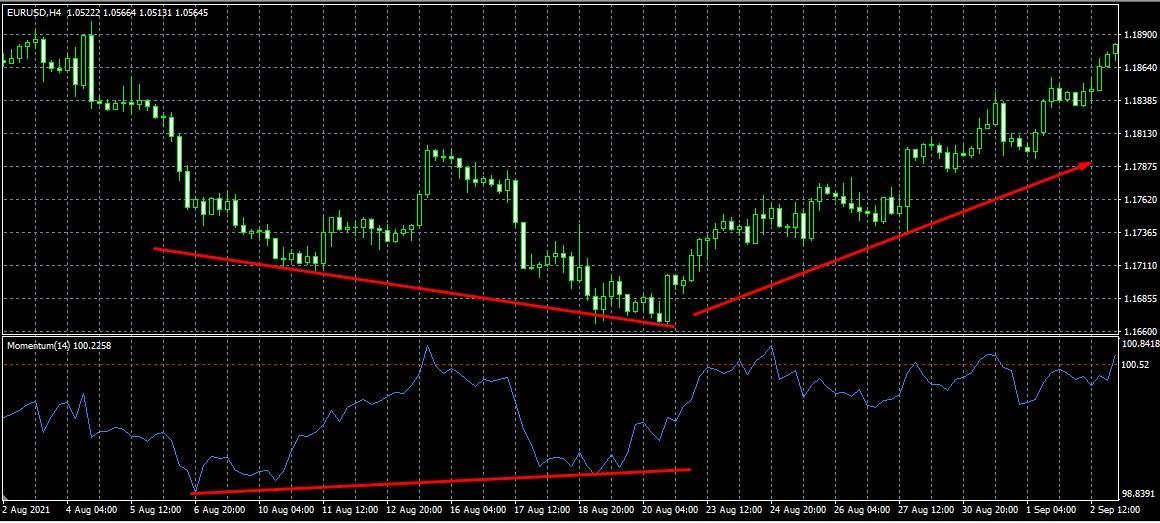
An example of a bullish divergence
The divergence is clearly visible on the reduced scale of the chart. The lows of the indicator rise, but the price goes down. After the end of the divergence, a strong uptrend began.
3
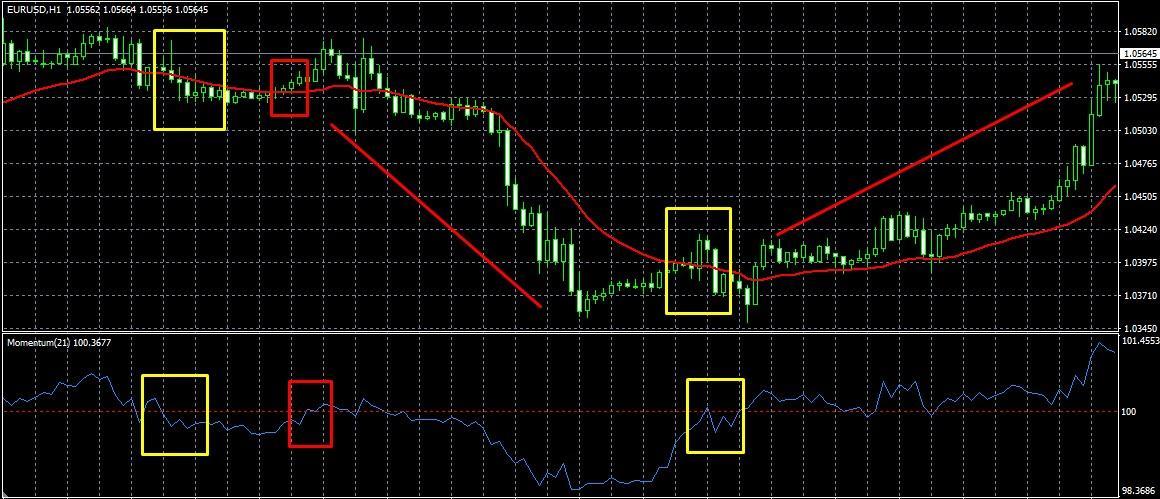
Breakout of the median level “100”. According to the theory, the base level relative to which the momentum moves is the “100” mark. If the indicator started its upward movement from the bottom of the chart, crossed level 100, and continued to move, this is a signal to open a long position. If the momentum gauge stays above 100 for a long time, an upward movement dominates the market.
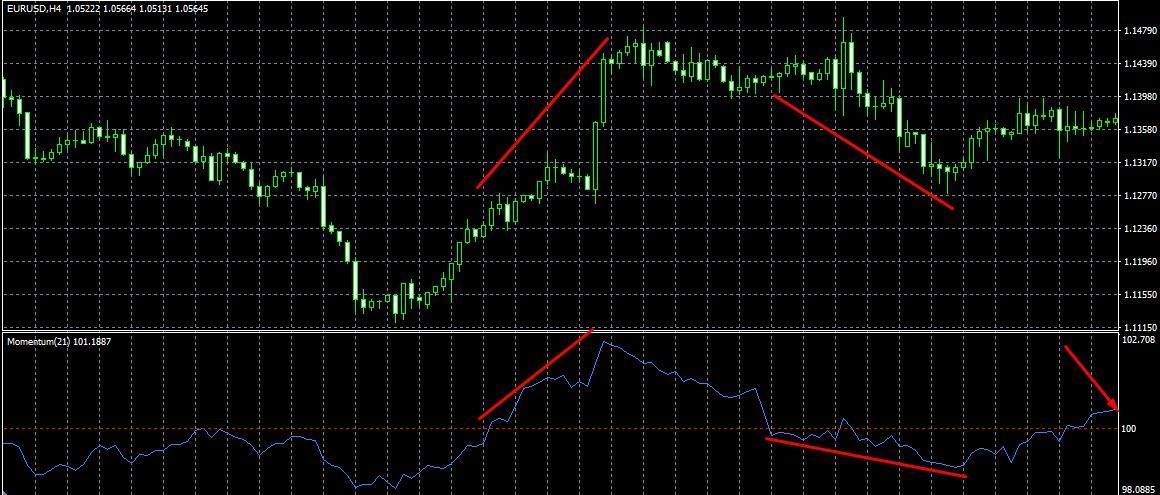
Breakout of the median level "100"
The mark “100” is the base level that is needed to understand the principle of searching for momentum signals. You don’t have to link to it. You can set any level that you wish.
Based on the basic idea of calculating the strength of the price impulse, modified versions of momentum have been developed:
Anchored moments. The formula has been changed to add the key static level “0”, which is the median.
Fx momentum. Standard momentum, which is displayed below the price chart in several windows corresponding to several major timeframes. The indicator is suitable for traders who analyze older time intervals and open a transaction on younger ones (for example, the Elder’s Three Screens strategy).
Momentum pinball. Standard momentum with visualization added. The indicator itself highlights key lows and highs with color, marking potential reversal points. There is no need to build additional horizontal levels.
Momentum divergence mtf. The indicator finds obvious discrepancies between the price and the line, marks them on the chart, and indicates the direction of opening transactions. There is a multi-timeframe function that displays several intervals in several windows on one chart.
There are also modified versions of the indicator built on a combination of momentum with MACD, RSI, and other oscillators.