Support And Resistance Indicator For MT4/MT5


Editorial Note: While we adhere to strict Editorial Integrity, this post may contain references to products from our partners. Here's an explanation for How We Make Money. None of the data and information on this webpage constitutes investment advice according to our Disclaimer.
Support and Resistance indicator for MT4/MT5 automatically finds the levels or zones, where several recently formed fractals are located. The indicator works on all timeframes, on all markets, not redrawn and has flexible settings. You can use it in MT4 or MT5 through the indicators tab.
Support and resistance (S&R) is an important concept in the day-to-day work of a trader that helps reduce the risks and find more accurate points of entry to the market. What is support? It is a level or “zone”, which works as a sort of an obstacle against the downward trend of the price. Resistance, therefore, is the level of “zone” that acts as an obstacle against price growth. This article will provide a simple and effective method of finding the support and resistance levels/zones using a free indicator available for the popular MetaTrader 4 and MetaTrader 5 platforms. You will find the download link towards the end of the article.
Support and resistance review
For those yet unfamiliar, support and resistance levels help reduce the risks while also finding more accurate points of entry to the market.
Either way, support is a level or “zone” that functions as a barrier against the downward trend of the price. Support is a term used to describe the point at which demand is strong enough to prevent the stock from being further devalued. The logic behind this mechanism is that as the price falls and approaches the point of support, the demand increases, and sellers are then less willing to sell.
On the other hand, resistance is the level of “zone” that serves as a barrier against price growth. It is a term that is used to describe the level at which supply is strong enough to prevent the stock from increasing. The logic behind this mechanism is that as prices increase and approach the point of resistance, sellers become more likely to sell, and buyers become less likely to buy.
Moreover, one essential element of technical analysis is that when the support level is broken, its role is reversed. In other words, the level becomes resistance If the price falls below a support level. Likewise, the level will become support if the price rises above a resistance level.
- Pros
- Cons
Helps you get a clear view of where the price might reverse or stall, so you don’t have to overthink your trades.
Aids in managing your risks, letting you set stop-losses just outside these levels to protect your capital.
Identifies critical price zones where large players in the market are likely to enter, which can make the price react strongly.
It’s customizable to different timeframes, which makes it useful whether you’re a day trader or someone looking for long-term setups.
In volatile markets, these indicators can throw off false signals, especially during big trends, leaving beginners with fake breakouts or breakdowns.
They often ignore upcoming news or market events, relying too much on past data which can mislead your trading decisions.
If you only use this indicator, you might get stuck in a "sideways" market, where the price just bounces between levels without breaking out as expected.
The levels are sometimes subjective, meaning what works for one trader might not be accurate for another, leading to mixed results if used alone.
How does the support and resistance indicator work?
The work of the indicator is based on the fractal indicator built into the MT4 platform. The fractal is a local extremum described by Bill Williams.
The support and resistance indicator automatically finds the levels or zones, where several recently formed fractals are located. It is a sign that the level/zone works as support/resistance.
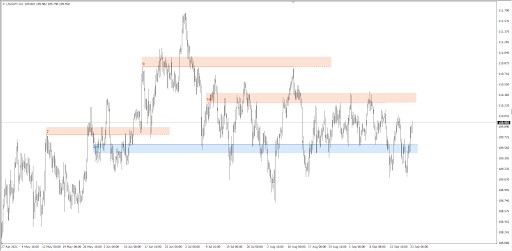
The indicator shows the found levels by color:
Blue – support levels;
Orang – resistance levels.
The figure shows the number of fractals. The higher the figure, the stronger the level. By clicking on the figure, you will see fractals, which were used for building the level.
How to set up support & resistance indicator in MT4
Once you’ve downloaded the S&R indicator (link provided towards the end of the article), the installation of the indicator is usual. Here is a step-by-step guide for the users of Windows:
Launch your Metatrader.
Open the folder with the platform data using the File/Data Folder menu.
In the folder, open MQL4/Indicators folder.
Insert Support & Resistance.ex4 file from the downloaded archive.
Restart your MT4 platform (or refresh the Navigator window).
That’s it! All is set. You can now open any chart on the MetaTrader 4 platform and add S&R indicator to it through the menu Insert / Indicators / Custom / SupportResistance.
Support & resistance settings in MT4 and MT5
Support & resistance indicator in MT4 and MT5 has simple and flexible settings.
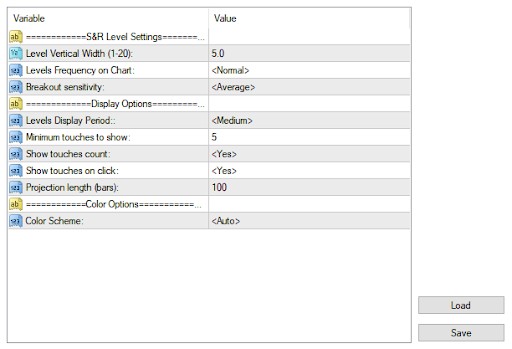
Level width – from 1 to 10:
1 – the indicator will show narrow levels.
20 – wide zones.
Frequency – this setting determines how tightly the levels are placed:
More – more tightly.
Less – the most significant levels are shown.
Sensitivity – how quickly can the level be considered broken:
High – in order for the level to be considered broker, a minimum number of fractals need to appear after it.
Low – lower sensitivity of the indicator for the level breakout.
Display period – this setting determined the number of candlesticks on the history that is analyzed:
Short = 300 candlesticks.
Long = 1,200 candlesticks.
Touches to show – minimum required number of fractals for building a level.
Show touches count – displaying the number of fractals in the left part of the level (true / false).
Show touches on click – whether to show the fractals when clicking on their number (true / false).
Projection length – how far into the future should the levels be shown.
Support & resistance best strategies
There are three basic strategies for trading based on the support and resistance levels:
The reversal.
The breakout test.
The reversal
This is the most apparent strategy, when the trader needs to sell near the resistance levels and sell near the support levels (see examples on the chart below).
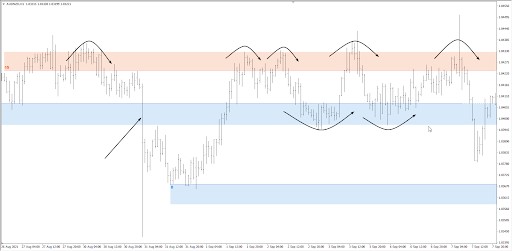
The hazard of this strategy is that it will cause losses during sharp movements. Therefore, you probably should avoid using it during the release of important news (shown by the arrow above).
The breakout
This strategy implies the sale of the asset once its price breaks the support level and purchase of the asset once the price breaks the resistance level.
It is rational to apply this strategy at the start of active market sessions (European and American), when expecting important news and when the price is within a narrow range for a long time.
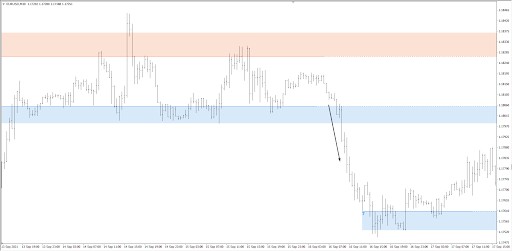
The breakout test
This strategy uses the “mirror” level principle, i.e. after the breakout the resistance works as support and the former support becomes resistance.
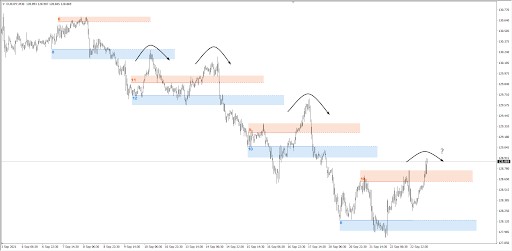
The chart above shows how during the downward trend, the blue support levels, after the breakout, offered resistance to the growing prices, thus providing opportunities for entering a short position.
Which of the 3 strategies should be used?
There is no definitive answer to this question, as strategies listed above cannot be just right or wrong. They all will provide profitable and false signals. Try using each of them on a demo account to see which one suits you the best.
Most importantly, cut the growing losses and evaluate profit growth potential.
Combination with other tools
To increase the accuracy of trading signals, the support and resistance indicator is effectively combined with oscillators such as RSI (Relative Strength Index) or Stochastic, as well as candlestick patterns.
Using with oscillators
RSI. This oscillator measures the speed and change of price movements, helping to identify overbought or oversold conditions of an asset. When the price reaches a support level and the RSI is in the oversold zone (usually below 30), this may indicate a potential upward reversal. Similarly, when approaching a resistance level and the RSI value is above 70 (overbought zone), a downward reversal is possible.
Stochastic oscillator. This indicator compares the current price of an asset with its price range over a certain period, identifying moments when the price is close to extremes. When combined with support and resistance levels, the stochastic can confirm trend reversals. For example, if the price is approaching a support level and the stochastic is oversold (below 20), this strengthens the buy signal.
Using with candlestick patterns
Candlestick patterns provide visual clues about market sentiment. When analyzed near support and resistance levels, they can confirm or deny potential reversals.
Bullish engulfing. This pattern occurs when a down candlestick is followed by a larger up candlestick that completely covers the previous one. When this pattern appears at a support level, it can signal the beginning of an uptrend.
Bearish engulfing. The opposite situation occurs when an up candlestick is followed by a larger down candlestick that completely covers it. When this pattern forms at a resistance level, it can indicate the beginning of a downtrend.
Practical application
Suppose the price of an asset is approaching a support level, the RSI is oversold, and a bullish Hammer pattern is forming on the chart. The combination of these signals increases the probability of an upward price reversal, providing the trader with a reasonable entry point for a long position.
Combining the support and resistance indicator with oscillators and candlestick patterns allows traders to make more informed decisions, increasing the likelihood of successful trades.
| MT4 | MT5 | Currency pairs | Min. deposit, $ | Max. leverage | Min Spread EUR/USD, pips | MAX Spread GBP/USD, pips | Investor protection | Regulation level | Open an account | |
|---|---|---|---|---|---|---|---|---|---|---|
| No | Yes | 69 | 50 | 1:50 | 0.9 | No | No | Tier-1 | Go to broker Your capital is at risk. |
|
| No | Yes | 50 | 10 | 1:1000 | 0.1 | 0.6 | No | Not regulated | Go to broker Your capital is at risk.
|
|
| Yes | Yes | 68 | No | 1:200 | 0.1 | 0.5 | £85,000 SGD 75,000 $500,000 | Tier-1 | Go to broker Your capital is at risk. |
|
| Yes | Yes | 80 | 100 | 1:50 | 0.7 | 1.4 | £85,000 | Tier-1 | Study review | |
| Yes | Yes | 120 | 1 | 1:30 | 0.1 | 0.5 | €100,000 (ES) | Tier-1 | Study review |
Should I use the support & resistance indicator?
Support and resistance level / zone indicator will be useful for all regardless of their expertise:
For the beginners. The indicator can provide valuable assistance to those who do not know how to build S&R levels on their own.
For experienced traders. It saves time, allows you to build strategies, by combining.
Recommendations for users
Automatic support and resistance indicators are a powerful tool in themselves. But their effectiveness can be further enhanced by manually adjusting the levels to current market conditions. Advanced traders can tailor these levels to more accurately reflect market dynamics. This also allows them to more accurately adapt their strategies to current market conditions, increasing trading efficiency and improving risk management.
Manually adjusting levels
Market structure analysis. Automatically determined levels may not always accurately match current supply and demand zones. Traders can manually adjust these levels based on recent price extremes, trading volumes, and other technical factors. This allows them to take current market sentiment into account and improves the accuracy of their analysis.
Considering time frames. Different time intervals can show different support and resistance levels. Adapting levels to the specific time frame on which you are trading helps you take into account short-term and long-term trends.
Application in consolidation and high volatility conditions
Trading in consolidation periods. During periods when the price moves in a narrow range, accurately identifying support and resistance levels helps to identify the boundaries of this range. This allows traders to open positions on a rebound from the range boundaries, setting stop losses outside the levels to minimize risks.
Trading in high volatility. In conditions of sharp price fluctuations, automatic levels can quickly become outdated. Manual adjustments allow you to quickly adapt the levels to new conditions, providing more accurate signals for entering and exiting trades.
Practical example
Suppose that the market is experiencing high volatility, and the price of an asset quickly breaks through previously set resistance levels. A trader can manually adjust the levels taking into account new price extremes and use these updated levels to determine entry points when the price rolls back to new support levels, previously used as resistance.
Сombine the support and resistance indicator with candlestick formations

One key thing many traders miss when using the support and resistance indicator on MT4 and MT5 is its ability to reveal levels that shift with price movement. Support and resistance are not static—these levels evolve as price changes. By using an automatic indicator, you can easily track these shifting levels and stay in sync with the market. The real magic happens when you look for areas where things match up, like when support and resistance align with moving averages or Fibonacci retracement levels. This combination of indicators leads to stronger and more accurate trade setups, reducing the risk of getting caught in false breakouts.
Another powerful method is to combine the support and resistance indicator with candlesick formations. Instead of just relying on these levels alone, look for formations like pin bars or engulfing patterns at key levels. This gives you stronger confirmation for your trades and helps you make better decisions. Additionally, always adjust your levels to reflect market behavior—during periods of high volatility, support and resistance levels may stretch, and in quieter times, they may contract. This adaptability helps you stay aligned with real market conditions, ensuring your strategy is always in tune with the market’s true movements.
Conclusion
Mastering the support and resistance indicator is essential for traders seeking precision and consistency on MT4 and MT5 platforms. By accurately identifying key price levels, traders can better anticipate market reversals and optimize entry and exit points—whether identifying a bullish breakout above resistance or capitalizing on rebounds at support. Proper setup and interpretation of these indicators strengthen decision-making, reducing reliance on guesswork. Ultimately, the true power of support and resistance lies not just in spotting lines on a chart, but in leveraging these insights to navigate the markets confidently and profitably.
FAQs
Can the Support and Resistance Indicator For Accurate MT4 And MT5 Trading be used effectively on different timeframes?
How does combining the Support and Resistance Indicator For Accurate MT4 And MT5 Trading with oscillators or candlestick patterns improve trading decisions?
What are the key settings available for the Support and Resistance Indicator For Accurate MT4 And MT5 Trading, and how do they affect its functionality?
How do support and resistance levels change during periods of high volatility or market consolidation when using this indicator?
Editors' Top Picks and Insights

Blockchain nation in crisis: How a power struggle split Liberland

Shifting priorities: Governments back mining as businesses turn to AI

Intel's comeback: Apple, Trump and the AI bet

Bitcoin price prediction based on RSI: Is BTC poised for a new rally?

Toncoin becomes Gram: Why Durov restored token's original name

Why Tether flipping Ethereum is a pivotal moment for crypto
Related Articles
Team that worked on the article
Maxim Nechiporenko has been a contributor to Traders Union since 2023. He started his professional career in the media in 2006.
Dan Blystone began his trading career in 1998 as an arbitrage clerk on the floor of the Chicago Mercantile Exchange (CME). He later traded bond and Eurex futures at proprietary firms such as Altea Trading, gaining valuable experience in high-frequency trading and risk management.
Chinmay Soni is a financial analyst with more than 5 years of experience in working with stocks, Forex, derivatives, and other assets. As a founder of a boutique research firm and an active researcher, he covers various industries and fields, providing insights backed by statistical data.
A day trader is an individual who engages in buying and selling financial assets within the same trading day, seeking to profit from short-term price movements.
An investor is an individual, who invests money in an asset with the expectation that its value would appreciate in the future. The asset can be anything, including a bond, debenture, mutual fund, equity, gold, silver, exchange-traded funds (ETFs), and real-estate property.
Bitcoin is a decentralized digital cryptocurrency that was created in 2009 by an anonymous individual or group using the pseudonym Satoshi Nakamoto. It operates on a technology called blockchain, which is a distributed ledger that records all transactions across a network of computers.
In trading, a supply and demand zone refers to specific price levels on a chart where there is an imbalance between buyers (demand) and sellers (supply). A demand zone represents a price area where buying interest is strong, potentially leading to price increases, while a supply zone indicates an area where selling interest is significant, possibly resulting in price declines.
Day trading involves buying and selling financial assets within the same trading day, with the goal of profiting from short-term price fluctuations, and positions are typically not held overnight.

-
 Afghanistan
-
 Albania
-
 Algeria
-
 Angola
-
 Argentina
-
 Armenia
-
 Australia
-
 Austria
-
 Azerbaijan
-
 Bahamas
-
 Bahrain
-
 Bangladesh
-
 Belarus
-
 Belgium
-
 Bolivia
-
 Botswana
-
 Brazil
-
 Brunei
-
 Bulgaria
-
 Cambodia
-
 Cameroon
-
 Canada
-
 Chile
Chile
-
 China
China
-
 Colombia
-
 Congo
Congo
-
 Costa Rica
-
 Cote d'Ivoire
-
 Croatia
-
 Cuba
Cuba
-
 Cyprus
-
 Czechia
-
 DR Congo
-
 Denmark
-
 Dominican Republic
-
 Ecuador
-
 Egypt
Egypt
-
 El Salvador
-
 Estonia
-
 Eswatini
-
 Ethiopia
-
 Finland
-
 France
-
 Georgia
-
 Germany
-
 Ghana
Ghana
-
 Greece
-
 Haiti
Haiti
-
 Hong Kong
-
 Hungary
-
 India
India
-
 Indonesia
-
 Iran, Islamic republic
-
 Iraq
Iraq
-
 Ireland
-
 Israel
-
 Italy
Italy
-
 Jamaica
-
 Japan
Japan
-
 Jordan
-
 Kazakhstan
-
 Kenya
Kenya
-
 Korea
Korea
-
 Kuwait
-
 Kyrgyzstan
-
 Laos
Laos
-
 Latvia
-
 Lebanon
-
 Lesotho
-
 Libya
Libya
-
 Lithuania
-
 Luxembourg
-
 Madagascar
-
 Malaysia
-
 Malta
Malta
-
 Mauritius
-
 Mexico
-
 Moldova
-
 Mongolia
-
 Montenegro
-
 Morocco
-
 Mozambique
-
 Myanmar
-
 Namibia
-
 Nepal
Nepal
-
 Netherlands
-
 New Zealand
-
 Nigeria
-
 North Macedonia
-
 Norway
-
 Oman
Oman
-
 Pakistan
-
 Palestine
-
 Panama
-
 Papua New Guinea
-
 Paraguay
-
 Peru
Peru
-
 Philippines
-
 Poland
-
 Portugal
-
 Puerto Rico
-
 Qatar
Qatar
-
 Reunion
-
 Romania
-
 Rwanda
-
 Saudi Arabia
-
 Serbia
-
 Singapore
-
 Slovakia
-
 Slovenia
-
 Somalia
-
 South Africa
-
 Spain
Spain
-
 Sri Lanka
-
 Sweden
-
 Switzerland
-
 Syria
Syria
-
 Taiwan
-
 Tajikistan
-
 Tanzania
-
 Thailand
-
 Trinidad and Tobago
-
 Tunisia
-
 Turkey
-
 UAE
UAE
-
 Uganda
-
 Ukraine
-
 United Kingdom
-
United States
-
 Uruguay
-
 Uzbekistan
-
 Venezuela
-
 Vietnam
-
 Yemen
Yemen
-
 Zambia
-
 Zimbabwe
- Forex
- Crypto
