How To Use The Fractal Indicator To Spot Market Hesitation And Time Trades Smarter


Editorial Note: While we adhere to strict Editorial Integrity, this post may contain references to products from our partners. Here's an explanation for How We Make Money. None of the data and information on this webpage constitutes investment advice according to our Disclaimer.
The fractal indicator identifies potential market turning points by marking five-bar patterns that signal short-term highs or lows. While often used as reversal signals, their real value lies in showing hesitation in price action — helping traders anticipate shifts when combined with other tools or timeframes.
Many traders treat fractals like just another indicator — more arrows on the chart with little meaning. But their real value lies beneath the surface. A fractal isn’t a signal to jump in; it’s a sign that momentum is shifting. It forms when price pauses, fakes out, or hesitates — and that hesitation tells a story. When a fractal appears, it marks the market taking a breath. Pay attention to how price reacts next, and you’ll uncover trade setups most traders overlook.
Introduction to fractal indicator

The fractal indicator is a simple yet useful tool that helps traders spot where the price might be about to change direction. It highlights small patterns that repeat often — giving you hints about short-term tops and bottoms in the market.
What it actually shows
Marks recent highs and lows
Fractals appear where the price has paused or turned — making them great for spotting possible reversals.Works on any chart
Whether you're trading on a 1-minute or daily timeframe, fractals show up the same way.Adds structure to price action
When the market feels chaotic, fractals help you find those key moments when things might shift.
What the pattern looks like
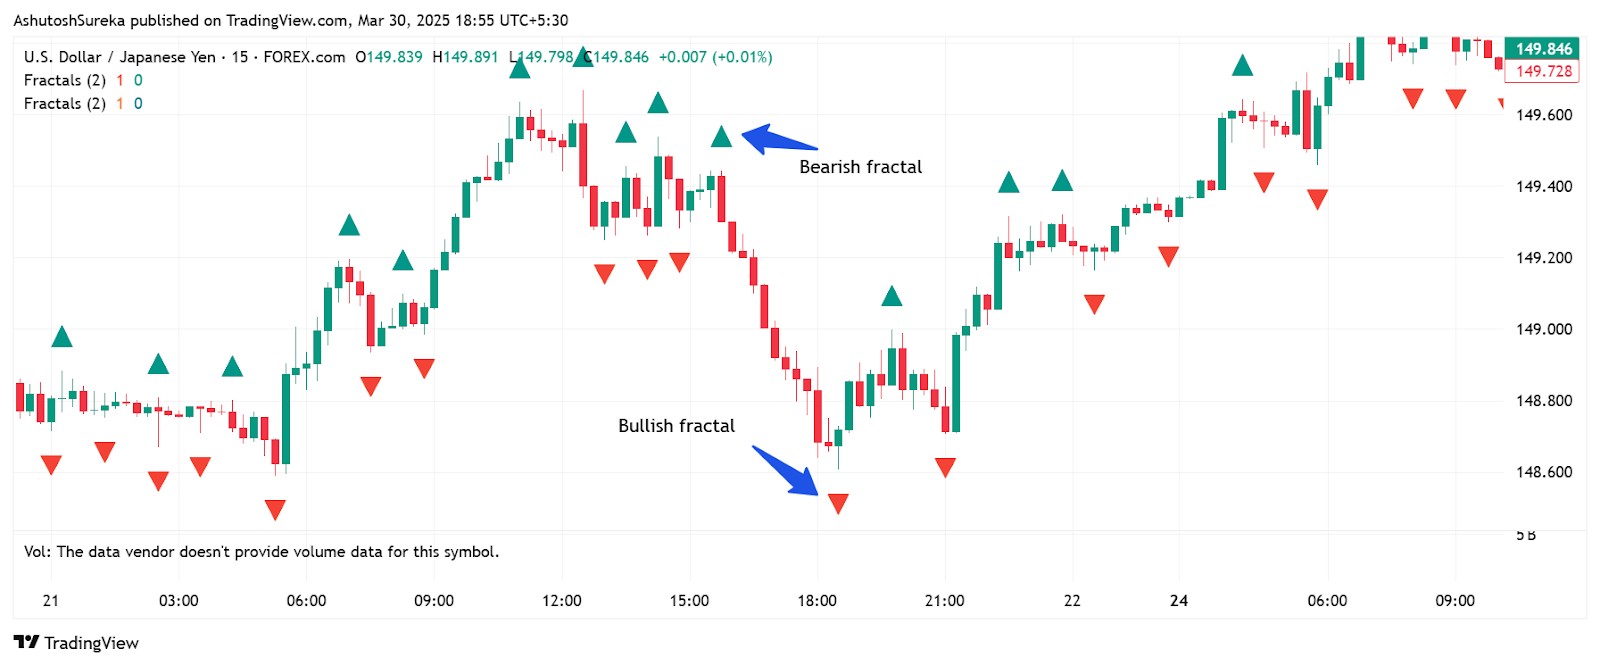
A fractal is made up of five bars or candles and signals two possible outcomes:
Bullish fractal
The middle candle has the lowest low.
The two candles on both sides have higher lows.
This can hint at a short-term bottom forming.
Bearish fractal
The middle candle has the highest high.
The two candles on each side have lower highs.
This can suggest a short-term top is in place.
Platforms usually mark these with arrows above or below the price bars to make them easy to spot.
Origin and development of fractal indicator
The concept of fractals in trading was first introduced by renowned market strategist Bill Williams in his book Trading Chaos (1995). Drawing from chaos theory and behavioral finance, Williams observed that financial markets often move in repetitive, self-similar patterns — much like fractals in mathematics.
He developed the fractal indicator to help traders identify key reversal points and moments of indecision in price action. A fractal, in this context, is a five-bar pattern that signals potential turning points in the market. For instance:
A bullish fractal forms when a high is preceded and followed by two lower highs.
A bearish fractal appears when a low is surrounded by two higher lows.
What set Williams apart was his focus on how markets behave during pauses, not just during strong trends. He believed that these pauses — or "breaths" — often carry hidden insights about upcoming price moves. Fractals were never meant to be used in isolation, but as part of a larger system that includes momentum, volume, and market structure.
Over time, the indicator became popular among technical traders for its ability to filter noise and highlight structure in price movement. Today, it remains a powerful tool for identifying early shifts in sentiment, especially when combined with broader trend analysis.
How traders use it today
Built into most trading platforms
Fractals are included in tools like MetaTrader and can be turned on with a single click.Used for more than reversals
Many traders now use fractals to set breakout levels or draw trendlines — adding even more value to this simple tool.Still relevant
Even though it’s been around for decades, the fractal indicator remains a favorite for traders who value clean, visual setups.
How to set up fractal indicator
The fractal indicator is easy to use and doesn’t take much effort to get started. Most platforms have it ready to go, and once it’s turned on, it does all the work in the background — you just focus on reading the signals.
Access the indicator
Here’s how to find and add it to your chart.
Where to find it
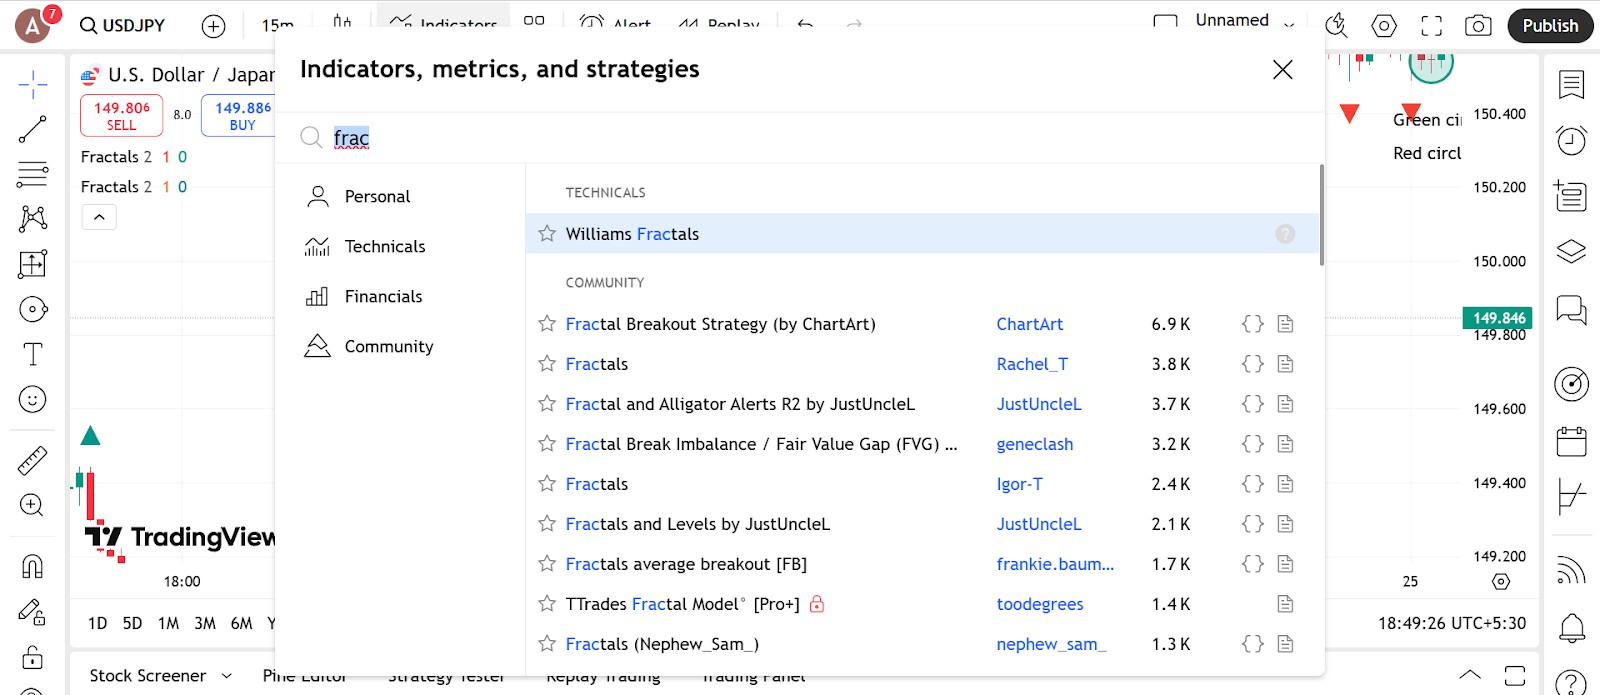
Open the indicators menu
Look for “Fractals” in your platform’s list. It might be under categories like “Trend” or “Bill Williams.”Included on most trading platforms
You’ll find it on MetaTrader, TradingView, and others without needing to install anything extra.Click to apply
Add it to your chart, and you’ll see arrows automatically appear above or below candles that form a fractal.
A few quick tips
Stick to candlestick or bar charts
These show the highs and lows clearly, which is important for spotting fractals.Zoom out a bit
You’ll get a better view of how recent fractals fit into the overall price movement.
Configure the parameters

You don’t need to spend time tweaking settings, but there are a few things you can adjust to make it easier to read.
Basic setup
Standard setting uses 5 candles
That’s two before and two after the middle one — this is what defines a fractal.No extra inputs required
The default configuration is already good for most traders.
Make it easy to see
Change colors or size If the arrows are hard to spot, customize the color or make them bigger.
Set alerts if your platform allows Some platforms let you get a notification when a new fractal appears.
If you want to explore more
Test longer patterns
Some versions let you use more than five candles, but that might delay the signals or reduce how often they show up.Use with other tools
Fractals work great alongside moving averages, trendlines, or support and resistance to add more context.
Trading strategies using fractal indicator
Fractals are great for picking out key highs and lows in price, and they can help you make sense of the chaos on your chart. While they’re not a complete trading system on their own, they fit nicely into different strategies — from reversals to breakouts and even trend trading.
Catching reversals
Fractals often form at short-term tops or bottoms, giving you a heads-up that price might be about to turn.
How to use it
Look for bearish fractals near resistance
If a fractal forms at a recent high — especially near a resistance level — that might be your signal to prepare for a drop.Spot bullish fractals near support
After a big price drop, a bullish fractal near support could mean it’s time for a bounce.
Trading the setup
Wait for a confirmation candle
Don't jump in on the fractal itself. Wait for the next candle to break the opposite way before taking the trade.Set your stop
Place it just beyond the fractal to manage your risk in case price keeps going.
Trading breakouts
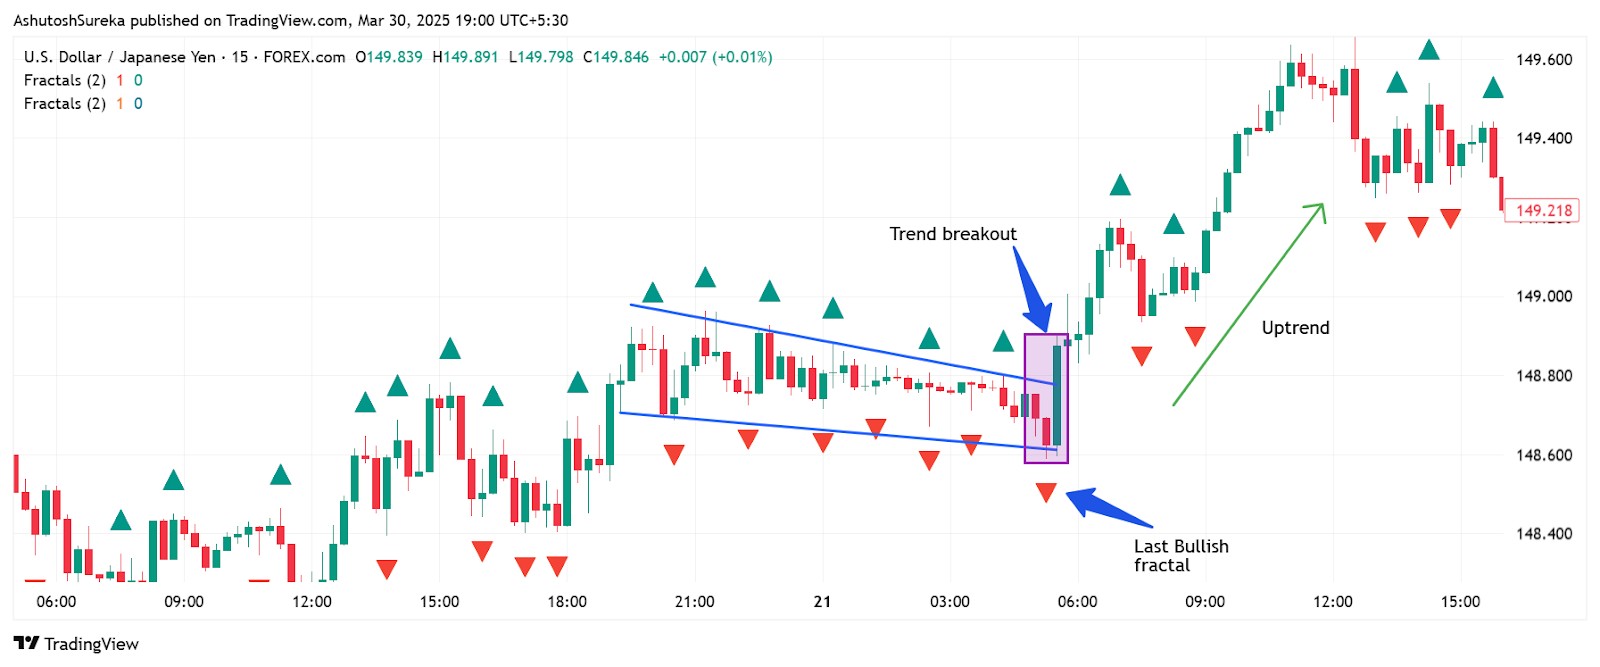
Fractals can also help you trade breakouts — not just reversals.
Draw a range using recent fractals
Use the last few fractal highs and lows to define a short-term range.Trade the breakout
When price breaks above the last bearish fractal or below the last bullish fractal, it may be gearing up for a strong move.
Extra tools to improve it
Watch volume
Breakouts with higher volume tend to stick.Use fractals for stops and targets
Stops just inside the range and targets based on previous swing levels can give you a solid plan.
Combining with moving averages
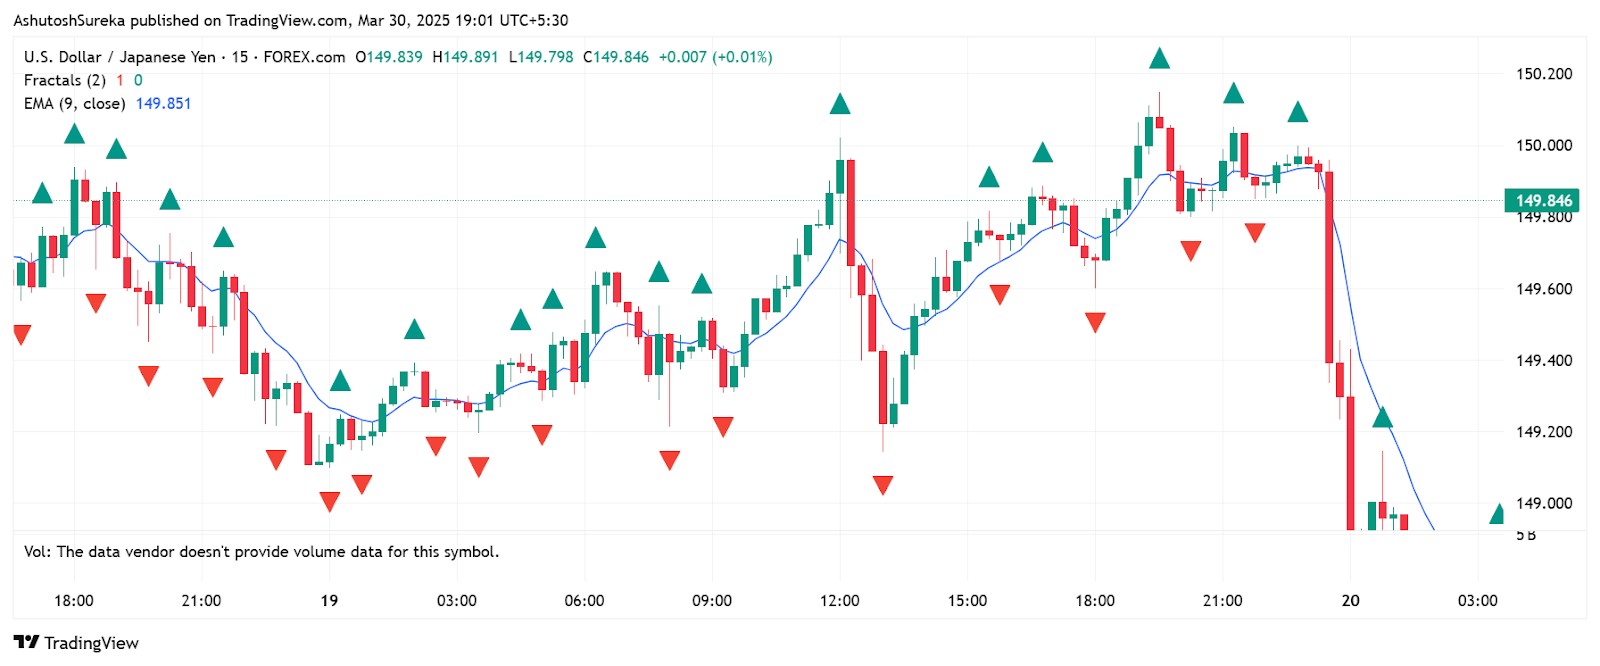
Fractals can also help you trade with the trend if you use them alongside a moving average.
The basic idea
Let the moving average tell you the trend
Use something like a 50-period MA to decide if you're in an uptrend or downtrend.Trade fractals in that direction
If the price is above the MA, only trade bullish fractals. If it's below, focus on bearish ones.
Why it works
Keeps you in sync with the market
Instead of trading every fractal, you focus on the ones that match the overall trend.Helps avoid false signals
Counter-trend trades fail more often — this strategy helps filter them out.
Advantages and limitations of fractal indicator
Fractals are one of those tools that keep things simple. They’re easy to spot, quick to understand, and can fit into almost any trading strategy. Still, like anything else, they have their blind spots. Here’s what’s good — and what to watch out for.
What makes fractals useful
Fractals are a handy way to see what price has been doing — especially when it’s hard to make sense of the chart.
Simple and clear
Easy to see
Once turned on, you’ll spot the arrows above or below candles right away — no need to do the math.No deep settings to tweak
You get the default 5-bar pattern, and for most traders, that’s all you need.
Helps mark important areas
Shows where price has turned before
These turning points can help you plan entries, exits, and stop placements.Works well with other tools
Fractals add clarity to support/resistance zones, trendlines, and even Fibonacci levels.
Fits all types of traders
Good for any timeframe
Whether you’re scalping or holding trades for weeks, the pattern stays the same.
Where fractals can fall short
While they’re helpful, fractals aren’t perfect. Here’s where they might lead you astray if you’re not careful.
Always a little behind
You see the signal two candles later
That’s because it takes five candles to form a full fractal — two before, one middle, and two after.Might miss fast moves
If price moves quickly, the setup might be over before the arrow even appears.
Too many signals in choppy markets
Sideways markets can be noisy In flat conditions, you might see back-to-back fractals that don’t mean much — and trading them could hurt more than help.
No sense of strength Fractals don’t tell you how strong a move is — just that a pattern has formed.
Not enough on their own
Shouldn’t be used by themselves
Fractals work best as a confirmation tool, not the main reason to take a trade.They follow price, not predict it
The indicator shows what just happened — not what’s about to happen.
We've selected a list of trusted brokers that support advanced charting tools like the fractal indicator to help traders make smarter, more precise decisions.
| eToro USA | Plus500 | eOption | Revolut | Interactive Brokers | |
|---|---|---|---|---|---|
|
Foundation year |
2007 | 2008 | 2007 | 2015 | 1978 |
|
Account min. |
50 | EUR500 | No | No | No |
|
Demo |
Yes | Yes | Yes | No | Yes |
|
Deposit Fee |
No | No | Not specified | No | No |
|
Withdrawal fee |
No | No | Not specified | No charge up to a limit | No |
|
Regulation |
SEC, FINRA | CySEC, FCA, ASIC, FMA, FSCA, FSA Seychelles, EFSA, MAS, DFSA, SCB | FINRA, SIPC | FCA, SEC, FINRA | SEC, FINRA, SIPC, FCA, NSE, BSE, SEBI, SEHK, HKFE, IIROC, ASIC, CFTC, NFA |
|
TU overall score |
8.8 | 8.48 | 7.93 | 8.6 | 8.53 |
|
Open an account |
Go to broker Your capital is at risk. |
Go to broker 80% of retail CFD accounts lose money. |
Study review | Study review | Study review |
Why trust us
15+ years of independent market analysis
140+ evaluation criteria, reviewed by 50+ experts
Data-driven reviews of 200+ platforms, updated regularly
20+ industry awards & a wide network of global media partners
Learn more about our methodology and editorial policies.


Fractals as failure points that reveal hidden trade setups

Most beginners mess up with fractals because they blindly trade them the second they pop up. But here’s the truth: a fractal often shows up right where traders get faked out. Instead of reacting to it, wait and see how price behaves around it. If it breaks just above that fractal high and then drops hard — that’s your real setup. It’s not the fractal that matters — it’s how price doesn’t hold up afterward that gives you your shot.
Want to flip the way you use fractals completely? Spot them on the bigger time frame, then drop down and go the other way — but only if price fails to follow through. Let’s say you’ve got a bearish fractal on the daily, but price can’t even break the low. That’s your cue. Switch to a lower time frame and look for a fast bounce in the opposite direction. Most traders wait for confirmation. You’re watching what happens when price can’t deliver. That’s when fractals stop being noise — and actually become useful.
Conclusion
In summary, mastering the fractal indicator can transform the way traders interpret market dynamics, uncovering critical pauses that often precede significant price movements. By discerning genuine breakout signals from false alarms, traders gain a decisive edge—whether catching the early momentum of a bullish breakout or anticipating a reversal after a pattern of price hesitation. For instance, utilizing fractals alongside trend-following tools can confirm the strength of a move, while applying them in consolidating markets may spotlight emerging opportunities. Ultimately, the true power of the fractal indicator lies not just in its signals, but in the trader’s ability to contextualize them—proving that success in trading stems from reading between the lines of market behavior.
FAQs
How does the fractal indicator complement other technical analysis tools?
What is the role of confirmation candles when trading with the fractal indicator?
Can customizing the fractal indicator's appearance improve usability?
What are the main limitations of using only the fractal indicator for trading decisions?
Editors' Top Picks and Insights

SK Hynix debuts on Nasdaq: Largest U.S. offering by foreign company

SpaceX falls out of orbit: Does anyone still want Musk’s stock?

The crypto IPO problem: How high-profile listings became investor traps

U.S. Bitcoin reserve: Trump’s unrealized crypto promise

Aiming for leadership: Payment giants prepare a new stablecoin

Proof of Reserves: the new standard for cryptocurrency exchanges
Related Articles
Team that worked on the article
Rinat Gismatullin is an entrepreneur and a business expert with 9 years of experience in trading. He focuses on long-term investing, but also uses intraday trading.
Dan Blystone began his trading career in 1998 as an arbitrage clerk on the floor of the Chicago Mercantile Exchange (CME). He later traded bond and Eurex futures at proprietary firms such as Altea Trading, gaining valuable experience in high-frequency trading and risk management.
Chinmay Soni is a financial analyst with more than 5 years of experience in working with stocks, Forex, derivatives, and other assets. As a founder of a boutique research firm and an active researcher, he covers various industries and fields, providing insights backed by statistical data.
Breakout trading is a trading strategy that focuses on identifying and profiting from significant price movements that occur when an asset's price breaches a well-defined level of support or resistance.
CFD is a contract between an investor/trader and seller that demonstrates that the trader will need to pay the price difference between the current value of the asset and its value at the time of contract to the seller.
Index in trading is the measure of the performance of a group of stocks, which can include the assets and securities in it.
Risk management is a risk management model that involves controlling potential losses while maximizing profits. The main risk management tools are stop loss, take profit, calculation of position volume taking into account leverage and pip value.
Forex trading, short for foreign exchange trading, is the practice of buying and selling currencies in the global foreign exchange market with the aim of profiting from fluctuations in exchange rates. Traders speculate on whether one currency will rise or fall in value relative to another currency and make trading decisions accordingly. However, beware that trading carries risks, and you can lose your whole capital.

-
 Afghanistan
-
 Albania
-
 Algeria
-
 Angola
-
 Argentina
-
 Armenia
-
 Australia
-
 Austria
-
 Azerbaijan
-
 Bahamas
-
 Bahrain
-
 Bangladesh
-
 Belarus
-
 Belgium
-
 Bolivia
-
 Botswana
-
 Brazil
-
 Brunei
-
 Bulgaria
-
 Cambodia
-
 Cameroon
-
 Canada
-
 Chile
Chile
-
 China
China
-
 Colombia
-
 Congo
Congo
-
 Costa Rica
-
 Cote d'Ivoire
-
 Croatia
-
 Cuba
Cuba
-
 Cyprus
-
 Czechia
-
 DR Congo
-
 Denmark
-
 Dominican Republic
-
 Ecuador
-
 Egypt
Egypt
-
 El Salvador
-
 Estonia
-
 Eswatini
-
 Ethiopia
-
 Finland
-
 France
-
 Georgia
-
 Germany
-
 Ghana
Ghana
-
 Greece
-
 Haiti
Haiti
-
 Hong Kong
-
 Hungary
-
 India
India
-
 Indonesia
-
 Iran, Islamic republic
-
 Iraq
Iraq
-
 Ireland
-
 Israel
-
 Italy
Italy
-
 Jamaica
-
 Japan
Japan
-
 Jordan
-
 Kazakhstan
-
 Kenya
Kenya
-
 Korea
Korea
-
 Kuwait
-
 Kyrgyzstan
-
 Laos
Laos
-
 Latvia
-
 Lebanon
-
 Lesotho
-
 Libya
Libya
-
 Lithuania
-
 Luxembourg
-
 Madagascar
-
 Malaysia
-
 Malta
Malta
-
 Mauritius
-
 Mexico
-
 Moldova
-
 Mongolia
-
 Montenegro
-
 Morocco
-
 Mozambique
-
 Myanmar
-
 Namibia
-
 Nepal
Nepal
-
 Netherlands
-
 New Zealand
-
 Nigeria
-
 North Macedonia
-
 Norway
-
 Oman
Oman
-
 Pakistan
-
 Palestine
-
 Panama
-
 Papua New Guinea
-
 Paraguay
-
 Peru
Peru
-
 Philippines
-
 Poland
-
 Portugal
-
 Puerto Rico
-
 Qatar
Qatar
-
 Reunion
-
 Romania
-
 Rwanda
-
 Saudi Arabia
-
 Serbia
-
 Singapore
-
 Slovakia
-
 Slovenia
-
 Somalia
-
 South Africa
-
 Spain
Spain
-
 Sri Lanka
-
 Sweden
-
 Switzerland
-
 Syria
Syria
-
 Taiwan
-
 Tajikistan
-
 Tanzania
-
 Thailand
-
 Trinidad and Tobago
-
 Tunisia
-
 Turkey
-
 UAE
UAE
-
 Uganda
-
 Ukraine
-
 United Kingdom
-
United States
-
 Uruguay
-
 Uzbekistan
-
 Venezuela
-
 Vietnam
-
 Yemen
Yemen
-
 Zambia
-
 Zimbabwe
- Forex
- Crypto
