How To Use Market Structure In Forex Trading


Editorial Note: While we adhere to strict Editorial Integrity, this post may contain references to products from our partners. Here's an explanation for How We Make Money. None of the data and information on this webpage constitutes investment advice according to our Disclaimer.
How to use market structure in Forex trading:
Identify the trend.
Recognize key levels.
Use swing points.
Look for Breakouts & Retests.
Apply confluence.
Adjust stop-loss & take-profit.
For beginners in trading, understanding Forex market structures is a fundamental step toward making informed decisions. This guide provides an in-depth look at market structures, explaining key concepts, their role in price action, and how traders can leverage them for financial success. We'll explore the characteristics of different market conditions, how they operate, and strategies traders can use to capitalize on these trends. So, get comfortable and immerse yourself in the essentials of Forex market structures!

What is market structure in Forex?
Forex market structure is the framework that governs how buyers and sellers interact in the global currency market. It helps traders understand price movements, market trends, and overall sentiment. Instead of being centralized like stock exchanges, Forex operates through a network of banks, financial institutions, and individual traders, each playing a role in shaping price action.
At its core, market structure is driven by key participants: major institutions, retail traders, and liquidity providers. It also reflects how currency pairs behave in terms of trends, volume, and volatility. By analyzing these elements, traders can identify potential entry and exit points, anticipate market shifts, and make well-informed trading decisions.
How to use market structure in Forex trading
Identify the trend – determine if the market is in an uptrend (higher highs, higher lows), downtrend (lower highs, lower lows), or range-bound.
Recognize key levels – mark support and resistance zones where price reacts frequently.
Use swing points – analyze recent swing highs and lows to understand price direction and momentum.
Look for breakouts & retests – confirm trend continuation or reversal when price breaks key levels and retests them.
Apply confluence – combine market structure with indicators like moving averages or Fibonacci levels for stronger signals.
Adjust stop-loss & take-profit – place stops beyond key structure levels to reduce risk and maximize reward.
Understanding market structure is only effective when traders can apply it in a real trading environment. To execute breakouts, retests, and precise entries based on structure, traders need a broker that offers tight spreads, fast execution, and full support for technical analysis tools. The table below highlights Forex brokers commonly used by traders who rely on market structure and price action strategies.
| zForex | Plus500 | OANDA | Trading.com USA | FOREX.com | |
|---|---|---|---|---|---|
|
Min. deposit, $ |
10 | 100 | No | 50 | 100 |
|
Tradable assets |
80 | 2800 | 129 | 69 | 5500 |
|
Standard EUR/USD spread |
0.3 | 0.7 | 0.3 | 1.1 | 1.0 |
|
Max. leverage |
1:1000 | 1:300 | 1:200 | 1:50 | 1:50 |
|
Max. Regulation Level |
Not regulated | Tier-1 | Tier-1 | Tier-1 | Tier-1 |
|
TU overall score |
8.05 | 7.57 | 6.89 | 6.15 | 6.87 |
|
Open an account |
Go to broker Your capital is at risk.
|
Go to broker 80% of retail CFD accounts lose money. |
Go to broker Your capital is at risk. |
Go to broker Your capital is at risk. |
Study review |
Types of Forex market structures
Understanding market structures is a crucial advantage in the ever-changing world of Forex trading. Market conditions influence price movements and trading strategies, making it essential to recognize the three primary market structures: bullish, bearish, and sideways trends. Let’s break them down and analyze their impact on trading strategies.
Bullish market structure
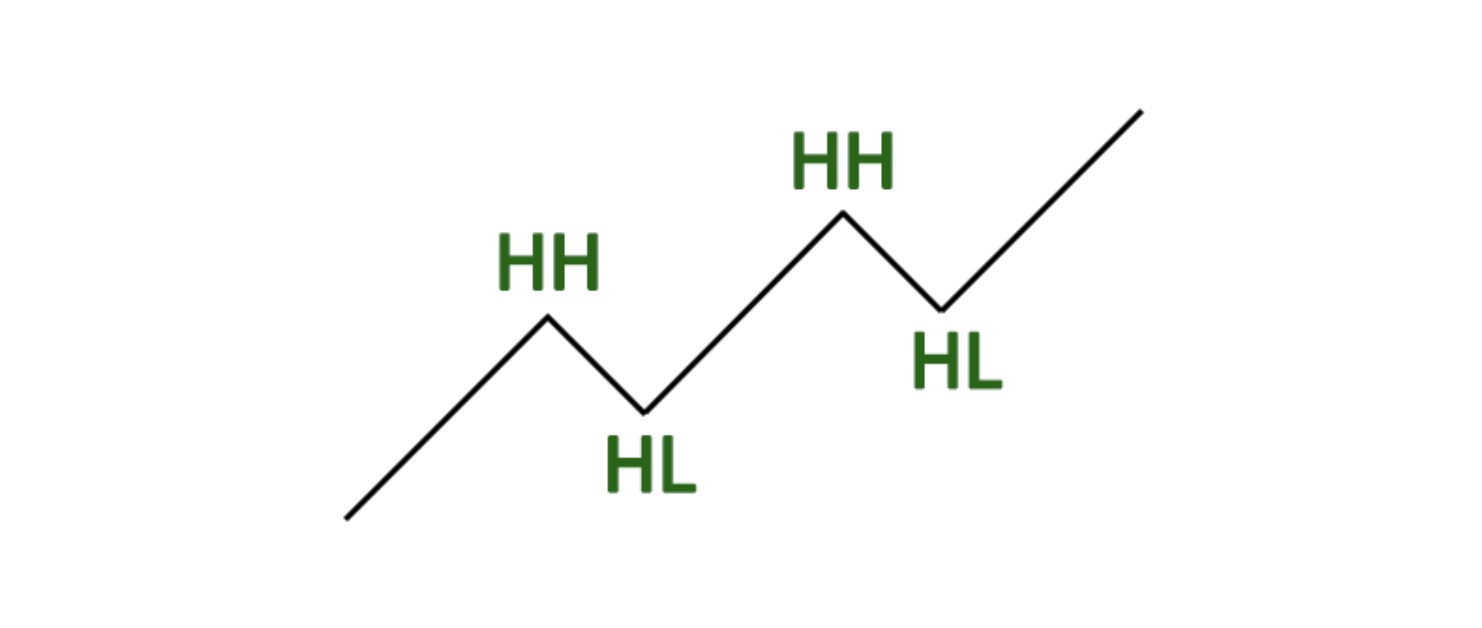
A bullish market structure is characterized by an upward trend, where buyers dominate the market, pushing prices higher. Traders in a bullish market anticipate future price increases, creating a cycle of optimism that sustains the uptrend.
A bullish trend consists of higher highs (HH) and higher lows (HL), signifying continuous upward momentum. The trend remains intact until the price forms a lower low (LL), signaling a potential reversal.
Example of a bullish structure
The daily chart of ETSY stock demonstrates an uptrend with a series of higher highs and higher lows. However, a green box highlights a point where the price reaches an equal low. For the uptrend to persist, the price must break above the 250 resistance level.
Why traders favor bullish markets:
Increased buying pressure and strong investor confidence;
Positive economic news fuels further price appreciation;
High trading volumes support sustained upward movement.
A bullish market offers lucrative trading opportunities, encouraging investors to take risks and capitalize on growth potential. As the saying goes, when the bulls are charging, it's time to ride the momentum!
Bearish market structure
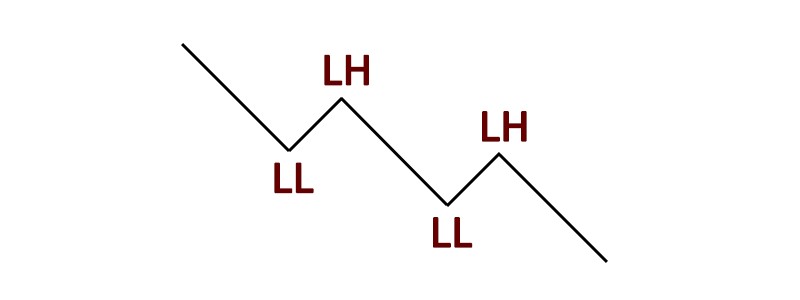
A bearish market structure represents a sustained downtrend where sellers overpower buyers, driving prices lower. This market condition is identified by lower highs (LH) and lower lows (LL), reflecting declining investor confidence and strong selling pressure.
Key features of a bearish market structure:
Lower highs: the price fails to reach previous peaks, confirming a weakening market.
Lower lows: continuous drops in price indicate downward momentum.
Breakouts: support levels are frequently broken, triggering further selling.
Momentum: bearish trends often accelerate as traders rush to exit positions.
Volume: trading volume spikes as selling pressure intensifies.
Example of a bearish structure
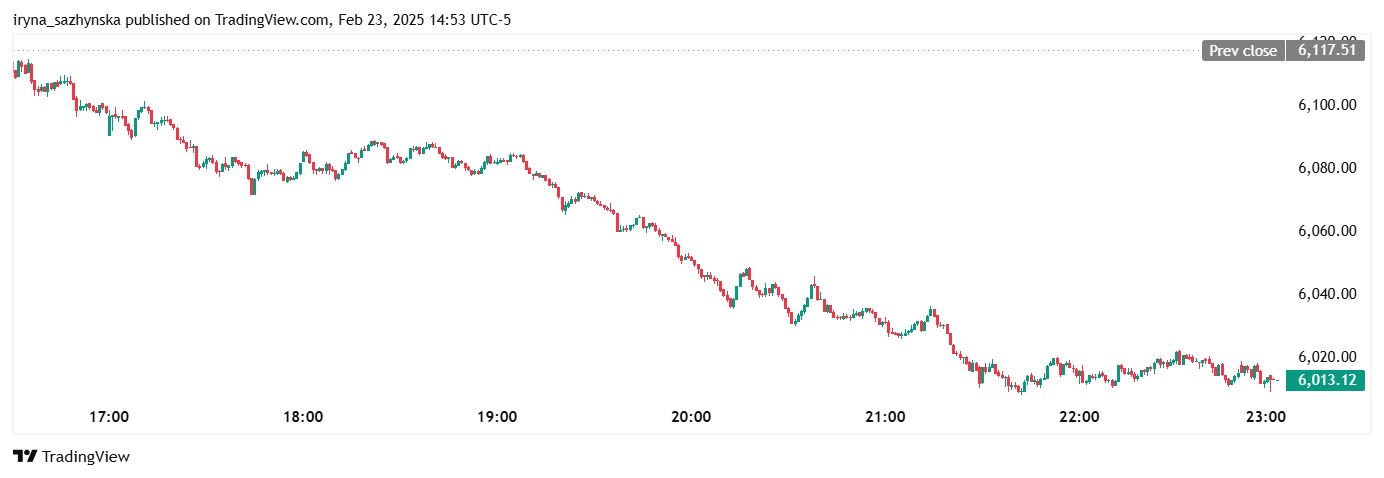
A TESLA stock chart illustrates a classic bearish trend, with progressively lower highs and lower lows, showing a strong downward push.
In bearish markets, traders often shift to short-selling strategies or seek safe-haven assets to hedge against losses. Identifying a bearish structure early can help traders mitigate risks and adjust their strategies accordingly.
Sideways market structure (Consolidation)
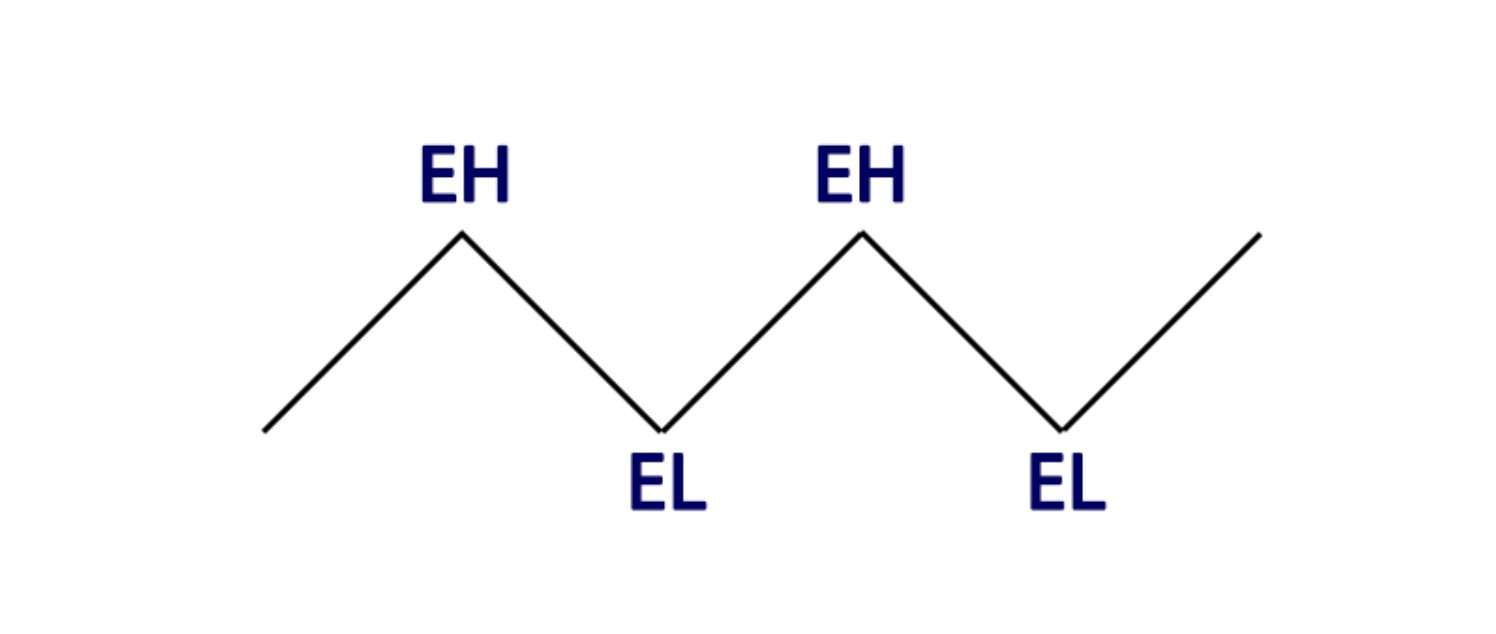
A sideways market, also known as a choppy or range-bound market, occurs when prices move within a restricted range without significant upward or downward trends. This structure is marked by indecisiveness among traders, leading to low volatility and uncertain price action.
Characteristics of a sideways market:
Price fluctuates within a narrow range, forming equal highs (EH) and equal lows (EL).
Trading volume is relatively low, reflecting hesitation among market participants.
Price action appears choppy, making it difficult to establish strong trends.
The market tests support and resistance levels multiple times before eventually breaking out.
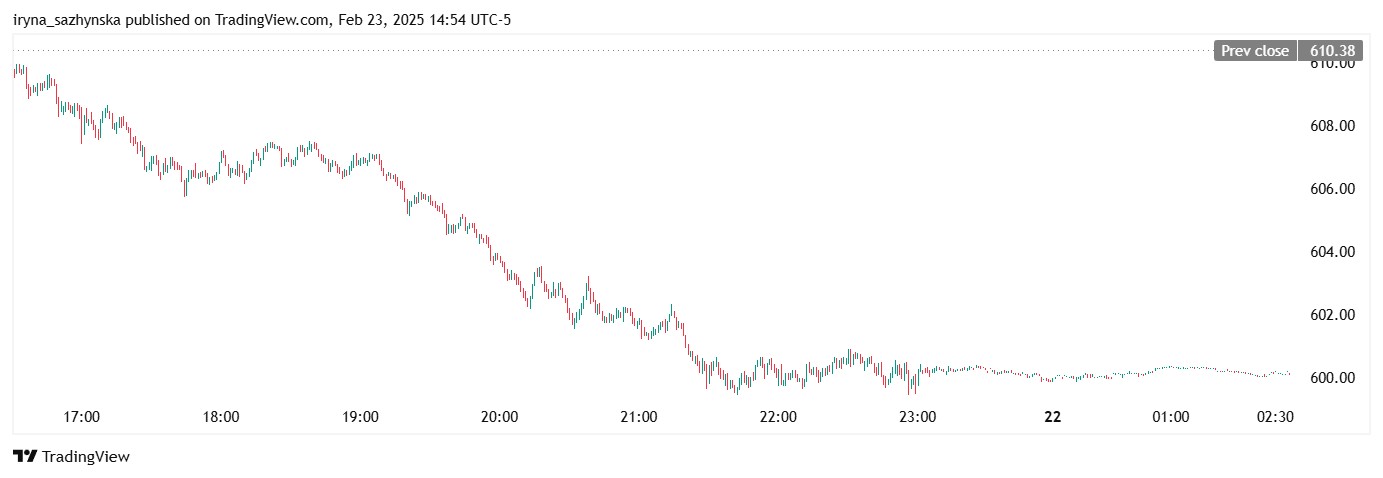
Example of a sideways market
A sideways price movement can be seen when assets consolidate before a significant breakout. While these markets lack clear direction, they often precede strong price movements, providing breakout opportunities for traders.
Recognizing and understanding bullish, bearish, and sideways market structures is crucial for any Forex trader. Each market type presents different challenges and opportunities, requiring tailored strategies to maximize potential gains. Whether capitalizing on bullish momentum, navigating bearish declines, or preparing for breakout moves in a sideways market, a deep understanding of market structures can significantly enhance trading success.
How to identify market structure in Forex
Recognizing market structure in Forex involves analyzing price movements and using various tools to determine trends and patterns. Here are some key methods:
Analyze price action. Observing candlestick patterns and overall price behavior helps in identifying the prevailing market structure.
Identify key levels. Support and resistance zones indicate where price movements may reverse or continue, shaping the market structure.
Assess market trends. Determining whether the market is trending upward, downward, or sideways provides valuable insight into structure.
Utilize technical indicators. Tools like moving averages, RSI, and MACD can confirm trends and structural shifts.
Monitor volatility. High volatility often signals market structure changes, offering opportunities for strategic adjustments.
By combining these techniques, traders can gain a clearer understanding of market conditions and make informed trading decisions.
Examples of market structure charts
A 10-minute chart of the S&P 500 reveals its micro-structure, highlighting how 4-hour support levels reinforce the ongoing uptrend. These key levels act as strong price zones where buyers maintain control.
By analyzing the higher highs (HH) and higher lows (HL) of a bullish trend, traders can pinpoint potential entry points for a long position. Price retracements often occur, either testing the previous breakout level or revisiting the impulse move that led to a new high, providing strategic opportunities for continuation trades.
The daily chart of SPY clearly shows the presence of higher highs and higher lows.
How to improve your use of Forex market structure charts
Enhancing your ability to read Forex market structure charts can improve your trading decisions. Here are some practical strategies to refine your approach:
1. Use multiple time frames
Analyzing different time frames, such as daily, hourly, and 15-minute charts, gives a broader view of trends and market structure. Higher time frames help spot overall trends, while lower time frames offer precise entry and exit points. For example, a trader may notice a bullish trend on the daily chart and use the hourly chart to time their trade.
2. Compare different currency pairs
Looking at multiple currency pairs helps identify patterns, correlations, and opportunities. Some pairs move in sync, while others move in opposite directions. Comparing different markets allows traders to choose the best setup based on momentum and trend strength.
3. Use technical indicators wisely
Indicators like moving averages, RSI, and MACD help spot trends, momentum shifts, and potential reversals. These tools should complement market structure analysis rather than replace it. A trader might use a 50-day moving average to gauge the trend and RSI to confirm whether an asset is overbought or oversold.
4. Practice on demo accounts
Trading with a demo account allows traders to test strategies and understand market behavior without risking real money. Practicing in real-time conditions helps refine decision-making and build confidence before trading with actual funds.
5. Identify role reversals
When a key support level breaks, it often turns into resistance, and vice versa. Recognizing these shifts helps traders anticipate future price movements. For example, if a price falls below a strong support level and then retests it, that level may now act as resistance, creating a potential selling opportunity.
6. Consider the bigger picture
Market structure should always be viewed within the broader context of price action and overall conditions. Economic data, central bank policies, and geopolitical events can impact price movements. Even strong technical setups can fail if external factors contradict them.
7. Wait for confirmation
Rushing into trades without confirmation can lead to losses. Waiting for price action, volume changes, or additional signals before entering a trade increases the chances of success. For instance, if a trader spots a reversal pattern, they might wait for a strong breakout or a close above a key level before taking action.
Why is market structure essential for traders?
Top traders emphasize that understanding market structure is fundamental to mastering the Forex market. It serves as the foundation for analyzing price behavior and making strategic decisions.
By studying trends and patterns, traders can identify profitable opportunities, avoid unnecessary risks, and refine their trading approach. Ignoring market structure often leads to misjudged trades and significant losses.
A strong grasp of market structure allows traders to:
Spot key price levels, such as support, resistance, and breakout zones.
Recognize trend shifts and adjust strategies accordingly.
Manage risk effectively by identifying areas of high volatility or low liquidity.
For instance, if a trader sees strong buying pressure, they might enter a long position, anticipating an upward move. Conversely, in a seller-dominated market, they could opt for a short position to capitalize on a downtrend.
Understanding market structure is not just useful — it’s critical for any trader looking to navigate the Forex market with confidence and precision.
When price briefly breaks a key level but instantly snaps back with heavy volume, that’s smart money entering

Forget textbook strategies — if you really want an edge, start thinking like the big players. Market makers love tricking retail traders with liquidity traps, pushing prices just past obvious support and resistance levels to trigger stop-losses before reversing hard. The best way to spot these traps? Watch for fake breakouts with sharp wicks, especially during volatile sessions. When price briefly breaks a key level but instantly snaps back with heavy volume, that’s smart money entering. Instead of reacting emotionally, wait for confirmation — a strong reversal candle or a quick retest — before jumping in.
Another game-changer? Timing your trades based on liquidity cycles. The market isn’t random — it moves with the flow of institutional orders. The most explosive price action happens when the London and New York sessions overlap, roughly between 7-10 AM GMT and 1-4 PM GMT. That’s when big players step in, creating momentum. Instead of overtrading, focus on these high-impact windows. You’ll avoid slow, frustrating price action and position yourself alongside serious money, not against it.
Conclusion
Mastering market structure is essential for any forex trader aiming to navigate the markets with confidence and precision. By recognizing patterns such as higher highs and lower lows, traders unlock powerful clues about trend direction and potential reversals—for instance, identifying a clean series of higher highs can signal a robust uptrend. Utilizing market structure charts further refines your analysis, allowing you to adapt your strategy to real-time market conditions. Ultimately, understanding and leveraging market structure transforms guesswork into calculated decisions, giving traders a formidable edge in the dynamic world of forex.
FAQs
How does using multiple time frames improve market structure analysis in Forex trading?
What is the significance of swing points when using market structure in Forex trading?
How can traders identify breakout and retest opportunities based on market structure?
What are the main differences between bullish, bearish, and sideways market structures in Forex?
Editors' Top Picks and Insights

Lean Ethereum: Why Buterin wants to rebuild the network

SK Hynix debuts on Nasdaq: Largest U.S. offering by foreign company

SpaceX falls out of orbit: Does anyone still want Musk’s stock?

The crypto IPO problem: How high-profile listings became investor traps

U.S. Bitcoin reserve: Trump’s unrealized crypto promise

Aiming for leadership: Payment giants prepare a new stablecoin
Related Articles
Team that worked on the article
Parshwa is a content expert and finance professional possessing deep knowledge of stock and options trading, technical and fundamental analysis, and equity research. As a Chartered Accountant Finalist, Parshwa also has expertise in Forex, crypto trading, and personal taxation.
Dan Blystone began his trading career in 1998 as an arbitrage clerk on the floor of the Chicago Mercantile Exchange (CME). He later traded bond and Eurex futures at proprietary firms such as Altea Trading, gaining valuable experience in high-frequency trading and risk management.
Chinmay Soni is a financial analyst with more than 5 years of experience in working with stocks, Forex, derivatives, and other assets. As a founder of a boutique research firm and an active researcher, he covers various industries and fields, providing insights backed by statistical data.
A long position in Forex, represents a positive outlook on the future value of a currency pair. When a trader assumes a long position, they are essentially placing a bet that the base currency in the pair will appreciate in value compared to the quote currency.
Forex indicators are tools used by traders to analyze market data, often based on technical and/or fundamental factors, to make informed trading decisions.
Overtrading is a phenomenon where a trader executes too many transactions in the market, surpassing their strategy and trading more frequently than planned. It's a common mistake that can lead to financial losses.
Risk management is a risk management model that involves controlling potential losses while maximizing profits. The main risk management tools are stop loss, take profit, calculation of position volume taking into account leverage and pip value.
Cryptocurrency is a type of digital or virtual currency that relies on cryptography for security. Unlike traditional currencies issued by governments (fiat currencies), cryptocurrencies operate on decentralized networks, typically based on blockchain technology.

-
 Afghanistan
-
 Albania
-
 Algeria
-
 Angola
-
 Argentina
-
 Armenia
-
 Australia
-
 Austria
-
 Azerbaijan
-
 Bahamas
-
 Bahrain
-
 Bangladesh
-
 Belarus
-
 Belgium
-
 Bolivia
-
 Botswana
-
 Brazil
-
 Brunei
-
 Bulgaria
-
 Cambodia
-
 Cameroon
-
 Canada
-
 Chile
Chile
-
 China
China
-
 Colombia
-
 Congo
Congo
-
 Costa Rica
-
 Cote d'Ivoire
-
 Croatia
-
 Cuba
Cuba
-
 Cyprus
-
 Czechia
-
 DR Congo
-
 Denmark
-
 Dominican Republic
-
 Ecuador
-
 Egypt
Egypt
-
 El Salvador
-
 Estonia
-
 Eswatini
-
 Ethiopia
-
 Finland
-
 France
-
 Georgia
-
 Germany
-
 Ghana
Ghana
-
 Greece
-
 Haiti
Haiti
-
 Hong Kong
-
 Hungary
-
 India
India
-
 Indonesia
-
 Iran, Islamic republic
-
 Iraq
Iraq
-
 Ireland
-
 Israel
-
 Italy
Italy
-
 Jamaica
-
 Japan
Japan
-
 Jordan
-
 Kazakhstan
-
 Kenya
Kenya
-
 Korea
Korea
-
 Kuwait
-
 Kyrgyzstan
-
 Laos
Laos
-
 Latvia
-
 Lebanon
-
 Lesotho
-
 Libya
Libya
-
 Lithuania
-
 Luxembourg
-
 Madagascar
-
 Malaysia
-
 Malta
Malta
-
 Mauritius
-
 Mexico
-
 Moldova
-
 Mongolia
-
 Montenegro
-
 Morocco
-
 Mozambique
-
 Myanmar
-
 Namibia
-
 Nepal
Nepal
-
 Netherlands
-
 New Zealand
-
 Nigeria
-
 North Macedonia
-
 Norway
-
 Oman
Oman
-
 Pakistan
-
 Palestine
-
 Panama
-
 Papua New Guinea
-
 Paraguay
-
 Peru
Peru
-
 Philippines
-
 Poland
-
 Portugal
-
 Puerto Rico
-
 Qatar
Qatar
-
 Reunion
-
 Romania
-
 Rwanda
-
 Saudi Arabia
-
 Serbia
-
 Singapore
-
 Slovakia
-
 Slovenia
-
 Somalia
-
 South Africa
-
 Spain
Spain
-
 Sri Lanka
-
 Sweden
-
 Switzerland
-
 Syria
Syria
-
 Taiwan
-
 Tajikistan
-
 Tanzania
-
 Thailand
-
 Trinidad and Tobago
-
 Tunisia
-
 Turkey
-
 UAE
UAE
-
 Uganda
-
 Ukraine
-
 United Kingdom
-
United States
-
 Uruguay
-
 Uzbekistan
-
 Venezuela
-
 Vietnam
-
 Yemen
Yemen
-
 Zambia
-
 Zimbabwe
- Forex
- Crypto
