Why The Fibonacci Indicator Is Important
The Fibonacci indicator is used to reveal price levels where the price action of a financial security may find support or resistance. It is most commonly used by traders to help them determine a potentially advantageous market entry price.
Fibonacci retracement levels are one technical indicator that I believe that every trader needs to understand and be aware of. Why? – Because literally tens of millions of traders buy and sell based on Fibonacci trading. That fact alone means that you’re likely to see substantial buying and selling activity around the price levels that represent Fibonacci retracements. If you’re not aware of the current Fibonacci retracement levels in a market, you may be left wondering – and missing out on a good buy or sell opportunity - when price takes off from a price level that’s nowhere close to any price where your chosen trading strategy would signal a trade.
I’m not saying that your trading strategy should necessarily be Fibonacci trading. I’m just suggesting that, regardless of your strategy, it’s a good idea to monitor the Fibonacci levels. Fibonacci retracement price levels are often the turning point when a downside retracement in an overall uptrend, or an upside retracement in an overall downtrend, ends and price begins moving back in the direction of the overall controlling trend.
Personally, I don’t typically use Fibonacci as my primary source of buy and sell signals, but I still have the Fibonacci retracement levels loaded on my price charts so that I can clearly see them. Again, that’s simply because so many traders do buy and sell at Fibonacci retracements, thus making Fibonacci always a potentially significant technical indicator.
This article explains Fibonacci retracements and exactly how they are utilized by traders to generate buy and sell signals, complete with examples. Fibonacci trading is relatively easy to understand, and most charting programs have a Fibonacci retracements indicator already loaded and available to use.
So, Who’s Fibonacci?
Fibonacci was a famous Italian mathematician in the 12th century. After doing a lot of playing around with numbers, he came up with what’s called the Fibonacci number sequence.
The Fibonacci sequence is as follows:
0,1,1,2,3,5,8,13,21,34,55,89…and so on
In Fibonacci’s numerical sequence, after you get past the first two numbers – 0 and 1 - each successive number in the sequence is equal to the sum of the two previous numbers. For example, 13=8+5.
Okay, that’s kind of neat and interesting, but how did we jump from there to the Fibonacci retracement levels and Fibonacci trading? Well, Fibonacci wasn’t content with just discovering an interesting number sequence. He continued examining the sequence and eventually discovered a second characteristic that it had – a specific ratio relationship between the numbers in the sequence. Each number in the Fibonacci sequence equals approximately the previous number multiplied by 1.618.
This ratio of 1.618 came to be known as the “golden ratio” after other scientists, who were familiar with Fibonacci’s work, observed that the ratio seemed to also exist and recur throughout natural phenomena, in everything from plants, to the human body, to even astronomy.
The Fibonacci retracement levels that are so widely used in financial market trading were the result of Fibonacci expanding his observations to additional related ratios. For example, one of the primary Fibonacci retracement levels is a 61.8% retracement. That ratio is derived by dividing any number in the Fibonacci sequence by the immediately following number in the sequence. Another key Fib ratio – 38.2% - can be obtained by dividing any number in the sequence by the second following number (e.g., 13 divided by 34). The 38.2 ratio is the inverse of the 61.8 ratio, or the result of subtracting 61.8 from 100.
Two other Fibonacci ratios – 23.6 and 76.4 – are arrived at by dividing a Fib number by the third succeeding number (e.g., 13 divided by 55). That gives you 23.6, and the inverse of 23.6% is 76.4%.
Using the Fibonacci Ratios in Trading
The Fibonacci ratios are used by traders to identify:
-
Potential price support levels when a downside retracement occurs in an overall uptrend, or
-
Potential resistance levels when an upside retracement occurs in an overall downtrend
Here’s a very simple example: If the price of a stock moved from $1 to $100, and then experienced a corrective retracement to the downside, Fibonacci traders would look for a price support level to potentially develop around $61.8, which would represent a 38.2% retracement of the move from $1 to $100.
When a traded security’s price approaches a price level that matches a Fibonacci ratio level, traders look for price action indicating that the market has encountered significant support/resistance. A trader may then consider entering the market in the expectation that price movement will be reversing back in the direction of the overall controlling trend.
The Fibonacci retracement levels that are usually considered most important are the 38.2% level and the 61.8% level. The 23.6% and 76.4% are considered as less likely to denote turning points for market prices.
A Fibonacci retracement level is considered more significant if it coincides with other technical indicators, such as a key moving average. Thus, if a Fib retracement hits around the same price level as, say, the 50-period moving average, then traders are likely to view a buy or sell at that price level as being more likely to prove profitable.
Best Forex brokers


Fibonacci Retracement – an Example
Applying the Fibonacci retracement levels indicator to a price chart is a simple process. After selecting the Fibonacci indicator, you simply draw a line from the low to the high of recent price action in line with the overall trend, and then plug in the Fib indicator. The various percentage retracement levels will then appear on your chart. (The Fibonacci indicator varies from one charting program to another. Some display all four of the Fibonacci ratio levels; some only show the 61.8 and 38.2 levels; and some also display a 50% retracement level, even though 50% is not actually a Fib ratio.)
Let’s look at an example of a Fibonacci retracement in action. The chart of Ethereum/Usd below illustrates a corrective retracement to the downside during an overall uptrend. This chart shows only the primary 38.2% and 61.8% Fibonacci retracement price levels, along with the 50% retracement level. In this instance, the downside retracement in Ethereum’s price did find buying support right around the 38.2% Fib retracement level. It then turned back to the upside, resuming the market’s overall uptrend and, in fact, went on to new highs.
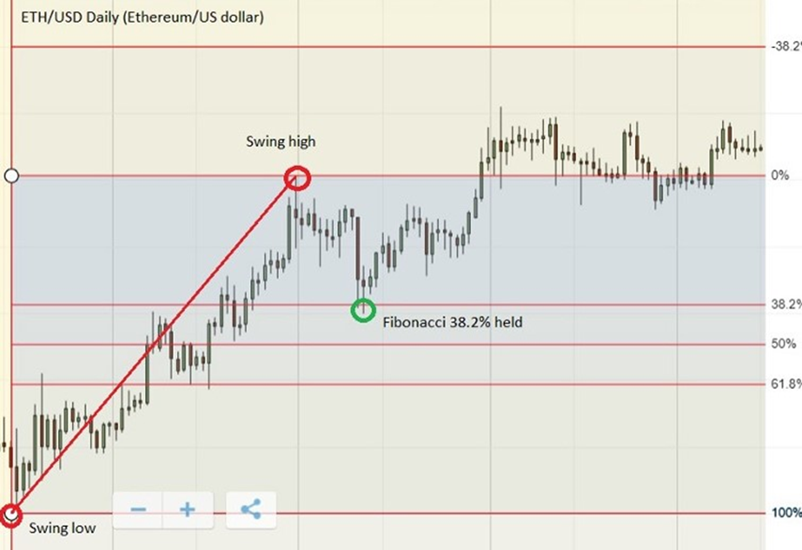
Fibonacci Retracement
A trader looking for an advantageous price at which to buy Ethereum would have done well if they’d had a buy order placed around the 38.2% Fib retracement price level.
Some Fibonacci Trading Tips
The Fibonacci retracement ratios provide traders with indications of several different price levels where a market may be likely to find price support or resistance sufficiently strong enough to reverse price action in the opposite direction. Unfortunately, there’s no magic formula that reveals which – if any – of the Fibonacci retracement levels will, in fact, turn out to be significant support or resistance. For that reason, traders commonly chart other technical indicators, such as moving averages or divergence indicators such as the MACD or RSI, to get a better idea of whether a given Fib retracement level will coincide with substantial buying or selling.
The Fibonacci ratios can also be used when, following a corrective retracement, a market resumes its overall trend and moves to new highs (in an uptrend) or new lows (in a downtrend). Looking again at the chart of Ethereum/Usd, you can see that the price level that is 38.2% above the swing high that preceded the downside retracement is also marked. After the market moves to new high prices in Ethereum, that 38.2% gain – or a gain representing another Fibonacci ratio - may turn out to be an area of price resistance.
One more note on Fibonacci trading: Some market analysts have noted that when price action in a market has been rapid and extreme, resulting in a sharp uptrend or downtrend, then a corrective retracement is more likely to stall out around the Fib ratio levels of 23.6% or 38.2%. When a trend has moved price up or down more slowly, and over a longer period of time, prior to experiencing a corrective retracement, then support/resistance is more probable around a 61.8% retracement.
Conclusion – Why the Fibonacci Indicator is Important
The Fibonacci indicator is used to reveal price levels where the price action of a financial security may find support or resistance. It is most commonly used by traders to help them determine a potentially advantageous market entry price. It can also be used to determine stop-loss or “take profit” price levels for an open trade. Again, it’s a good idea to keep the Fibonacci levels marked on price charts because of the fact that millions of Fibonacci traders are likely to be buying or selling at Fibonacci levels.
Glossary for novice traders
-
1
Index
Index in trading is the measure of the performance of a group of stocks, which can include the assets and securities in it.
-
2
Options trading
Options trading is a financial derivative strategy that involves the buying and selling of options contracts, which give traders the right (but not the obligation) to buy or sell an underlying asset at a specified price, known as the strike price, before or on a predetermined expiration date. There are two main types of options: call options, which allow the holder to buy the underlying asset, and put options, which allow the holder to sell the underlying asset.
-
3
Take-Profit
Take-Profit order is a type of trading order that instructs a broker to close a position once the market reaches a specified profit level.
-
4
Forex Trading
Forex trading, short for foreign exchange trading, is the practice of buying and selling currencies in the global foreign exchange market with the aim of profiting from fluctuations in exchange rates. Traders speculate on whether one currency will rise or fall in value relative to another currency and make trading decisions accordingly. However, beware that trading carries risks, and you can lose your whole capital.
-
5
CFD
CFD is a contract between an investor/trader and seller that demonstrates that the trader will need to pay the price difference between the current value of the asset and its value at the time of contract to the seller.
Related Articles


Team that worked on the article

Johnathan M. is a U.S.-based writer and investor, a contributor to the Traders Union website. His two primary areas of expertise include finance and investing (specifically, forex and commodity trading) and religion/spirituality/meditation.
His experience includes writing articles for Investopedia.com, being the head writer for the Steve Pomeranz Show, a personal finance radio program on NPR. Johnathan is also an active currency (forex) trader, with over 20 years of investing experience.

Dr. BJ Johnson is a PhD in English Language and an editor with over 15 years of experience. He earned his degree in English Language in the U.S and the UK. In 2020, Dr. Johnson joined the Traders Union team. Since then, he has created over 100 exclusive articles and edited over 300 articles of other authors.

Mirjan Hipolito is a journalist and news editor at Traders Union. She is an expert crypto writer with five years of experience in the financial markets. Her specialties are daily market news, price predictions, and Initial Coin Offerings (ICO).
