Falling Wedge and Rising Wedge Patterns Review
Have you ever tried curating a trading strategy but failed due to your lack of knowledge of different wedge patterns? Technical indicators are a great way to help you achieve your trading goals efficiently; however, sometimes, they are complicated to comprehend, which eventually makes them useless.
In this review, we have focused on two different chart patterns or technical indicators, the falling wedge pattern and the rising wedge pattern. They are bearish and bullish patterns, respectively, and help traders understand the magnitude of price movement.
So, dig in to explore these patterns and how these technical forex signals help you achieve your trading objectives with ease.
Start trading Forex right now with RoboForex!What is a Falling Wedge?
Referred to as a bullish pattern, a falling or descending wedge pattern has a wide top that gradually contracts with the prices getting lower. The action of the price makes this pattern look similar to a cone. This cone moves down with the convergence of reaction lows and reaction highs.
A falling wedge pattern can either be a continuation or reversal signal. When a downward wedge pattern is a reversal signal, it indicates the possibility of an upward trend, and it appears at the downtrend’s bottom. Alternatively, when the falling wedge is a continuation signal, it occurs during an uptrend, indicating the resumption of upward price action.
There is a strong reason why a falling wedge pattern is referred to as a bullish pattern. It is because this pattern is a true reflection of the behavior of a sliding price that starts to lose momentum. Moreover, the falling wedge chart pattern also signifies that the buyers are slowly moving to slow down or control the falling speed.
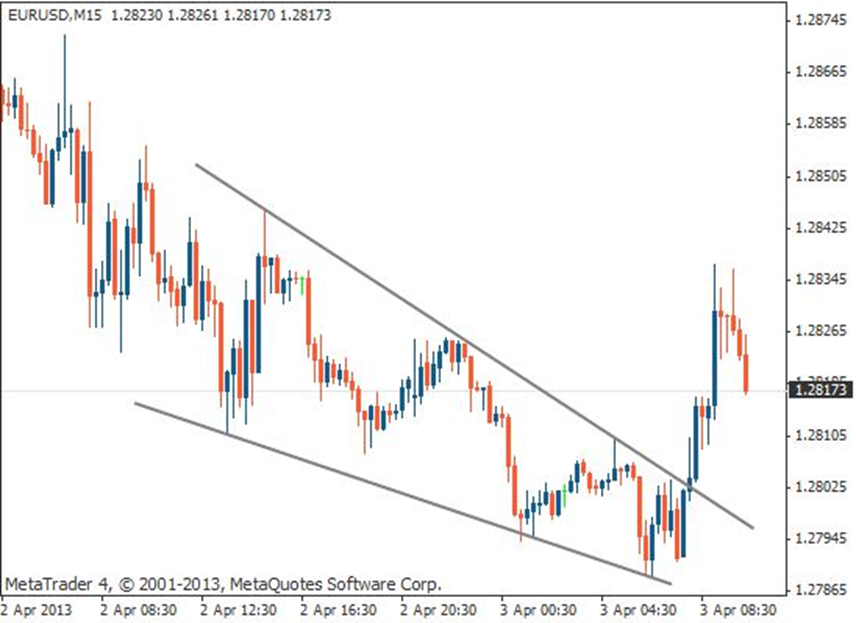
Falling Wedge Pattern
👍 Pros of a Falling Wedge Pattern
• The pattern appears quite frequently in the financial markets, making it pretty promising for traders.
• If you have missed an initial chance, the pattern allows and helps traders to enter a trending market and benefit from its price movement.
• The pattern presents straightforward entry, exit, and stop limits.
• The falling wedge pattern represents an excellent opportunity for a favorable risk-reward ratio.
👎 Cons of a Falling Wedge Pattern
• If you are a novice trader, the pattern may seem ambiguous to you.
• People often identify this pattern incorrectly, and so to get additional confirmation, you may have to take help from other oscillators and technical indicators.
How to Identify a Falling Wedge
If this is your first time understanding different wedge patterns, you might be a victim of confusion pretty soon. To avoid that, here are a few things to keep in mind when identifying a falling or downward wedge pattern.
The correct identification can be pretty confusing since a falling wedge is often interpreted as both a bullish reversal and a bullish continuation pattern. However, if you successfully consider the market conditions of individual scenarios, you won’t face any issues during your interpretation.
So, what is it that differentiates between a reversal and continuation pattern? Simply put, it is the trend’s direction as soon as the falling wedge pattern appears.
For instance, if you see an uptrend, the falling wedge indicates a continuation pattern. Alternatively, when a pattern appears in a downtrend, the falling wedge is interpreted as a reversal pattern.
Once you have identified the nature of the descending wedge pattern, you can establish a way to start trading.
Below are some steps to follow:
-
Interpret a falling wedge pattern as a downtrend or uptrend.
-
Use a trend line to link lower lows with lower highs. These lines should converge while sloping downwards.
-
Look for areas where there is a divergence between an oscillator and price.
-
Use technical tools to identify any oversold signal.
-
Finally, identify any break above the resistance for a possibility of a long entry.
How to Trade a Falling Wedge Pattern
You can use technical analysis to trade a falling wedge pattern. So, whether you have a continuation pattern or a reversal pattern, there is a certain way you can trade it.
Method One
After identifying your pattern, start buying orders on the break located on the wedge’s top side. To prevent false breakouts, wait to close the candle over the top trend line. As you can see in the chart below, a buy order is labeled by 1.
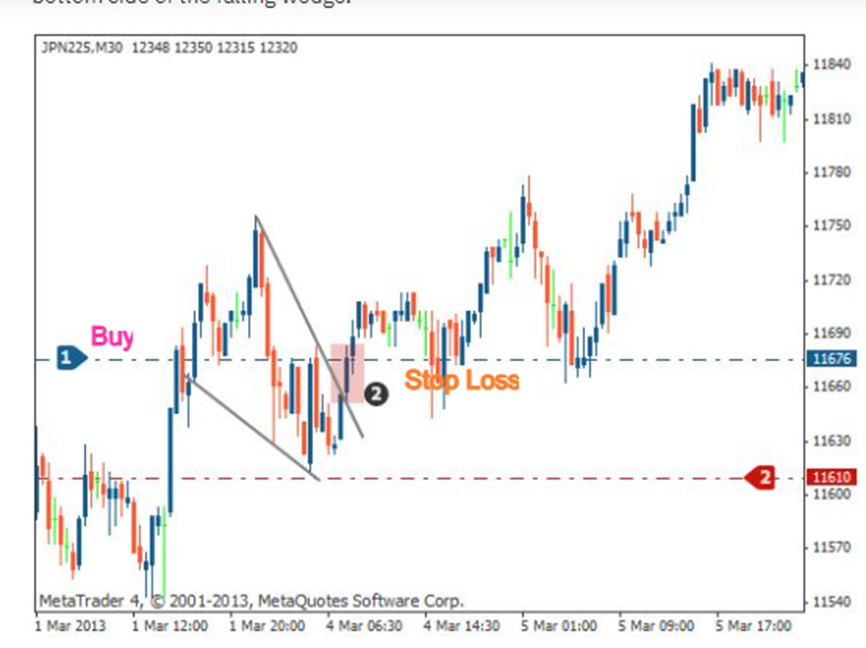
Falling Wedge Pattern
Moreover, number 2 indicates the point of stop loss. To identify the profit target, you can see the chart below.
This amount is calculated by measuring the wedge’s height from its back and then extending the distance starting from the breakout point. Point 3 represents the area where you can make a profit.
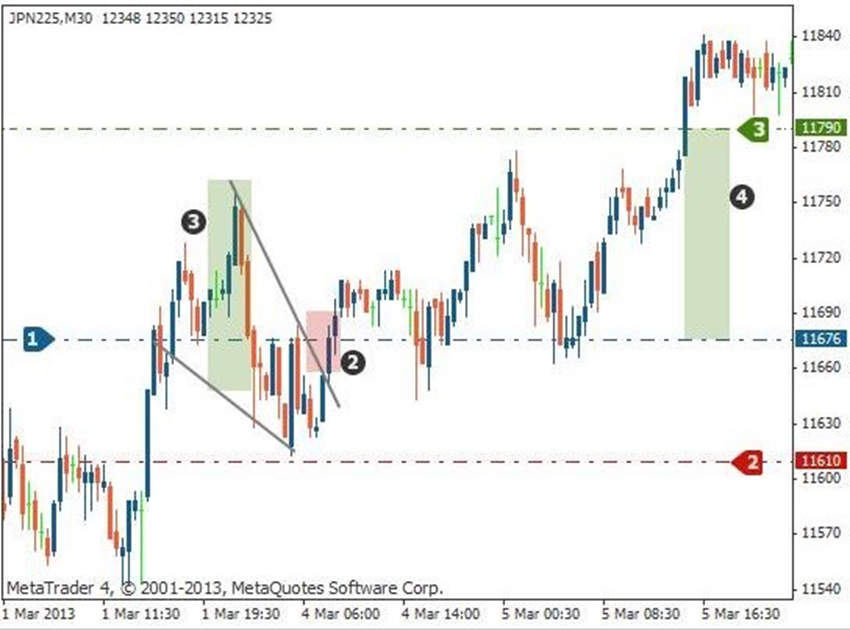
Falling Wedge Pattern
Method 2
The chart below shows the second method to trade a falling wedge pattern. The traders should wait until the price appears above the trend line in this method. If it does, buy order on the trend line’s retest.
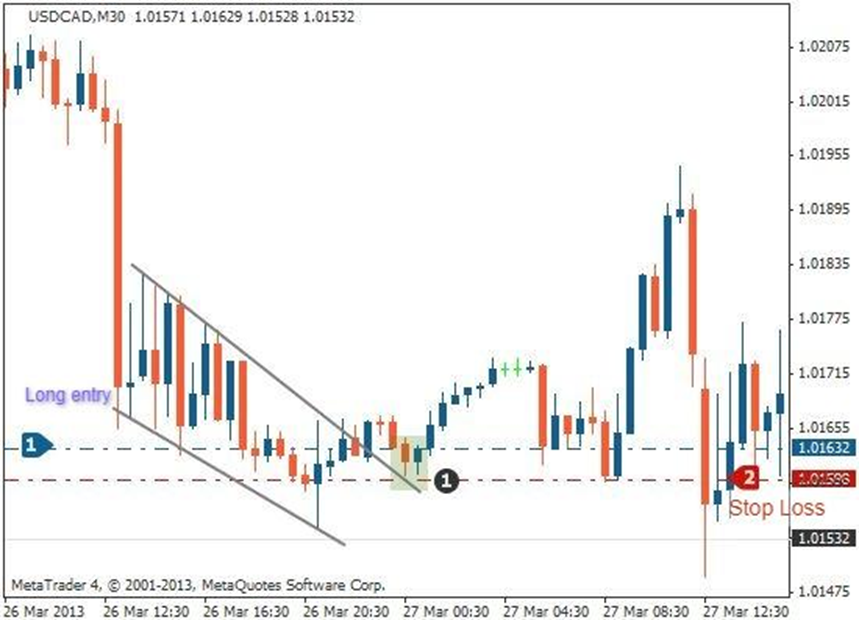
Falling Wedge Pattern
In the chart above, point 1 shows the area perfect for a long entry. Moreover, point 2 identifies the region with stop loss.
Regardless of which method you use, make sure you study the pattern in detail before executing your trading journey. For example, the areas that indicate long entry and stop loss should be adequately evaluated before you decide to start or stop trading.
What is a Rising Wedge?
Unlike a falling wedge, a rising wedge pattern forms with the consolidation of price between resistance lines and upward sloping. In the rising wedge pattern, the support line slope is far steeper than the resistance slope.
A rising wedge pattern looks like a wedge because the formation of higher highs is slower than higher lows. You will often identify this pattern in charts when the movement of price is upwards, and the pivot lows and highs are seen to converge on a specific point, referred to as the apex.
Moreover, a rising wedge pattern is often considered a bearish signal. This is because the pattern indicates a chance of a reversal in an uptrend. These patterns also identify the possibility of a fall in prices right after a breakout.
Since a rising wedge pattern has a comparatively high reward ratio, many professional traders consider it their favorite. That said, if you are a new trader, you may confuse many false patterns as rising wedge patterns and lose your chances of earning benefits. So, it is imperative to identify it correctly by finding divergences between volumes or prices.
Also, the signals of a rising wedge pattern are a mirror image of the essence of a falling wedge pattern. Both are entirely opposite to each other. We have listed a few factors to establish a comparison in the table below.
| Factors for Comparison | Falling Wedge Pattern | Rising Wedge Pattern |
|---|---|---|
Formation |
This wedge is formed when two converging lines appear after the prices of stock have been falling for a specific period. |
Two converging lines form a rising wedge after a continuation of a rise in prices for a certain period. |
Resistance and Support lines |
The resistance line is steeper than the support line. |
The support line is steeper than the resistance line. |
Pattern category |
Bullish pattern |
Bearish pattern |
Best Brokers to Consider
If you want to get into trading and benefit from trading analysis, choosing the right broker is crucial. However, it is a challenging task as there are many options available.
Although high competition has pushed these brokers to offer excellent services on a no-fee basis, you will still find some significant differences in things such as their account features, trading technology, and usability.
When selecting the best broker, there are many important factors to consider. For instance, if you are a novice trader, you need to ensure whether a broker provides you with the educational resources required to step into the financial market.
Furthermore, the reliability and account features that these brokers provide also matter. Therefore, some traders also look into the commission brokers charge and evaluate the previous customer experiences to choose the one that ticks all the right boxes for them.
This section looks at two exceptional and reliable brokers to consider. Of course, you can go for either of the two, provided they meet your trading needs.
OANDA
OANDA is a broker that you can completely trust. As an award-winning broker, OANDA has worked hard for 25 years to develop a strong reputation for its platform that offers trading education and reliable and transparent pricing to its customers.
This broker deals with many different products such as forex, indices, metals, and cryptocurrencies. What’s more, the broker provides various technical analysis tools and MT4 premium tools to make forex trading a piece of cake for you.
While OANDA excels at providing a broad CFD market for its customers, it also offers the convenience of opening an account without demanding verification documents. Further, if you refer the broker services to a friend, you and your referred partner can earn $1000. Additionally, there are no limitations on the number of friends you can refer OANDA to.
OANDA gives every customer a strong trading experience, courtesy of its platform MetaTrader. Besides, it also provides excellent and vigilant customer service, ensuring that every client gets a solution to their issues as soon as possible.
eToro

Another highly competent and preferred broker by traders worldwide, eToro is famous for its products and services. With this broker, you can not only increase your knowledge of trading but can also build solid financial experience.
From stocks to cryptos, eToro offers thousands of assets perfect for investment. Each asset has its specific category, making it easy for you to choose from.
What’s more, the platform allows you to invest in your favorite stocks and benefit from a 0% commission. You can start trading right away. Moreover, eToro has many popular crypto assets available, making it convenient for you to buy or sell your chosen currency with ease.
You can also join the eToro community and learn from the best investors in this field. Through the feature CopyTrader, you also get the chance to copy the moves of different investors, replicating their profitable actions for your benefit.
The fee structure at eToro is quite simple. For instance, there are no charges to open an account. Moreover, the broker doesn’t charge any fee for management expenses. Further, there is no markup, ticketing fees, or commission on stocks.
However, there are a few fees that may apply. For example, eToro charges a 1% fee for buying or selling a crypto asset through the platform. In addition, if you want to invest in stocks, you can buy them in bulk and pay as little as $10.
Summary
If you want to trade like a professional, you need to know the different wedge patterns and signals before you can make some earnings. In this article, we looked at both rising and falling wedge patterns and established how they are mirror images of each other.
Further, we also learned about the top brokers that can help you get into the world of forex and crypto. Hopefully, you are now ready to explore trading like a professional.
FAQs
Here are some common questions on this topic.
Is a falling wedge pattern consistently accurate?
Not always, but a falling wedge pattern has better accuracy than a rising wedge pattern.
Is a falling wedge pattern bullish?
Yes, when the pattern shows an uptrend, it is labeled as bullish.
When should I avail of a rising wedge pattern?
You can use it when it indicates good oscillation between the bullish lines.
When should I trade a falling wedge pattern?
This trend indicates a good buying opportunity after a downward trend. Moreover, it is also good to trade it during a continuous uptrend.
Glossary for novice traders
-
1
Investor
An investor is an individual, who invests money in an asset with the expectation that its value would appreciate in the future. The asset can be anything, including a bond, debenture, mutual fund, equity, gold, silver, exchange-traded funds (ETFs), and real-estate property.
-
2
Copy trading
Copy trading is an investing tactic where traders replicate the trading strategies of more experienced traders, automatically mirroring their trades in their own accounts to potentially achieve similar results.
-
3
Upward Trend
Uptrend is a market condition in which prices are generally rising. Uptrends can be identified by using moving averages, trendlines, and support and resistance levels.
-
4
Forex Trading
Forex trading, short for foreign exchange trading, is the practice of buying and selling currencies in the global foreign exchange market with the aim of profiting from fluctuations in exchange rates. Traders speculate on whether one currency will rise or fall in value relative to another currency and make trading decisions accordingly. However, beware that trading carries risks, and you can lose your whole capital.
-
5
CFD
CFD is a contract between an investor/trader and seller that demonstrates that the trader will need to pay the price difference between the current value of the asset and its value at the time of contract to the seller.


Team that worked on the article

Oleg Tkachenko is an economic analyst and risk manager having more than 14 years of experience in working with systemically important banks, investment companies, and analytical platforms. He has been a Traders Union analyst since 2018. His primary specialties are analysis and prediction of price tendencies in the Forex, stock, commodity, and cryptocurrency markets, as well as the development of trading strategies and individual risk management systems. He also analyzes nonstandard investing markets and studies trading psychology.
Also, Oleg became a member of the National Union of Journalists of Ukraine (membership card No. 4575, international certificate UKR4494).

Olga Shendetskaya has been a part of the Traders Union team as an author, editor and proofreader since 2017. Since 2020, Shendetskaya has been the assistant chief editor of the website of Traders Union, an international association of traders. She has over 10 years of experience of working with economic and financial texts. In the period of 2017-2020, Olga has worked as a journalist and editor of laftNews news agency, economic and financial news sections. At the moment, Olga is a part of the team of top industry experts involved in creation of educational articles in finance and investment, overseeing their writing and publication on the Traders Union website.

Mirjan Hipolito is a journalist and news editor at Traders Union. She is an expert crypto writer with five years of experience in the financial markets. Her specialties are daily market news, price predictions, and Initial Coin Offerings (ICO).
