Cup And Handle Chart Pattern Review

To trade using the cup and handle pattern, enter long positions when the price breaks above the handle's upper trend line, with stop-loss orders set below the handle.
Ever look at a stock chart and see a shape that resembles a teacup? That might be a cup and handle pattern, a signal some traders use to identify potential buying opportunities. But how do you know for sure, and what's the best way to trade it? This article will break down the cup and handle pattern, including its formation and how to spot entry and exit points, to help you decide if it's a good fit for your trading strategy.
-
What is the cup and handle pattern?
The cup and handle pattern is a bullish chart formation characterized by a "U"-shaped cup followed by a smaller handle.
-
Is cup and handle pattern bullish?
Yes, the cup and handle pattern is considered a bullish chart pattern.
-
How to trade the cup and handle pattern?
Traders typically enter long positions when the price breaks above the handle's upper trend line, with stop-loss orders set below the handle.
-
What is the opposite cup and handle pattern?
The opposite of the cup and handle pattern is often referred to as a "dead cat bounce" or an "inverse cup and handle," indicating a bearish reversal pattern.
How to identify the cup and handle pattern in trading?
The cup and handle pattern stands out as a popular tool within technical analysis, serving to detect potential shifts and upticks in prices. Considered a bullish indicator, it suggests an imminent rise in prices. Understanding its makeup, variations, optimal timeframes, and its link to support and resistance is crucial.
Components of a cup and handle pattern
The "cup" portrays a U-shaped formation resembling a trough. It emerges subsequent to a decline in prices, followed by a recovery that falls short of the previous peak. This period of consolidation indicates a temporary pause within the downward trend.
Conversely, the "handle" presents itself as a smaller extension to the right of the cup. It signifies a minor retreat following the price surge observed within the cup. Ideally, the handle should refrain from dipping below the halfway point of the cup and should predominantly reside within the upper two-thirds, amplifying the strength of the signal.
The cup and handle pattern is observable across various timeframes, spanning from short-term charts, measured in minutes, to longer-term charts, spanning months. However, the choice of timeframe hinges on one's trading approach and tolerance for risk. Typically, cup and handle formations on daily or weekly charts are deemed more reliable for swing trading and long-term investment strategies. Furthermore, this pattern is adaptable across diverse markets, including stocks, Forex, and commodities alike.
A noteworthy correlation exists between the cup and handle pattern and support and resistance levels. The trough of the cup frequently aligns with a support level, denoting a price point where buying activity typically prevents further price declines. Meanwhile, the neckline of the cup, marked by a horizontal line connecting the cup's highs, functions as a resistance level. A breakout above this neckline signals a potential reversal or continuation in trend.
Market logic of the "cup and handle" pattern
Theoretically, the reason for the appearance of this pattern can be considered weak positions of players against a long trend. That is, trading positions in the direction of the main trend are gradually closing, while interest in the opposite direction is still weak. As a result, it is not possible to break the basic direction, no true reversal occurs and after a period of flat (uncertainty) the previous trend not only recovers, but also strengthens additionally. The rest of the players against the trend are pushed out of the market after an additional correction (the "handle" section) and further movement along the trend continues, at least for the height of the entire model.
Best Forex Brokers


What are the rules for cup and handle pattern?
Confirmation
The cup and handle pattern should be confirmed by observing the formation of both the cup and the handle. The cup should resemble a U-shaped trough, and the handle should be a smaller, rightward extension of the cup.
Entry
Traders typically enter a position when the price breaks above the resistance level formed by the handle. This breakout indicates potential upward momentum.
Stop placement
A stop-loss order is often placed just below the low point of the handle. This helps limit potential losses if the pattern fails to materialize or if the price reverses unexpectedly.
Exit strategy
Traders may consider exiting their position when the price reaches a target level, which can be calculated by measuring the height of the cup and adding it to the breakout point. Alternatively, if the price fails to maintain upward momentum and falls below the handle's low point, it may be prudent to exit the position to mitigate losses.
Cup and handle pattern invalidation
The cup and handle pattern is invalidated if the price breaks below the low point of the cup. This suggests that the anticipated upward momentum has failed to materialize, and the pattern may no longer be reliable for predicting future price movements. Traders should reassess their position and consider exiting to avoid further losses.
How to trade the Cup and handle pattern: Crypto
Here, we can see that a cup and handle formation on the ETH/USD chart. The cup is formed between approximately March 13 and March 26. The handle is formed between March 27 and March 31. The neckline is the horizontal line that forms at the top of the cup. A breakout occurs when the price closes above the neckline.
A cup and handle formation is a bullish continuation pattern. This means that it suggests that an uptrend will continue after the breakout. The measured target price for a cup and handle pattern is the height of the cup added to the breakout point.
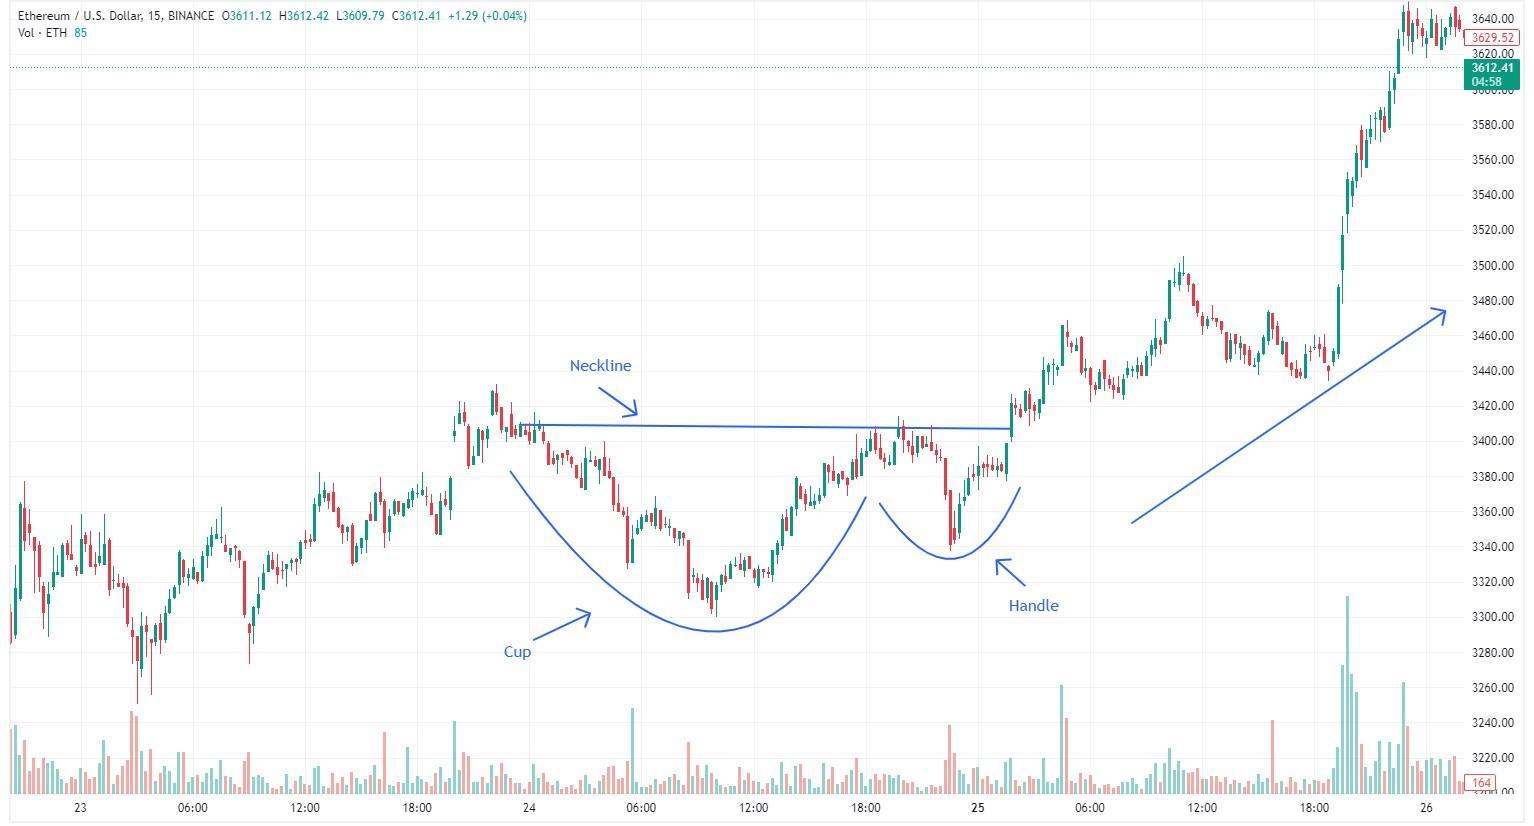
Cup and handle formation on the ETH/USD chart
How to trade the Cup and handle pattern: Forex
The EUR/USD chart is displaying a classic Cup and Handle formation, a bullish continuation pattern often observed in financial markets. The pattern features a distinct "U"-shaped cup formation followed by a smaller handle with a slight downward drift, resembling a teacup with a handle. Traders may consider initiating a long position when the price breaks above the upper trend line of the handle. This breakout can be confirmed by placing a stop buy order slightly above the trend line or waiting for a close above it before placing a limit order slightly below the breakout level.
A potential exit strategy involves measuring the distance between the bottom of the cup and the breakout level, then extending that distance upward from the breakout point. For instance, if the distance measures 20 points, a profit target could be set 20 points above the handle. Stop-loss orders can be placed either below the handle or below the cup, based on individual risk tolerance and market conditions.
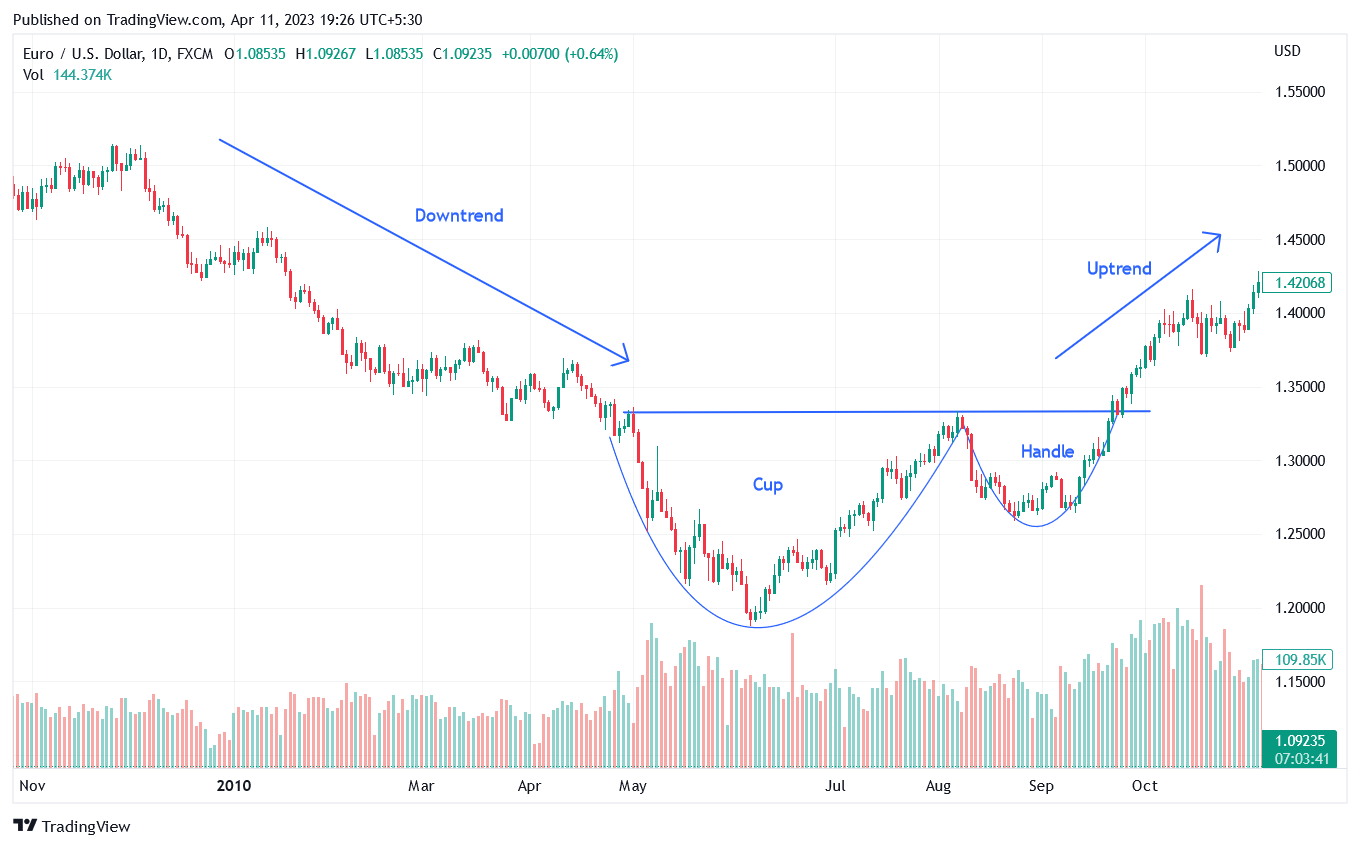
EUR/USD chart
Inverse cup and handle
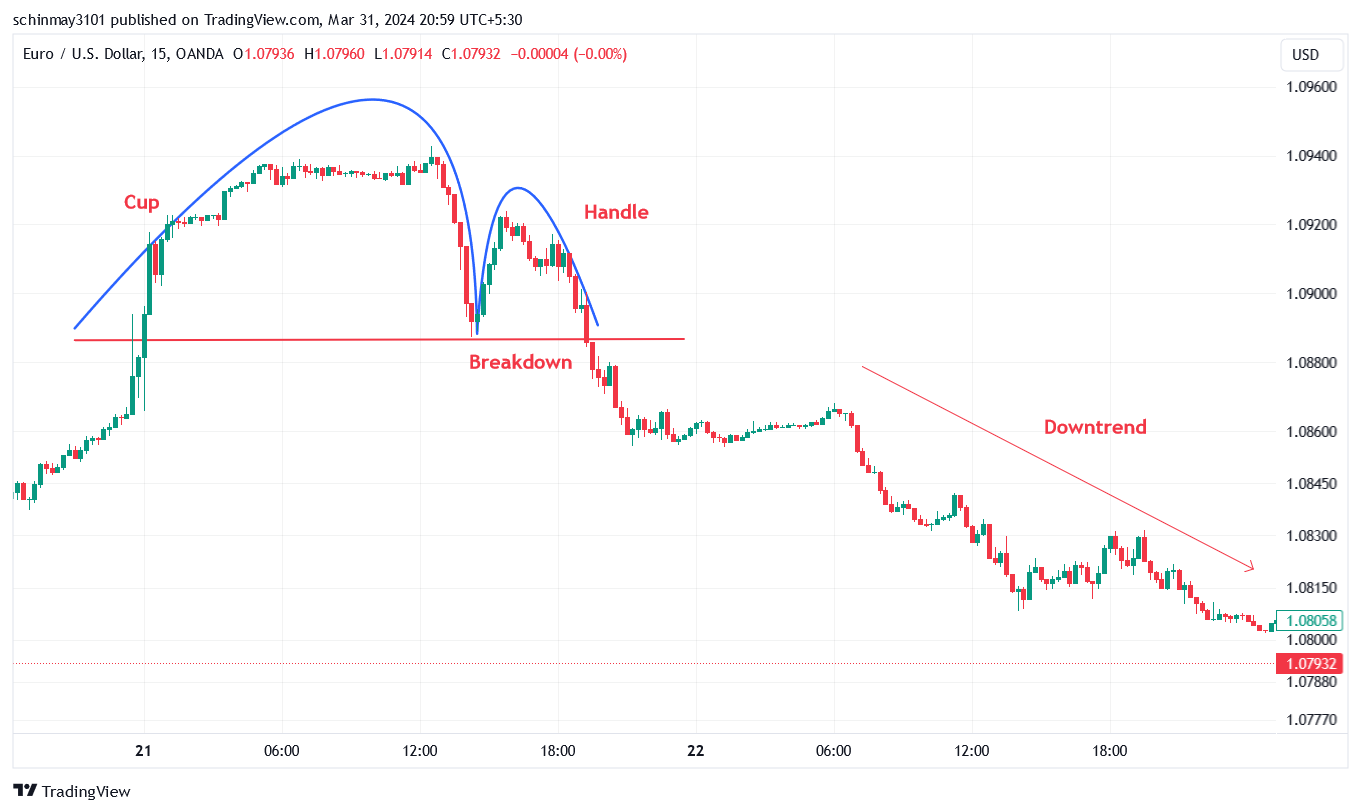
Inverted cup and handle
An inverted cup and handle is a bearish technical indicator, and the opposite of the bullish cup and handle. The inverted cup is a U-shaped price movement that curves downwards. It represents a price decline followed by a corrective rally that fails to reach the previous high. The handle is a brief price consolidation period that occurs after the inverted cup is formed. It's typically shaped like a range or a continuation of the downward trend.
The cup and handle appears quite often on stock assets, enjoys great popularity, but the author of the current interpretation, including for Forex, is considered to be a famous trader and popularizer of graphical analysis William O'Neil. The author's favorite timeframe is daily and weekly, but at Forex due to higher volatility stable results can be obtained on H4. Nevertheless, D1 is considered to be the optimal period.
What is the success rate of the cup handle pattern?
The Cup and Handle pattern is widely recognized for its high success rate, as confirmed by various sources:
-
Research from Morpheus Trading indicates a remarkable success rate of 95% for the Cup and Handle pattern
-
Quantified Strategies notes a failure rate of 26%, slightly above the acceptable 20% threshold. However, waiting for an upside breakout significantly reduces the failure rate to 10%
-
Liberated Stock Trader also underscores the impressive success rate of the Cup and Handle pattern, affirming its reliability with a 95% success rate
With a success rate of 95%, the Cup and Handle pattern is favored by traders for its ability to identify bullish price action and lucrative trading opportunities. Its high probability of success in predicting price increases and continuation of bullish trends makes it a popular and trusted pattern in the trading community.
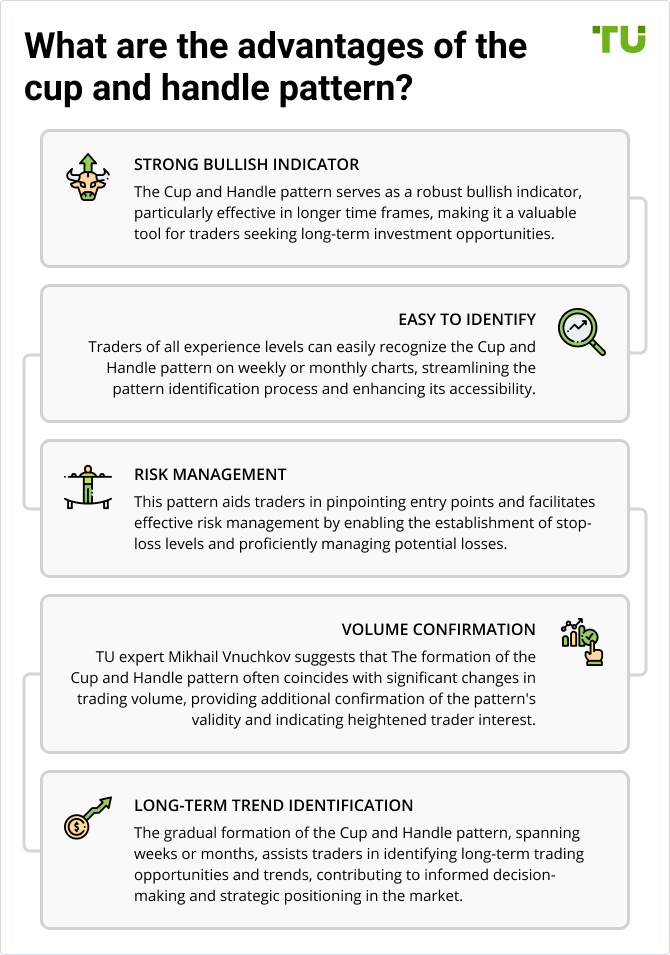
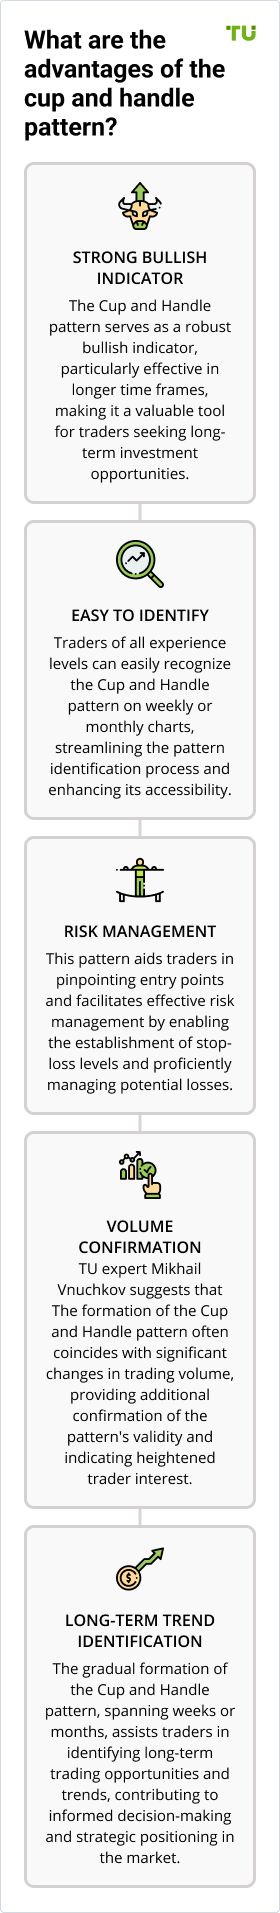
What are the advantages of the cup and handle pattern?
Strong bullish indicator
The Cup and Handle pattern serves as a robust bullish indicator, particularly effective in longer time frames, making it a valuable tool for traders seeking long-term investment opportunities.
Easy to identify
Traders of all experience levels can easily recognize the Cup and Handle pattern on weekly or monthly charts, streamlining the pattern identification process and enhancing its accessibility.
Risk management
This pattern aids traders in pinpointing entry points and facilitates effective risk management by enabling the establishment of stop-loss levels and proficiently managing potential losses.
Volume confirmation
TU expert Mikhail Vnuchkov suggests that The formation of the Cup and Handle pattern often coincides with significant changes in trading volume, providing additional confirmation of the pattern's validity and indicating heightened trader interest.
Long-term trend identification
The gradual formation of the Cup and Handle pattern, spanning weeks or months, assists traders in identifying long-term trading opportunities and trends, contributing to informed decision-making and strategic positioning in the market.
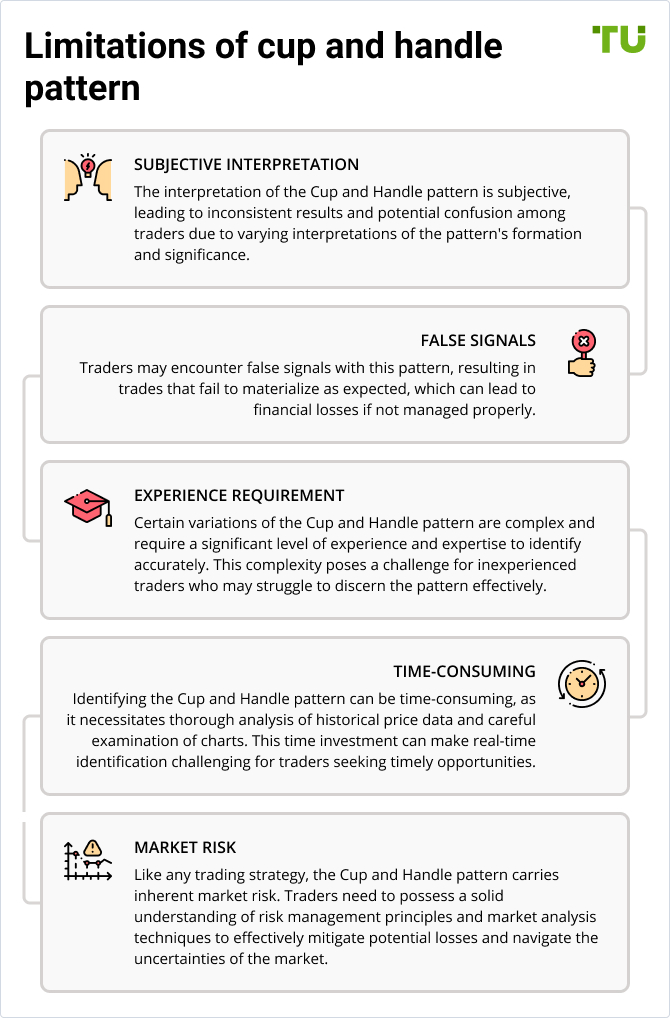
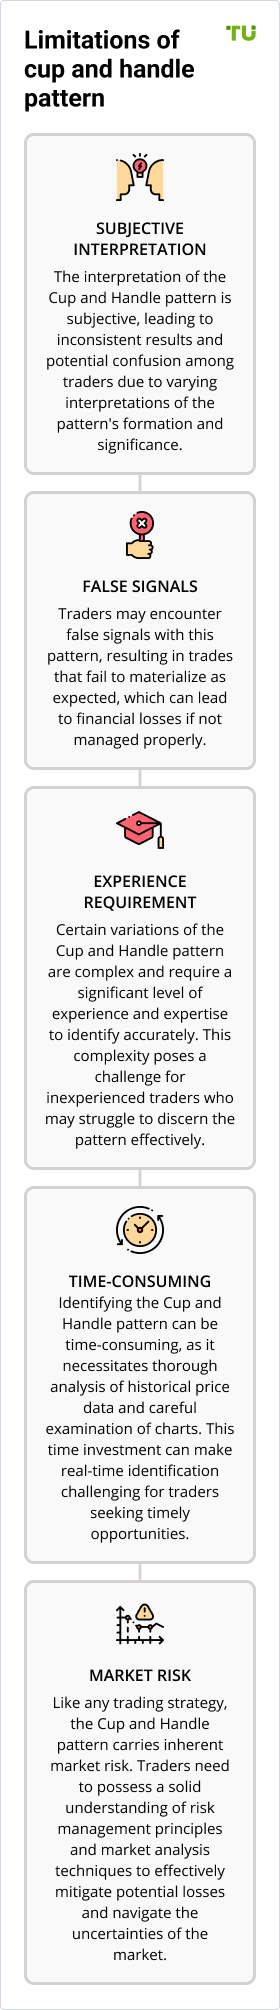
Limitations of cup and handle pattern
Subjective interpretation
The interpretation of the Cup and Handle pattern is subjective, leading to inconsistent results and potential confusion among traders due to varying interpretations of the pattern's formation and significance.
False signals
Traders may encounter false signals with this pattern, resulting in trades that fail to materialize as expected, which can lead to financial losses if not managed properly.
Experience requirement
Certain variations of the Cup and Handle pattern are complex and require a significant level of experience and expertise to identify accurately. This complexity poses a challenge for inexperienced traders who may struggle to discern the pattern effectively.
Time-consuming
Identifying the Cup and Handle pattern can be time-consuming, as it necessitates thorough analysis of historical price data and careful examination of charts. This time investment can make real-time identification challenging for traders seeking timely opportunities.
Market risk
Like any trading strategy, the Cup and Handle pattern carries inherent market risk. Traders need to possess a solid understanding of risk management principles and market analysis techniques to effectively mitigate potential losses and navigate the uncertainties of the market.
Summary
In trading, the cup and handle formation is a bullish chart pattern recognized for its potential to signal upward price continuation. This pattern typically appears as a "U"-shaped cup followed by a smaller handle, resembling a teacup with a handle. Identifying the cup and handle involves looking for these distinct shapes on price charts, particularly on longer time frames such as weekly or monthly charts, where it's easier to spot. Entry points are often considered when the price breaks above the upper trend line of the handle, with stop-loss orders placed strategically to manage risk. Traders should be aware of the subjective nature of pattern interpretation, the possibility of false signals, and the time required for thorough analysis. Despite its challenges, understanding the cup and handle pattern can provide valuable insights into potential long-term trading opportunities and trends, making it a worthwhile addition to a trader's toolkit.
Glossary for novice traders
-
1
Upward Trend
Uptrend is a market condition in which prices are generally rising. Uptrends can be identified by using moving averages, trendlines, and support and resistance levels.
-
2
Long position
A long position in Forex, represents a positive outlook on the future value of a currency pair. When a trader assumes a long position, they are essentially placing a bet that the base currency in the pair will appreciate in value compared to the quote currency.
-
3
Limit order
A limit order is a type of order used in trading where an investor specifies a particular price at which they want to buy or sell a financial asset. The order will only be executed if the market price reaches or exceeds the specified limit price, ensuring that the trader gets the desired price or better when the trade is executed.
-
4
Risk Management
Risk management is a risk management model that involves controlling potential losses while maximizing profits. The main risk management tools are stop loss, take profit, calculation of position volume taking into account leverage and pip value.
-
5
Index
Index in trading is the measure of the performance of a group of stocks, which can include the assets and securities in it.
Related Articles


Team that worked on the article

Chinmay Soni is a financial analyst with more than 5 years of experience in working with stocks, Forex, derivatives, and other assets. As a founder of a boutique research firm and an active researcher, he covers various industries and fields, providing insights backed by statistical data. He is also an educator in the field of finance and technology.
As an author for Traders Union, he contributes his deep analytical insights on various topics, taking into account various aspects.

Dr. BJ Johnson is a PhD in English Language and an editor with over 15 years of experience. He earned his degree in English Language in the U.S and the UK. In 2020, Dr. Johnson joined the Traders Union team. Since then, he has created over 100 exclusive articles and edited over 300 articles of other authors.

Mirjan Hipolito is a journalist and news editor at Traders Union. She is an expert crypto writer with five years of experience in the financial markets. Her specialties are daily market news, price predictions, and Initial Coin Offerings (ICO).
