The Best Day Trading Patterns For Beginners
-
Recognize high-probability patterns: tops, bottoms, and trend continuations & reversals
-
Utilize candlestick formations for entry and exit signals
-
Confirm patterns with volume and indicator analysis
-
Manage risks with strict stop-loss and take-profit strategies
Day trading, a high-paced financial activity, demands a keen understanding of market patterns. These patterns, integral to technical analysis, serve as a trader's roadmap. They help predict future price movements, enabling traders to make informed decisions.
In this article, we will go through and explain the most important patterns, how to recognize and use them, and why this will increase the likelihood of successful day trading.
-
Are day-trading patterns profitable?
Yes, day-trading patterns can be profitable when combined with a solid strategy and risk management principles.
-
What is the most reliable pattern for day trading?
The Head and Shoulders pattern is widely regarded as one of the most reliable for predicting trend reversals.
-
How important is volume in confirming day-trading patterns?
Volume is crucial as it confirms the strength and validity of a pattern, indicating the momentum behind price movements.
-
Can day-trading patterns be applied to all financial instruments?
Most day-trading patterns are versatile and can be applied across various financial instruments, including stocks, forex, and commodities.
Types of patterns for day trading
Patterns fall into various categories, each offering unique insights. They can be divided into separate groups using different criteria.
By category:
-
Chart patterns: These patterns are formed by the price movements on a chart and are indicative of the market's future direction. Common chart patterns include tops and bottoms, which signal the potential end of a trend, and flags and other figures, which suggest continuation or reversal.
-
Candlestick patterns: Originating from Japan, candlestick patterns provide visual insights into market sentiment and potential price movements. Examples include the Doji, which indicates indecision in the market, the Morning Star, signaling a bullish reversal, and the Three Crows, a bearish pattern.
-
Indicator patterns: These are based on technical indicators, which are mathematical calculations based on the price, volume, or open interest of a security. Patterns like divergences, where the price of an asset moves in the opposite direction of a technical indicator, or crossovers in overbought or oversold zones, provide signals for potential trend changes or continuations.
Relative to the trend:
-
Continuation patterns: These patterns suggest that the price will continue in the direction of the prevailing trend after a brief pause. Breakouts from these patterns, like flags or pennants, can signal a strong move in the direction of the trend.
-
Reversal patterns: Important in day trading, reversal patterns indicate that the current trend might be about to change direction. They are particularly valid in flat markets, where they can signal the end of a range-bound period. Patterns like head and shoulders or double tops and bottoms are classic examples.
These patterns, when correctly identified and applied, can greatly enhance a trader's ability to make informed decisions in the fast-paced environment of day trading. However, it's important to note that no single pattern is infallible. Successful trading requires combining pattern recognition with other analytical tools and sound risk management strategies.
Best Forex brokers


Chart patterns for day trading
Chart patterns play a crucial role in identifying potential trading opportunities. Here's a brief overview of some key patterns:
-
Triple top: This pattern, characterized by three peaks at roughly the same price level, signals a potential reversal from a bullish to a bearish market trend.
-
Head and shoulders: A well-known reversal pattern, Head and Shoulders is identified by a peak (shoulder), followed by a higher peak (head), and another lower peak (shoulder), indicating a potential bearish turn.
-
Triangles: Triangles, whether ascending, descending, or symmetrical, are continuation patterns that signal accumulation or distribution in the market, leading to a breakout.
-
Mirror levels: These are price levels where the market has historically shown a tendency to reverse or consolidate, acting as key points for potential trade entry or exit.
-
Channels & indicators: Channels, formed by parallel trendlines, indicate the potential direction of price movement. Combined with indicators, they provide insights into trend strength and potential reversals.
Each of these patterns offers unique insights and, when understood in the context of overall market trends and technical analysis, can be powerful tools for day traders. We'll explore and explain each of these patterns in more detail in the following sections.
Triple top
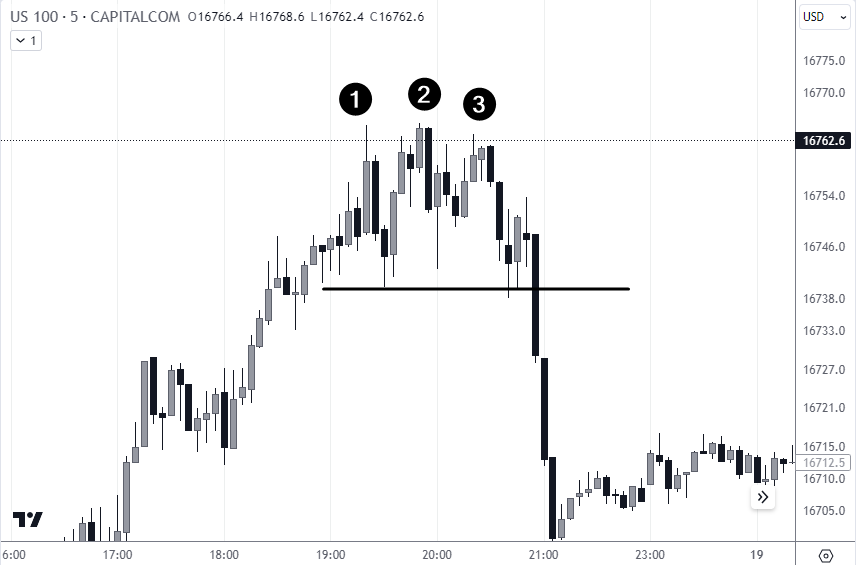
The triple top is a bearish pattern that suggests a trend reversal after three failed attempts to break a resistance level. It’s reliable when confirmed by a decisive break below the supporting neckline.
👍 Pros:
• Clear setup and defined risk points
• High reliability as a reversal indicator
👎 Cons:
• Patience is required for full pattern formation
• Risk of false signals without proper confirmation
Tips:
-
Confirm with high trading volume
-
Set stop losses above the third peak
Triple Top Pattern
The accompanying chart exemplifies a Triple Top with the peaks unable to breach a resistance, followed by a significant drop.
This pattern is similar to the Double Top/Bottom but with three peaks or troughs instead of 2, signaling reversals after more consolidation.
Head and shoulders
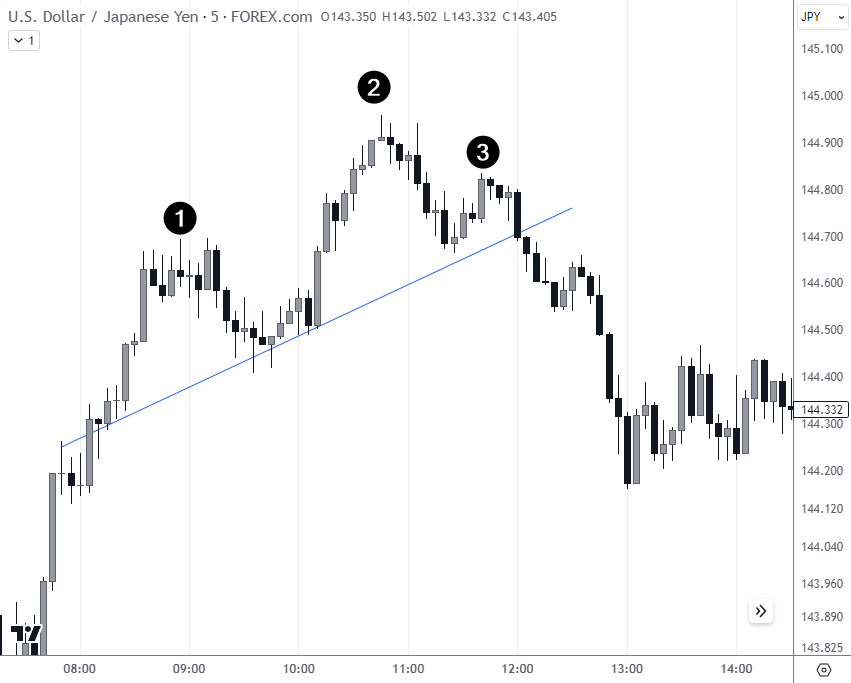
The head and shoulders pattern signals an uptrend's end, marked by two shoulders and a higher head between them. Completion below the neckline suggests a trend reversal.
👍 Pros:
• Indicates significant market sentiment shifts
• Provides measurable targets
• Various sources point to the relatively high efficiency of this pattern
👎 Cons:
• Prone to false breakouts
• Subjective interpretation can lead to errors
Tips:
-
Look for increased volume at the neckline break
-
Trade with the neckline breach as confirmation
Head and shoulders
The referenced chart shows a Head and Shoulders pattern, with labels 1 and 3 representing shoulders and 2 being the head, predicting a shift from bullish to bearish momentum.
There’s also the Inverted Head and Shoulders pattern which serves as the bullish counterpart, indicating a potential trend reversal to the upside.
Triangles
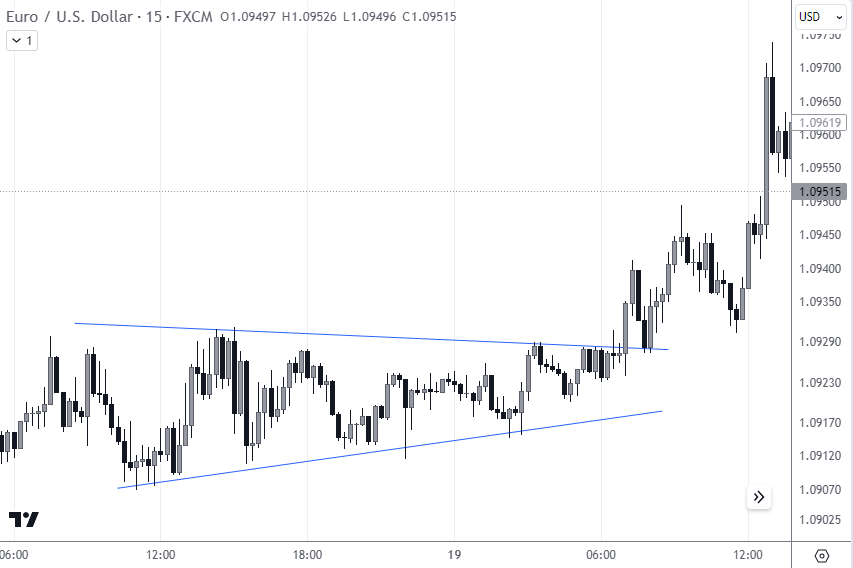
Triangles are chart patterns indicating consolidation and potential breakout, signaling continuation or reversal. They form during a trend as price action converges into a narrower range, signaling that a breakout is imminent.
A triangle is identified by drawing trendlines along the lower highs and higher lows. A breakout from these trendlines indicates the likely direction of the market's next move.
👍 Pros:
• Can signal strong trend continuations or reversals
• Defined entry and exit points
👎 Cons:
• Breakout direction can be unpredictable
• Risk of false breakouts
Tips:
-
Trade in the direction of the breakout with volume confirmation
-
Set a stop loss beyond the opposite trendline
Triangle pattern
In the provided chart, the Euro/U.S. Dollar pair forms a triangle, suggesting accumulation. The price eventually breaks upward, indicating a potential long entry point. Testing the breakout level can serve as one of the trading options for this pattern.
Mirror levels
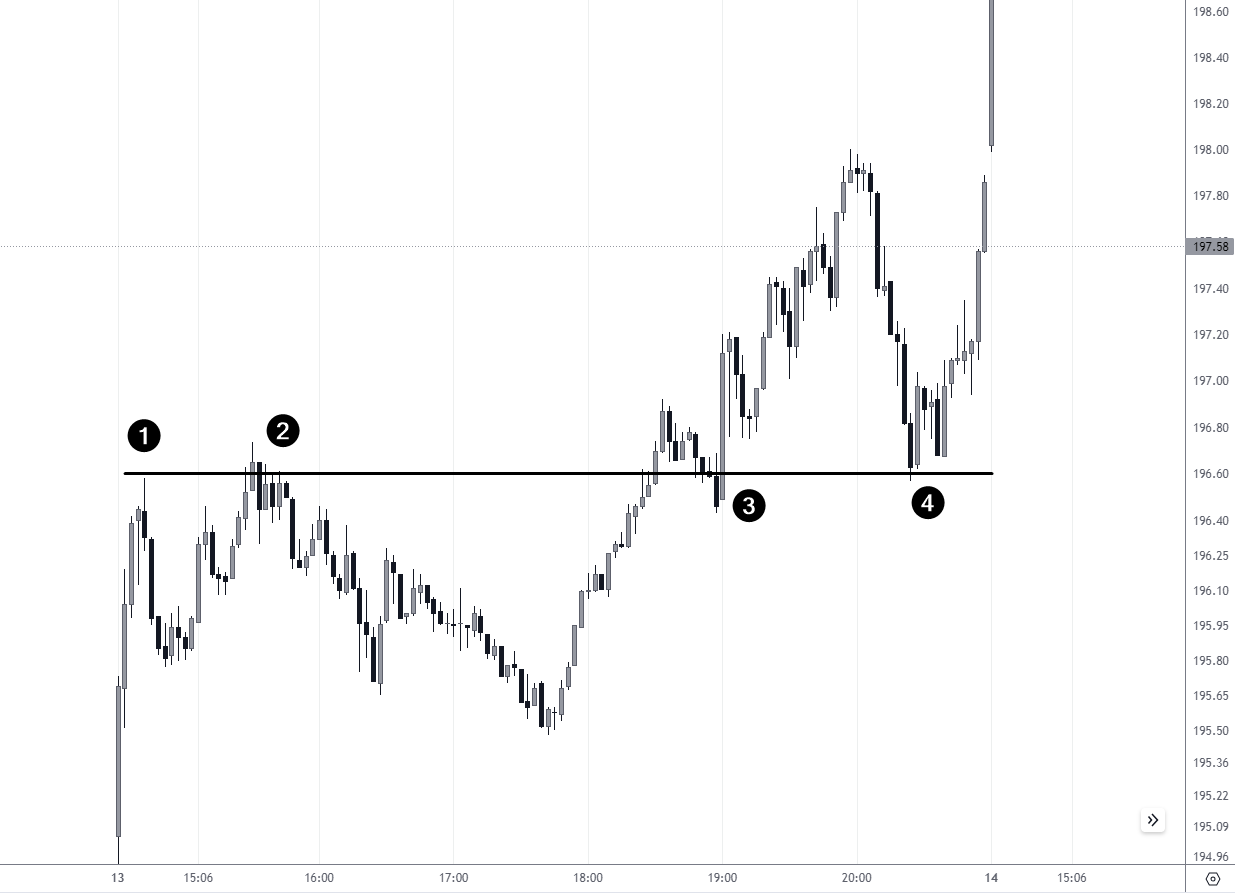
Mirror levels are price points where the market has shown a tendency to reverse, acting as both support and resistance. When the price approaches a mirror level, it may bounce back, respecting the level as support or resistance. This often occurs in both uptrends and downtrends, making it a versatile tool for traders.
👍 Pros:
• Provides clear levels for trade entries and exits
• Can be combined with other indicators for confluence
👎 Cons:
• Not infallible; price can break through these levels
• Requires confirmation to avoid false signals
Tips:
-
Look for confirmation signals like candlestick patterns or volume spikes
-
Set stop losses slightly beyond the mirror level to accommodate for tests of the level
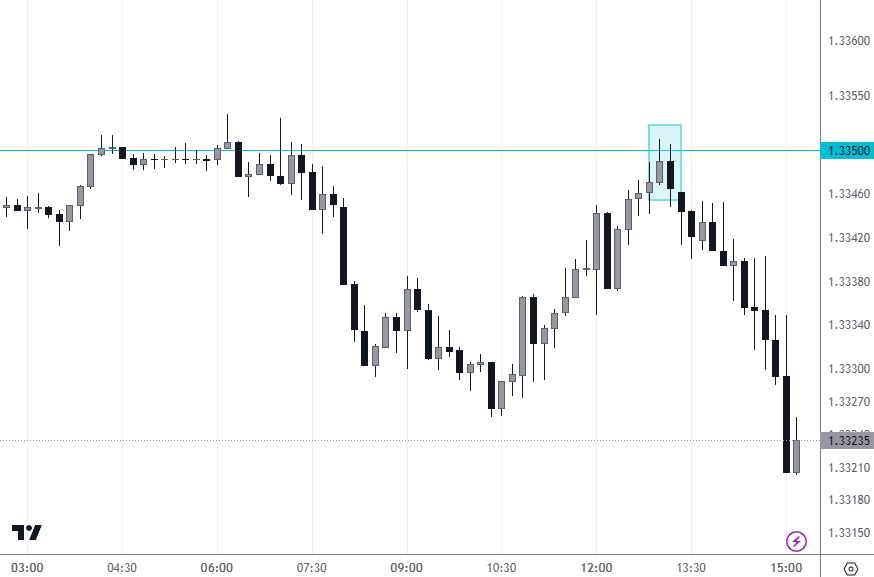
Mirror level
In the attached chart, we see the price oscillating around a horizontal line, which serves as a mirror level. Points 1 and 2 show the price reacting to the level as resistance, while points 3 and 4 show it acting as support, indicating its significance as a mirror level. Day traders could use level testing at points 3 and 4 as entry points for a long position according to their risk control rules.
Channel & indicators patterns
Channels are formed by drawing parallel trend lines that map the upper and lower bounds of price action, while indicator patterns use technical tools to signal potential trade setups.
Channels guide traders on the strength and direction of a trend. Price oscillating between the channel's bounds can indicate a stable trend. Indicators can complement channels by providing signals for potential reversals or continuations.
👍 Pros:
• Channels offer clear visual cues for support and resistance
• Indicators provide additional entry and exit signals
👎 Cons:
• Channels may break unexpectedly, invalidating the pattern
• Indicators can lag, leading to delayed signals
Tips:
-
Combine channel breakouts with indicators for stronger confirmation
-
Watch for overbought or oversold indicator readings to preempt channel breakouts or bounces
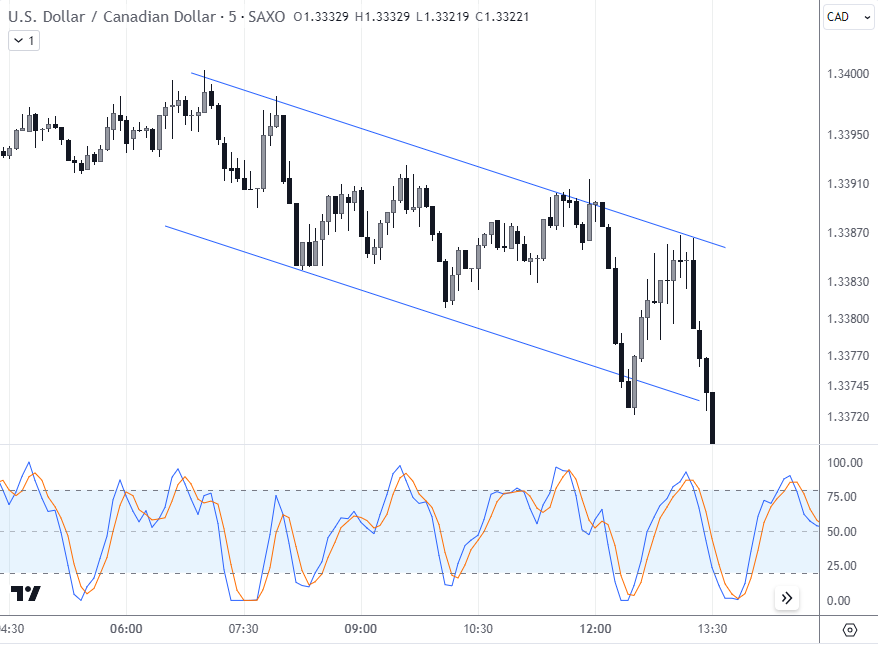
Use of channels in day trading
In the provided chart, a channel is depicted in the U.S. Dollar / Canadian Dollar pair with the price touching and rebounding from the trendlines. An accompanying indicator suggests overbought conditions as the price touches the upper channel line, supporting a potential sell setup.
Candlestick patterns for day trading
In addition to chart patterns, candlestick patterns are another essential tool for day traders, providing insight into market sentiment and potential price movements.
-
Engulfing: This pattern consists of a small candlestick followed by a larger one that “engulfs” it, indicating a possible reversal. A bullish engulfing pattern occurs at the end of a downtrend, while a bearish engulfing appears at the end of an uptrend.
-
Long wicks: Refers to candles with significant wicks (or “shadows”) compared to their bodies, implying a rejection of higher or lower prices. Long upper wicks can indicate selling pressure, whereas long lower wicks suggest buying interest.
These patterns are valued for their ability to signal shifts in market dynamics and are often used to forecast potential changes in price direction.
Engulfing
The engulfing pattern is a powerful candlestick formation that serves as a momentum reversal indicator. It consists of a smaller candle followed by a larger one whose body completely covers the previous candle's body.
In a downtrend, a bullish engulfing pattern emerges when a small bearish candle is followed by a larger bullish candle, signaling a potential reversal to an uptrend. The opposite is true for a bearish engulfing pattern during an uptrend, which may herald the start of a downtrend.
👍 Pros:
• Strong visual signal of market reversal
• Can be used as a standalone trigger or in combination with other indicators
• Bullish engulfing at support or bearish at resistance adds to the reliability
👎 Cons:
• Without confirmation, it may be less reliable
• Not immune to false signals in volatile or ranging markets
Tips:
-
Seek higher volume on the engulfing day for validation
-
Look for additional confirmation, such as a pivot point breach
-
Place stop-loss orders just beyond the engulfing candle to mitigate risk
Engulfing pattern
The chart example illustrates an engulfing pattern where the small bullish candle is followed by a larger bearish candle (which eclipses or “engulfs” the smaller bullish candle), potentially indicating a shift from bullish to bearish sentiment and an opportunity for a short position.
Long wick candles
Long-wick candles, also known as candles with long wicks or shadows, indicate significant price rejection within a single trading period.
A long upper wick indicates that the price was pushed up but then fell back down, suggesting selling pressure. Conversely, a long lower wick shows buying pressure, as prices were driven down but then pulled back up. These candles can occur in any trend and often signal a potential reversal or a weakening of the current trend.
👍 Pros:
• Signals potential reversal points
• Can indicate strong support or resistance levels
👎 Cons:
• Single candles may provide weaker signals without context
• Requires confirmation from subsequent candles or volume data
Tips:
-
Look for a high volume to confirm the rejection indicated by the long wick
-
Use in conjunction with other technical analysis tools for best results
-
Consider the overall market trend and recent price action for context
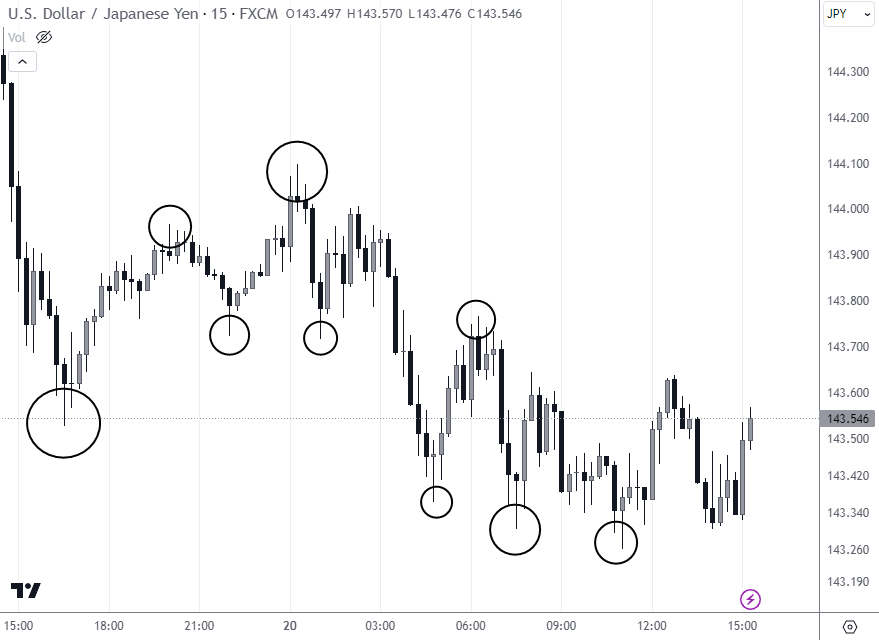
Long wick candles
The attached chart displays several long-wick candles. The long lower wicks circled at the bottom suggest areas where the market rejected lower prices and could be potential support zones. Conversely, the long upper wicks circled at the top where the market failed to sustain higher prices might indicate resistance zones. In both cases, these may indicate a potential reversal incoming.
How to use patterns for day trading
Effectively using patterns in day trading involves several key steps:
-
Identify the main trend and key levels: Ascertain the market's direction and pinpoint major support and resistance levels. This sets the stage for pattern recognition.
-
Recognize the day trading pattern: Within the identified trend, look for specific patterns that signal potential trade opportunities.
-
Seek confirmation: Before acting, confirm the pattern with additional indicators or increased trading volume to reduce false signals.
-
Set take profit and stop loss: Determine your exit strategy in advance. Establish a take profit (TP) level where you anticipate the price will reach and a stop loss (SL) to limit potential losses.
-
Manage the trade: Adjust your strategy as the market moves. This might involve modifying stop losses or taking partial profits.
-
Maintain a trading journal: Record your trades, noting the patterns used, entry and exit points, and outcomes. This is vital for refining your strategy over time.
Do day trading patterns work?
Day trading patterns are more than just lines on a chart. They are the culmination of countless traders' decisions, influenced by a wide array of economic, political, and psychological factors.
Technical analysis, the foundation of pattern identification, hinges on the belief that historical price movements and volume data can forecast future market behavior. This method operates under the assumption that markets are cyclical and that certain patterns tend to repeat themselves over time.
Market psychology also plays a pivotal role in pattern formation. It's a reflection of the collective emotions and behaviors of market participants. For instance, fear and greed can drive the markets to extremes, creating distinctive patterns like bubbles or crashes. Understanding these psychological underpinnings is a crucial part of interpreting and predicting market movements through patterns.
Patterns in day trading are not foolproof indicators of future price movements, but they offer a valuable lens through which to view the market. Their efficacy depends on various factors, including market conditions, volume, and the trader's skill in interpreting them. While they can't guarantee profits, they provide a structured approach to analyzing markets, reducing reliance on guesswork and intuition.
In essence, patterns are tools that, when used wisely in conjunction with other analytical methods, can enhance a trader's ability to make more informed decisions.
Tips for day trading using patterns
Day trading using patterns can be a profitable strategy, but it requires discipline, a clear plan, and an understanding of the market. Here are some key tips to help you navigate the complex world of day trading:
-
Set realistic expectations:
-
Understand that day trading is not a shortcut to instant wealth. It requires time to learn and a patient approach to gain consistent profits.
-
Accept that losses are part of the process and use them as learning experiences to refine your strategy.
-
Develop a comprehensive trading strategy:
-
Your trading strategy should be well-defined and tested. It should include specific criteria for entry, exit, and money management rules.
-
Backtest your strategy using historical data to understand how it might perform under various market conditions.
-
Implement strict risk management:
-
Determine the amount of capital you are willing to risk on each trade. A common rule is not to risk more than 1-2% of your trading capital on a single trade.
-
Use stop-loss orders to limit potential losses and take-profit orders to secure gains.
-
Analyze fundamentals:
-
While patterns provide a technical view, understanding the underlying fundamentals can give you an edge. Economic reports, news events, and market sentiment can all influence price movements.
-
Stay informed about the financial health of the asset you're trading, as well as overall market conditions.
-
Examine multiple timeframes:
-
Analyzing different timeframes can offer a more comprehensive view of the market. For instance, a pattern on a longer timeframe can provide context for what you see in a shorter timeframe.
-
This multi-timeframe analysis can improve the accuracy of your trades and help you spot trends earlier.
Summary
Day trading using patterns is a nuanced skill that combines technical analysis, market psychology, and disciplined risk management. Patterns provide a visual language for anticipating market moves, but they must be interpreted within the broader context of market trends and fundamental analysis.
A successful day trader develops a solid trading plan, employs strict risk control, and maintains a commitment to continuous learning and emotional discipline. It's important to set realistic expectations and understand that day trading is not a guaranteed path to quick riches but a strategic endeavor that requires patience and resilience.
Glossary for novice traders
-
1
CFD
CFD is a contract between an investor/trader and seller that demonstrates that the trader will need to pay the price difference between the current value of the asset and its value at the time of contract to the seller.
-
2
Fundamental Analysis
Fundamental analysis is a method or tool that investors use that seeks to determine the intrinsic value of a security by examining economic and financial factors. It considers macroeconomic factors such as the state of the economy and industry conditions.
-
3
Margin Call
A margin call is a demand made by a broker or a financial institution to a trader or investor who is using margin (borrowed funds) to cover potential losses in a trading account. It occurs when the value of the securities or assets held in the account falls below a certain threshold, known as the maintenance margin or margin requirement, as specified by the broker.
-
4
Day trader
A day trader is an individual who engages in buying and selling financial assets within the same trading day, seeking to profit from short-term price movements.
-
5
Long position
A long position in Forex, represents a positive outlook on the future value of a currency pair. When a trader assumes a long position, they are essentially placing a bet that the base currency in the pair will appreciate in value compared to the quote currency.
Related Articles


Team that worked on the article

Vuk stands at the forefront of financial journalism, blending over six years of crypto investing experience with profound insights gained from navigating two bull/bear cycles. A dedicated content writer, Vuk has contributed to a myriad of publications and projects. His journey from an English language graduate to a sought-after voice in finance reflects his passion for demystifying complex financial concepts, making him a helpful guide for both newcomers and seasoned investors.

Dr. BJ Johnson is a PhD in English Language and an editor with over 15 years of experience. He earned his degree in English Language in the U.S and the UK. In 2020, Dr. Johnson joined the Traders Union team. Since then, he has created over 100 exclusive articles and edited over 300 articles of other authors.

Tobi Opeyemi Amure is an editor and expert writer with over 7 years of experience. In 2023, Tobi joined the Traders Union team as an editor and fact checker, making sure to deliver trustworthy and reliable content. The topics he covers include trading signals, cryptocurrencies, Forex brokers, stock brokers, expert advisors, binary options.
Tobi Opeyemi Amure motto: The journey of a thousand miles begins with a single step.
