Top 5 Setups For Entering A Position In Any Market


Editorial Note: While we adhere to strict Editorial Integrity, this post may contain references to products from our partners. Here's an explanation for How We Make Money. None of the data and information on this webpage constitutes investment advice according to our Disclaimer.
In this article, we're going to look at 5 universal categories of trading setups. So that you have an understanding of each setup and can choose the one that best fits your market vision:
- Joining the Existing Trend: Trading pullbacks
- Entering a New trend: Trading breakouts
- Entering an Old trend (Reversal): Trading Divergences
- Counter trend trading: Buying the Panic
- Range trading: Buying at support levels, selling at resistance levels
In the fluctuating markets of Forex and cryptocurrency trading, the right trading setups are crucial. They enhance the likelihood of profitable trades and help manage risks. However, choosing the right setup can be daunting and mistakes in selection or timing can lead to significant losses.
This article explains trading setups, presenting five fundamental types tailored for different market conditions and trading styles. This guide will empower traders to navigate the markets more effectively, making informed decisions that enhance their trading strategies.
What are the 5 types of trading setups?
Traders need versatile strategies to capitalize on market movements, whether the market sentiment is bullish or bearish. Here are five critical types of trading setups:
Joining the Existing Trend: This setup involves identifying and following the current market trend, aiming to profit from its continuation.
Entering a New Trend: This strategy focuses on recognizing the formation of a new trend and entering at its inception to maximize gains.
Entering an Old Trend (Reversal Trading): This approach is used when an existing trend starts to lose momentum, and a reversal is imminent. Traders using this setup will look for signs that a trend is ending to enter at the start of a new opposite trend.
Counter-Trend Trading: This setup aims at identifying overbought or oversold conditions in a trending market to capitalize on incoming reversals.
Range Trading: Suited for markets that are not trending but trading within a consistent range or channel, this setup focuses on buying at the lower boundary and selling at the upper boundary of the range.
Trading Setups on Joining the Existing Market Trend
What is Trend Following?
Trend following is a method where traders align their positions with the current market direction, capitalizing on the momentum of asset prices. It is grounded in the principle that prices move in trends over time, and identifying these can lead to profitable trades.
 Pullback to the lower boundary of the channel within the uptrend. Example of the daily chart of BTC/USD
How to Identify a Trend?
Trends are typically identified through higher highs and higher lows in an uptrend, or lower highs and lower lows in a downtrend. Moving averages can also signal the trend direction, providing a smoothed representation of price action.
How to Trade?
Traders enter the market on pullbacks within a trend, using tools like trend channels and/or Fibonacci retracements for favorable entry points. Indicators such as moving averages and MACD can help in confirming the trend continuation.
Pros and Cons of Trend Following
- Pros
- Cons
- Efficiency: Targets large moves for potentially significant gains.
- Defined Risk: Clear stop-loss points aid risk management.
- False Breaks: Risk of misjudging a trend can lead to losses.
- Late Entries: Lagging indicators may result in delayed trades.
Use Cases:
Trend following suits extended moves seen in Forex or commodities markets, good for disciplined traders who can manage the psychological challenge of withstanding minor price fluctuations.
Trading Setups for Entering a New Trend
What is Breakout, Momentum?
Breakout trading capitalizes on rapid price movements that breach predefined resistance or support levels—indicating the potential start of a new trend. Momentum traders ride the wave of these movements, aiming to benefit from the market's acceleration.
How to Identify a New Trend?
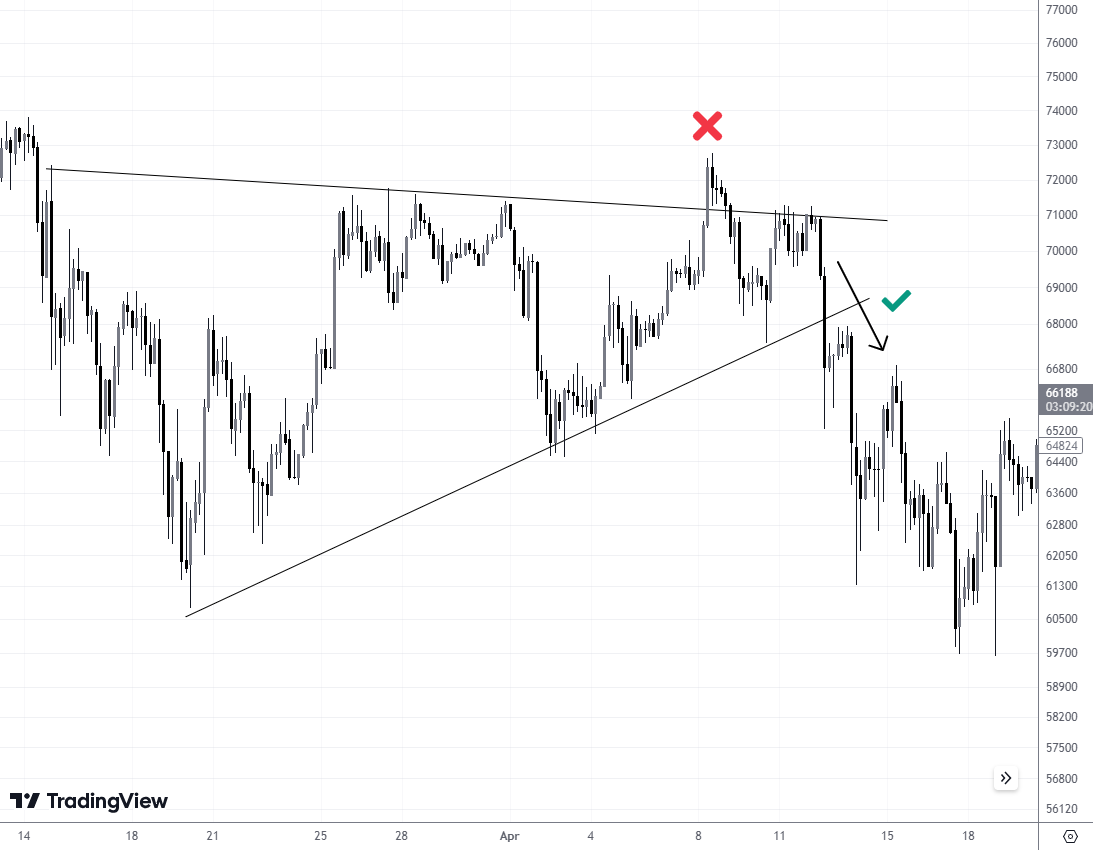
A new trend can be signaled by a price moving beyond a consolidation area (is shown as a narrowing triangle in the example above) or surpassing a significant high or low. The breakout should be on higher volume to confirm the strength behind the move.
How to Trade?
Upon identifying a breakout, traders may enter a position in the direction of the trend. Confirmatory indicators like moving averages or volume spikes can provide additional confidence to the trade.
Chart Patterns: Patterns like triangles, rectangles, and head and shoulders can precede significant breakouts.
Psychological Levels: Round numbers or historical highs and lows often serve as key levels for breakouts.
Using Indicators: Tools like RSI and volume can corroborate the strength of a breakout.
Pros and Cons of Breakout Trading
- Pros
- Cons
- Quick Gains: Breakouts can lead to rapid profits if the new trend continues strongly.
- Clear Entry/Exit: Breakout points provide definitive entry and exit levels.
- False Breakouts: Not all breakouts sustain, leading to potential losses.
- Volatility: Breakouts can be volatile, requiring tight risk management.
Use Cases:
Breakout trading is best used in markets with strong trends, such as cryptocurrencies. It's well-suited for traders who can act quickly and decisively in response to emerging trends.
Setups for Trend Reversal Trading
Why Trends End?
Trends end when the prevailing market sentiment shifts, often due to changes in fundamental factors, market psychology, or technical realignments. This can lead to a reversal of the current trend.
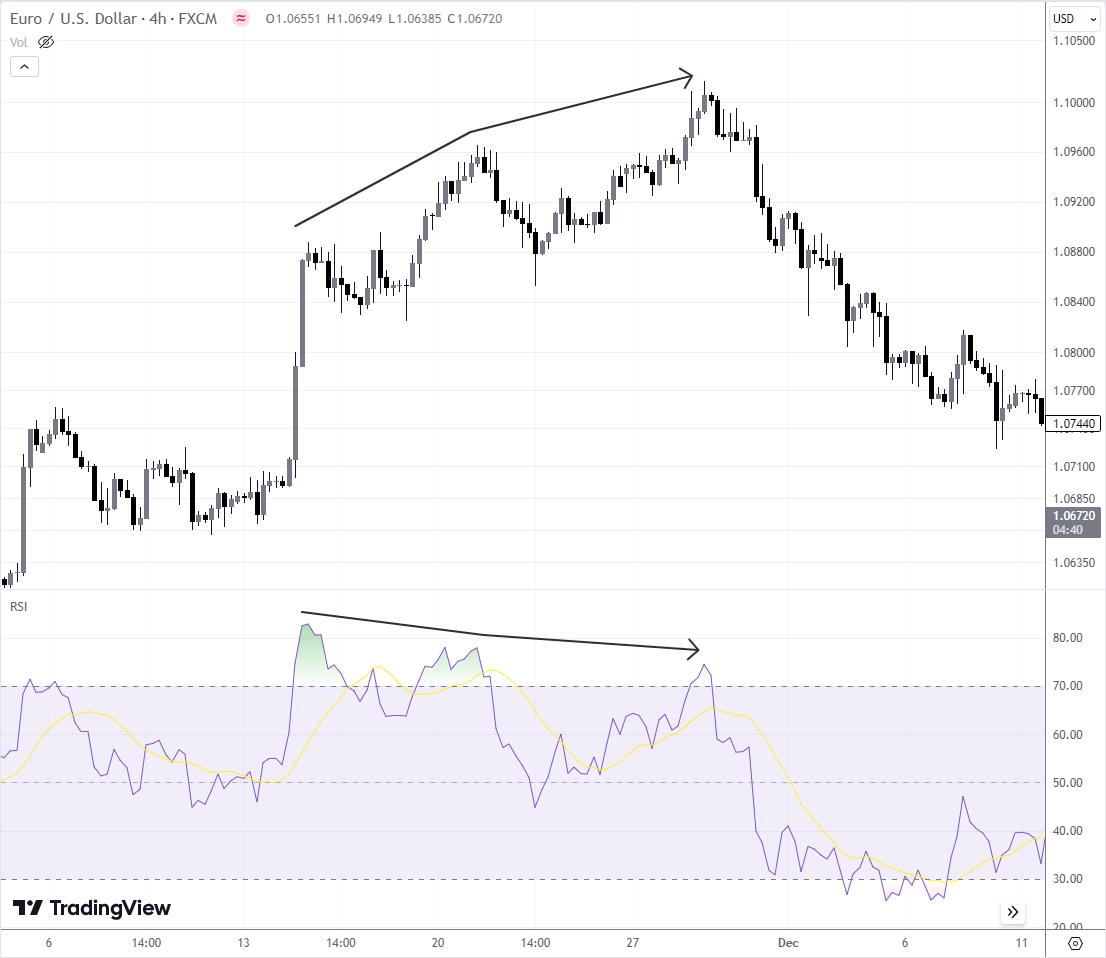
EUR/USD Hourly chart: the bullish trend has exhausted. This can be seen from the divergence signals, after which the reversal took placeHow to Identify an Exhausting of the Trend?
Exhaustion of a trend can be spotted through diminishing price momentum, lower volume on new highs or lows, and price failing to maintain beyond key support or resistance levels. Technical indicators like divergence between price and momentum oscillators can also signal weakness.
How to Trade?
Trading a trend reversal involves identifying potential reversal patterns such as double tops or bottoms, head and shoulders, or wedge patterns. Traders look to enter trades as the price breaks past the neckline (in head and shoulders) or support/resistance lines confirming the reversal.
Chart Patterns: Recognizable patterns that indicate a trend may be reversing.
Old Support and Resistance: These levels can become pivot points for a reversal.
Divergences: Occur when price action and an oscillator like RSI or MACD fail to confirm each other, often a precursor to a reversal.
Pros and Cons of Trading Trend Reversals
- Pros
- Cons
- Rewarding: Can capture significant moves from the beginning.
- Risk Management: Reversal setups often have well-defined risk parameters.
- False Signals: Reversals are notoriously difficult to predict accurately.
- Timing: Entering too early or too late can affect profitability.
Use Cases
Trend reversal setups are suitable for markets with established trends where traders can anticipate significant shifts. They work well for traders who have a keen understanding of market sentiment and technical analysis.
Wondering how to spot an incoming trend reversal? Our article The most accurate trend-reversal indicators can help.
Setups for Counter-Trend Trading
What is Counter-Trend Trading?
Counter-trend trading is the strategy of taking trades against the prevailing market trend. Traders look for potential reversals in the trend to enter trades in the opposite direction.
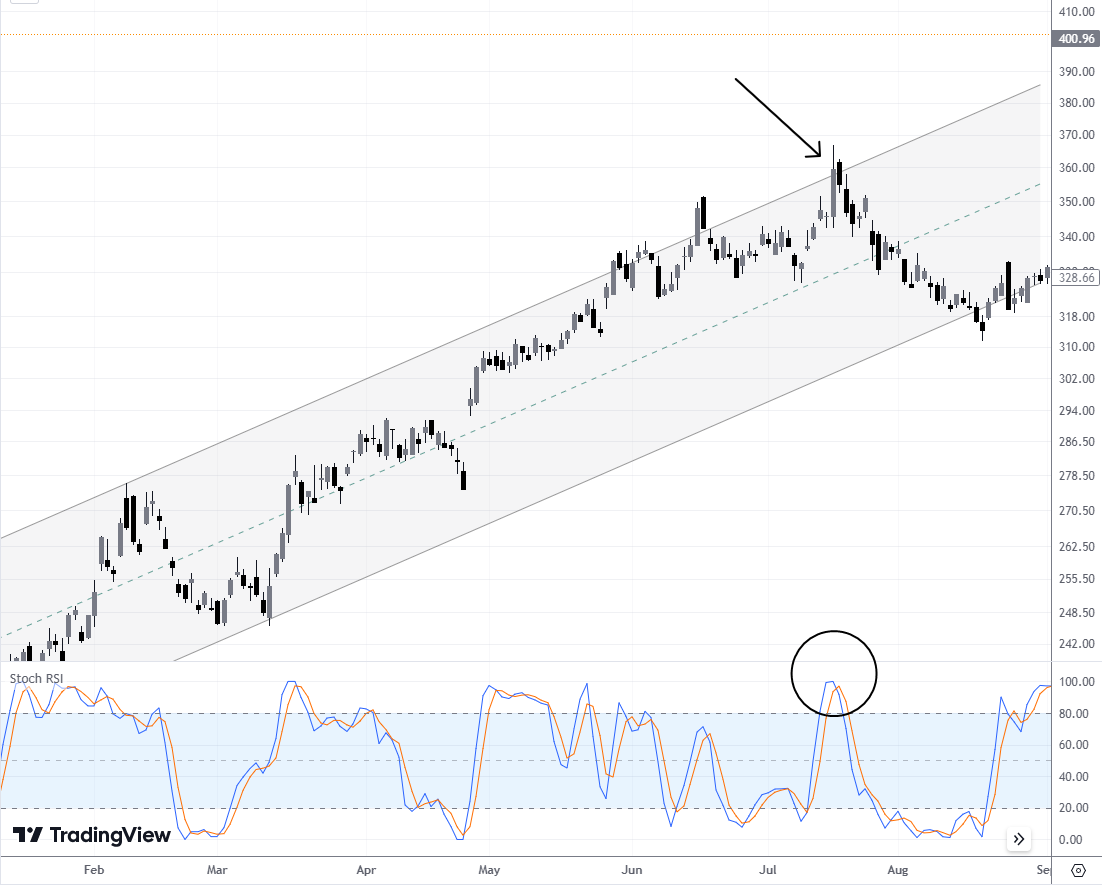 How to Identify Overbought and Oversold Zones?
Overbought and oversold zones can be identified using oscillators such as the Relative Strength Index (RSI) or the Stochastic oscillator. These tools measure the momentum and highlight extreme price conditions where reversals may occur.
How to Trade?
Traders enter counter-trend positions when indicators suggest an asset is overextended. They often set trades around historical support and resistance levels that could indicate a bouncing point for price.
Old Support and Resistance: These levels can act as bounce areas for counter-trend moves.
Indicators: Apart from RSI and Stochastics, the Bollinger Bands can also show overbought or oversold conditions.
Candlestick Patterns Reversal candlestick formations can provide entry points for counter-trend strategies.
Pros and Cons of Counter-Trend Trading
- Pros
- Cons
- High Reward Potential: Counter-trend moves can be sharp, offering significant profit potential.
- Defined Entry Points: Overbought and oversold conditions give clear entry signals.
- High Risk: Trading against the trend can lead to losses if the primary trend resumes.
- Complexity: Requires accurate timing and often more sophisticated analysis.
Use Cases
Counter-trend setups are most applicable in highly volatile markets where price swings are frequent. They are best suited for experienced traders who can quickly interpret signals and manage the inherent risks.
Setups for Range Trading
What is Range Trading
Range trading, or consolidation, is a strategy employed when a market is not trending in a particular direction but is instead moving within a horizontal price channel. It involves identifying the upper and lower bounds where the price fluctuates.
 Range trading/consolidation shown on the USD / CAD daily chart in TradingView
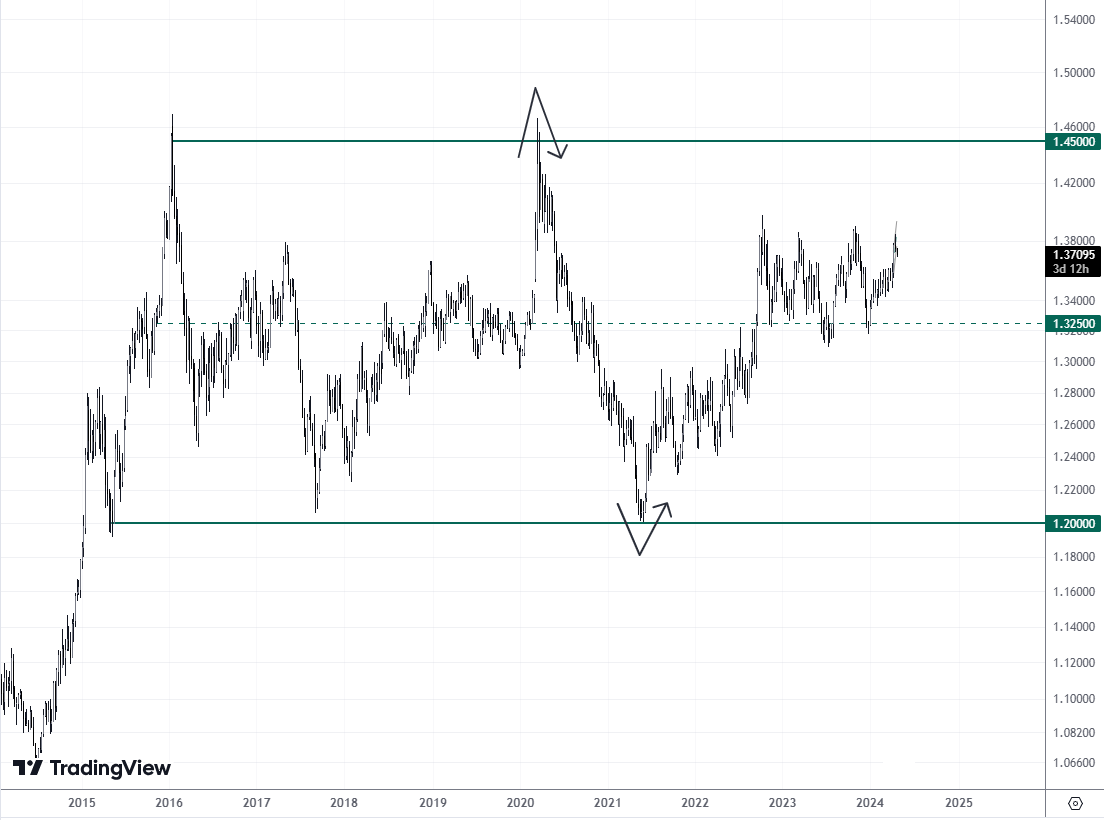
How to Identify a Flat Market?
A flat or range-bound market is identified by price action that is consistently bouncing between two horizontal levels – the resistance (upper boundary) and support (lower boundary), without trending upward or downward for a significant period.
How to Trade?
Range traders buy at or near the support level and sell at or near the resistance level, capitalizing on the predictable swings between these two price extremes.
Channels: Drawing horizontal lines at support and resistance levels creates a channel that can guide range trading decisions.
Indicators: Oscillators like the Stochastic or RSI can signal when the price is at the range’s extremes.
Price Action: Candlestick patterns at the boundaries can strengthen the decision to enter or exit trades.
Pros and Cons of Range Trading
- Pros
- Cons
- Defined Entry/Exit: Clear support/resistance levels provide specific trade entry and exit points.
- Frequent Opportunities: A range-bound market offers multiple trading opportunities within the same price levels.
- Breakouts: A strong price breakout can lead to significant losses if a trade is on the wrong side.
- Limited Profit: Profits are capped by the range's height.
Use Cases
Range trading is effective in stable, non-trending markets and is well-suited for cautious traders who prefer clearly defined risk and reward parameters. It's also a good fit for algorithmic strategies that can exploit the range boundaries.
Choosing a broker to apply trading setups effectively
The effectiveness of any trading setup depends not only on strategy but also on execution conditions, including spreads, speed, and platform reliability. The table below highlights brokers that offer the tools and infrastructure needed to apply different trading setups consistently across market conditions.
| zForex | Plus500 | Trading.com USA | OANDA | FOREX.com | |
|---|---|---|---|---|---|
|
Min. deposit, $ |
10 | 100 | 50 | No | 100 |
|
Tradable assets |
80 | 2800 | 69 | 129 | 5500 |
|
Standard EUR/USD spread |
0.3 | 0.7 | 1.1 | 0.3 | 1.0 |
|
Max. leverage |
1:1000 | 1:300 | 1:50 | 1:200 | 1:50 |
|
Max. Regulation Level |
Not regulated | Tier-1 | Tier-1 | Tier-1 | Tier-1 |
|
TU overall score |
7.89 | 7.52 | 6.81 | 6.8 | 6.74 |
|
Open an account |
Go to broker Your capital is at risk.
|
Go to broker 80% of retail CFD accounts lose money. |
Go to broker Your capital is at risk. |
Go to broker Your capital is at risk. |
Study review |
Which trading strategy is most successful?
Unfortunately, there isn’t one strategy that is the end-all-be-all of trading. Success varies per individual and market condition, with no single setup reigning supreme. To navigate this, aspiring traders should:
Open an Account: Choose a reputable broker that suits your trading needs.
Use Demo Accounts and Back-tests:Test strategies in a risk-free environment to gauge their effectiveness.
Apply Risk Management: Transition to a real account with tools like stop losses to manage potential losses.
Experimentation can lead to a hybrid approach; for instance, spotting reversals on a higher timeframe to capture overarching sentiment and executing breakouts on a lower timeframe for entry precision. The synergy of setups often holds the key to a trader's consistency.
Consistency comes from adapting to market conditions, not forcing setups

I do not look for one setup that works in every market, because that setup does not exist. What I look for first is market behavior: whether price is expanding, stalling, rejecting levels, or compressing before a move. Only after that do I choose how to act. In my view, traders become more consistent when they stop forcing favorite patterns onto every chart and start matching their entries to the structure actually in front of them.
My main recommendation is to specialize before diversifying. I would rather see a trader master one or two setups in one market type than jump between five methods with no real edge in any of them. In practice, that means reviewing trades not only by profit or loss, but by context: Was the market trending, ranging, or unstable? That habit usually improves decision-making faster than adding more indicators ever will.
Conclusion
Mastering the art of timing your entries is the cornerstone of successful trading, and the top five setups discussed—ranging from breakouts to pullbacks—can greatly sharpen your edge. Whether you’re navigating Forex volatility or riding the wave of crypto trends, applying these setups with discipline can help you capitalize on high-probability moments while controlling your risk. For example, waiting for a confirmed breakout rather than chasing price ensures you’re entering when momentum is in your favor. Ultimately, a disciplined approach to these proven setups transforms guesswork into a repeatable system, giving you the confidence to act decisively in any market. Remember, consistent success begins not just with knowing when to trade, but with having the conviction to follow your plan every time.
FAQs
What are the main signs that indicate a pullback is suitable for trend-following trades?
How does trading volume impact the reliability of breakout setups?
Which technical indicators are commonly used to spot trend reversals?
What role do support and resistance levels play in range trading setups?
Editors' Top Picks and Insights

Hunting crypto owners: Why criminals have gone offline

BitMEX is shutting down: Why Trump could not save the exchange

Do governments need crypto workers?

Brent nears $100: Why oil prices are rising

Gram Wallet launch: Can Telegram bring crypto to the masses?

AI without limits: How dangerous are neural networks?
Related Articles
Team that worked on the article
Vuk stands at the forefront of financial journalism, blending over six years of crypto investing experience with profound insights gained from navigating two bull/bear cycles. A dedicated content writer, Vuk has contributed to a myriad of publications and projects.
Dr. BJ Johnson is a PhD in English Language and an editor with over 15 years of experience. He earned his degree in English Language in the U.S and the UK.
Mirjan Hipolito is a journalist and news editor at Traders Union. She is an expert crypto writer with five years of experience in the financial markets.
Volatility refers to the degree of variation or fluctuation in the price or value of a financial asset, such as stocks, bonds, or cryptocurrencies, over a period of time. Higher volatility indicates that an asset's price is experiencing more significant and rapid price swings, while lower volatility suggests relatively stable and gradual price movements.
Trading divergence in Forex involves identifying when the price of a currency pair and an oscillator (such as RSI, MACD, or Stochastic) move in opposite directions, indicating potential trend reversals or continuations.
Bollinger Bands (BBands) are a technical analysis tool that consists of three lines: a middle moving average and two outer bands that are typically set at a standard deviation away from the moving average. These bands help traders visualize potential price volatility and identify overbought or oversold conditions in the market.
A forex bonus is a promotional incentive offered by brokers to attract traders, typically providing additional funds or trading benefits upon fulfilling certain conditions.
Risk management in Forex involves strategies and techniques used by traders to minimize potential losses while trading currencies, such as setting stop-loss orders and position sizing, to protect their capital from adverse market movements.

-
 Afghanistan
-
 Albania
-
 Algeria
-
 Angola
-
 Argentina
-
 Armenia
-
 Australia
-
 Austria
-
 Azerbaijan
-
 Bahamas
-
 Bahrain
-
 Bangladesh
-
 Belarus
-
 Belgium
-
 Bolivia
-
 Botswana
-
 Brazil
-
 Brunei
-
 Bulgaria
-
 Cambodia
-
 Cameroon
-
 Canada
-
 Chile
Chile
-
 China
China
-
 Colombia
-
 Congo
Congo
-
 Costa Rica
-
 Cote d'Ivoire
-
 Croatia
-
 Cuba
Cuba
-
 Cyprus
-
 Czechia
-
 DR Congo
-
 Denmark
-
 Dominican Republic
-
 Ecuador
-
 Egypt
Egypt
-
 El Salvador
-
 Estonia
-
 Eswatini
-
 Ethiopia
-
 Finland
-
 France
-
 Georgia
-
 Germany
-
 Ghana
Ghana
-
 Greece
-
 Haiti
Haiti
-
 Hong Kong
-
 Hungary
-
 India
India
-
 Indonesia
-
 Iran, Islamic republic
-
 Iraq
Iraq
-
 Ireland
-
 Israel
-
 Italy
Italy
-
 Jamaica
-
 Japan
Japan
-
 Jordan
-
 Kazakhstan
-
 Kenya
Kenya
-
 Korea
Korea
-
 Kuwait
-
 Kyrgyzstan
-
 Laos
Laos
-
 Latvia
-
 Lebanon
-
 Lesotho
-
 Libya
Libya
-
 Lithuania
-
 Luxembourg
-
 Madagascar
-
 Malaysia
-
 Malta
Malta
-
 Mauritius
-
 Mexico
-
 Moldova
-
 Mongolia
-
 Montenegro
-
 Morocco
-
 Mozambique
-
 Myanmar
-
 Namibia
-
 Nepal
Nepal
-
 Netherlands
-
 New Zealand
-
 Nigeria
-
 North Macedonia
-
 Norway
-
 Oman
Oman
-
 Pakistan
-
 Palestine
-
 Panama
-
 Papua New Guinea
-
 Paraguay
-
 Peru
Peru
-
 Philippines
-
 Poland
-
 Portugal
-
 Puerto Rico
-
 Qatar
Qatar
-
 Reunion
-
 Romania
-
 Rwanda
-
 Saudi Arabia
-
 Serbia
-
 Singapore
-
 Slovakia
-
 Slovenia
-
 Somalia
-
 South Africa
-
 Spain
Spain
-
 Sri Lanka
-
 Sweden
-
 Switzerland
-
 Syria
Syria
-
 Taiwan
-
 Tajikistan
-
 Tanzania
-
 Thailand
-
 Trinidad and Tobago
-
 Tunisia
-
 Turkey
-
 UAE
UAE
-
 Uganda
-
 Ukraine
-
 United Kingdom
-
United States
-
 Uruguay
-
 Uzbekistan
-
 Venezuela
-
 Vietnam
-
 Yemen
Yemen
-
 Zambia
-
 Zimbabwe
- Forex
- Crypto
