How to trade engulfing candle in Forex trading
To trade engulfing candles in Forex trading, identify bullish or bearish engulfing patterns on your chart and use them as entry signals. You can also combine engulfing patterns with other technical indicators, such as moving averages or the RSI, to enhance their effectiveness and increase the probability of successful trades.
Do you want to start trading Forex? Open an account on Roboforex!How to trade bullish and bearish engulfing patterns
In the dynamic world of Forex trading, the ability to recognize and capitalize on powerful candlestick patterns is essential for success. Among these patterns, bullish and bearish engulfing patterns stand out as highly reliable signals that can provide valuable insights into market sentiment and potential price reversals. In this comprehensive guide, the experts at TU will delve into the intricacies of trading engulfing candles in Forex, exploring how to identify, interpret, and execute trades based on these unique patterns.
Best Forex Candlestick Patterns - Bullish & BearishWhat is an engulfing candle?
Engulfing candles are significant candlestick patterns that signal potential trend reversals in the Forex market. These patterns occur when the body of one candle completely engulfs the body of the preceding candle, reflecting a strong shift in market sentiment. Engulfing candles can be divided into two types: bullish engulfing candles and bearish engulfing candles. Each type provides valuable insights into the direction of the market and helps traders identify potential trading opportunities.
Bullish engulfing candle
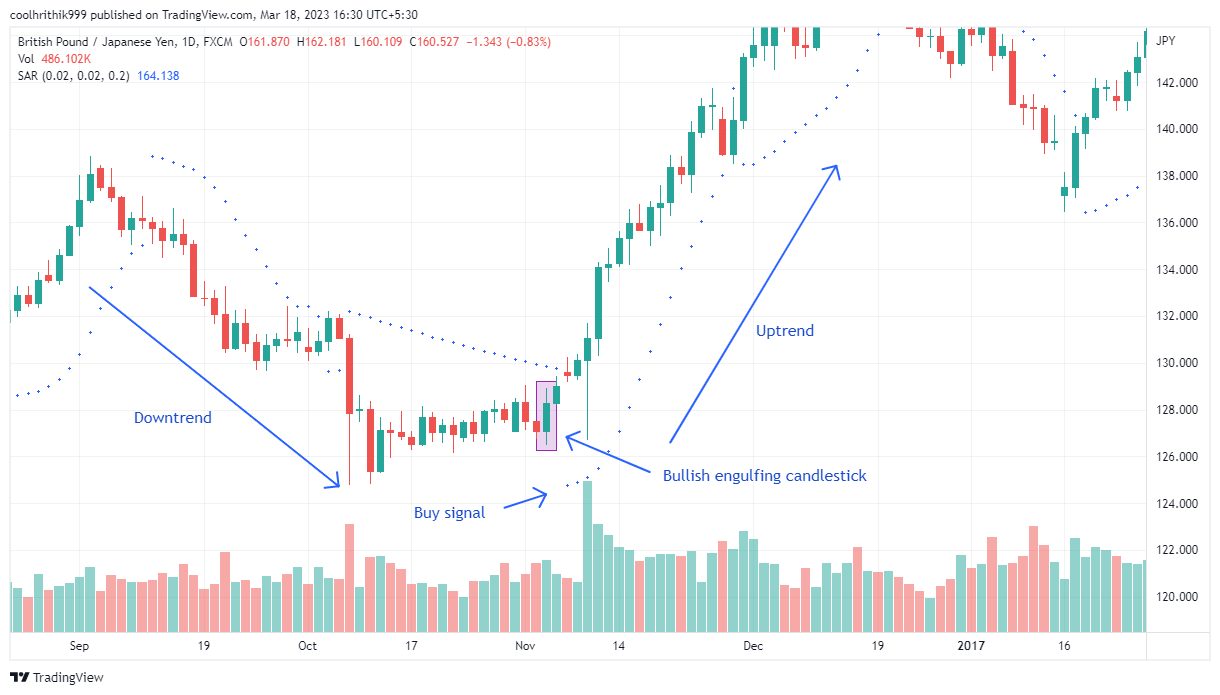
A bullish engulfing candle is a powerful pattern that signals the beginning of a potential uptrend. This pattern occurs after a series of red (or black) candles indicating a bearish trend. The bullish engulfing pattern consists of a green (or white) candle whose body entirely surrounds the previous day's red (or black) candlestick. This pattern is an indication that more buyers have entered the market, driving the price upward and resulting in a trend reversal. Traders often view the appearance of a bullish engulfing candle at the bottom of a downtrend as a strong buying opportunity.
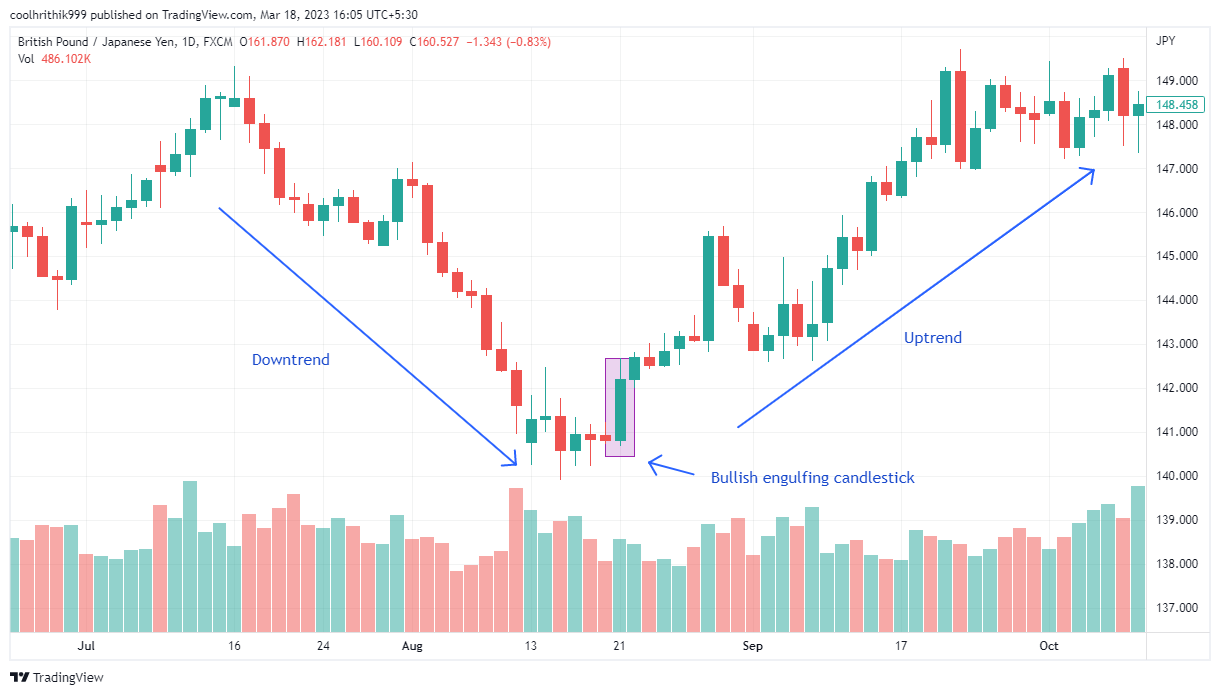
Bullish engulfing candle pattern
Bearish engulfing candle
Conversely, a bearish engulfing candle serves as a warning sign for a potential downtrend. This pattern is the exact opposite of the bullish engulfing pattern and consists of a short green candle that is entirely covered by the subsequent red candle. The first candlestick in this pattern represents the bulls' control of the market, while the second candlestick shows that bearish pressure has pushed the market price lower. In a bearish engulfing pattern, the second period typically opens higher than the previous day but closes significantly lower, reflecting a shift in market sentiment.
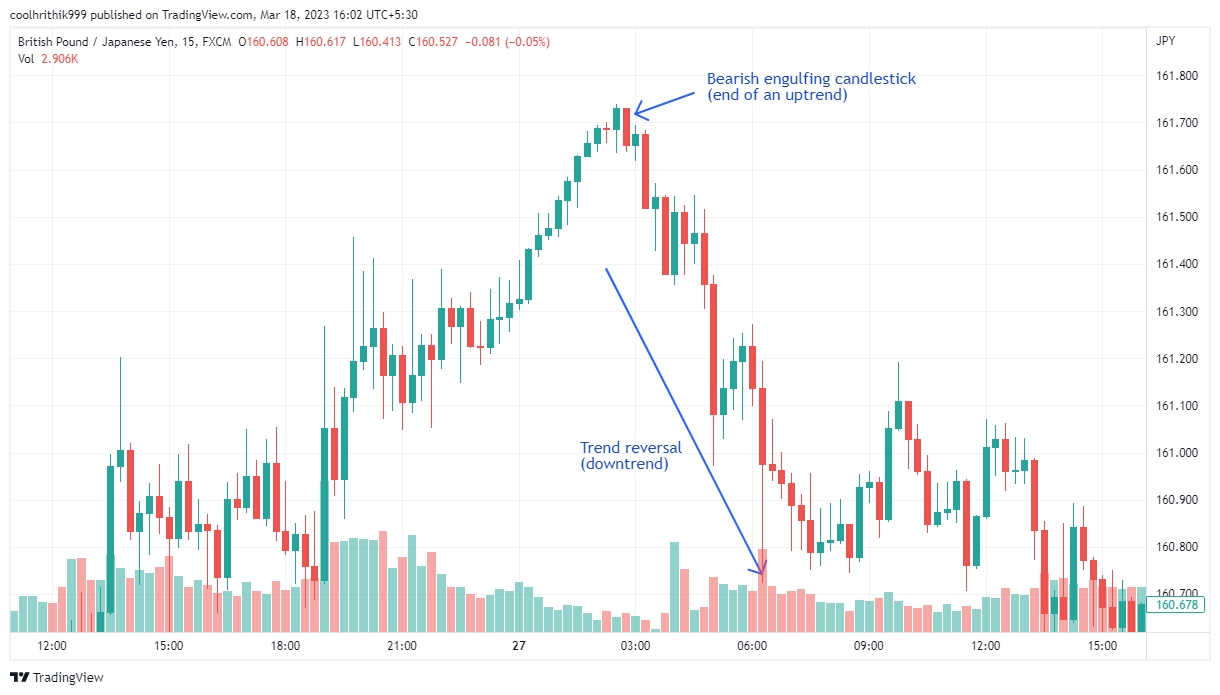
Bearish engulfing candle pattern
| Type of candlestick | Formation | Location |
|---|---|---|
Bullish Engulfing | A green candle fully envelops the prior, smaller red candle | End of a downtrend |
Bearish Engulfing | A red candle fully envelops the prior, smaller green candle | Top of an uptrend |
Is the engulfing candle pattern reliable?
The reliability of engulfing candle patterns as a trading signal has long been a topic of debate among traders and market analysts. While these patterns can provide valuable insights into potential trend reversals, it's essential to consider various factors that can influence their effectiveness. In this section, we will analyze the reliability of engulfing candle patterns by examining their strengths and weaknesses, as well as discussing how traders can improve their accuracy by combining them with other technical indicators.
Strengths of engulfing candle patterns
Clear signals: One of the most significant advantages of engulfing candle patterns is their straightforward nature. These patterns are easy to identify, which allows traders to quickly spot potential trend reversals and make timely decisions.
High probability: Engulfing patterns tend to have a high probability of indicating trend reversals, particularly when they occur in conjunction with other confirming factors such as key support and resistance levels or oversold/overbought conditions.
Universally applicable: Engulfing patterns can be found in various financial markets, including Forex, stocks, and commodities. This versatility makes them valuable tools for traders across different asset classes.
Limitations of engulfing candle patterns
False signals: Like any other technical analysis tool, engulfing patterns can occasionally generate false signals. This can happen when the pattern is formed during periods of market consolidation or when there is insufficient follow-through buying or selling pressure.
Isolated analysis: Relying solely on engulfing patterns to make trading decisions can lead to false opportunities or increased risk. It's essential to combine these patterns with other technical indicators and market analysis techniques to improve their reliability.
How to use engulfing candle patterns?
To maximize the effectiveness of engulfing candle patterns, it's essential to use them in confluence with other technical indicators. This combination of tools allows traders to spot high-probability trade setups, determine optimal entry and exit points, and manage risk more effectively. In this section, we will explore various complex indicators that can be used in conjunction with engulfing patterns to enhance trading performance.
MACD
The Moving Average Convergence Divergence (MACD) is a popular momentum indicator that can be used alongside engulfing patterns to confirm trend reversals. When the MACD line crosses the signal line in the direction of the engulfing pattern, it provides additional confirmation of a potential trend change. For example, a bullish engulfing pattern accompanied by a positive MACD crossover can signal a strong buying opportunity. We have illustrated it in the chart below.
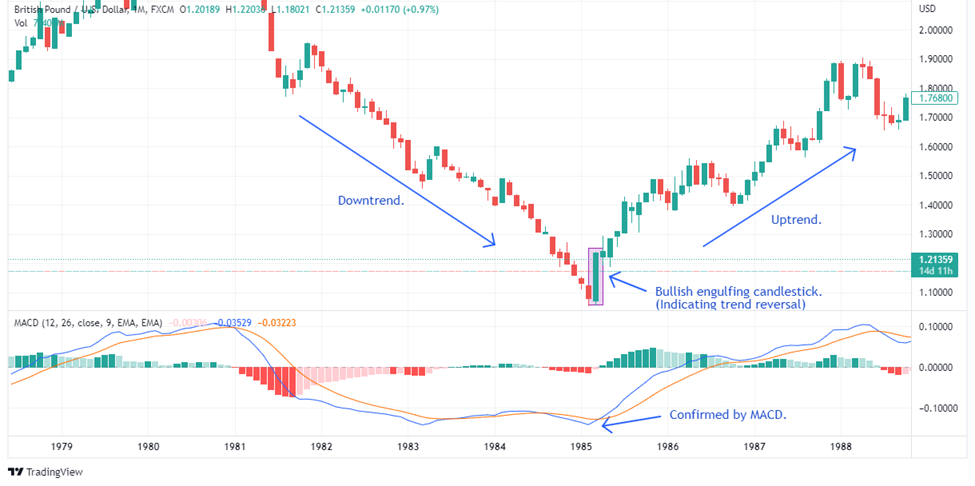
MACD indicator
Moving Averages
Moving averages (MAs) are widely-used tools for identifying trends and potential support and resistance levels. When an engulfing pattern forms near a key moving average, such as the 13-day and 26-day EMA, it can signal a strong reversal point. Combining engulfing patterns with MAs helps traders identify high-probability trade setups and improve the overall accuracy of their trading signals.
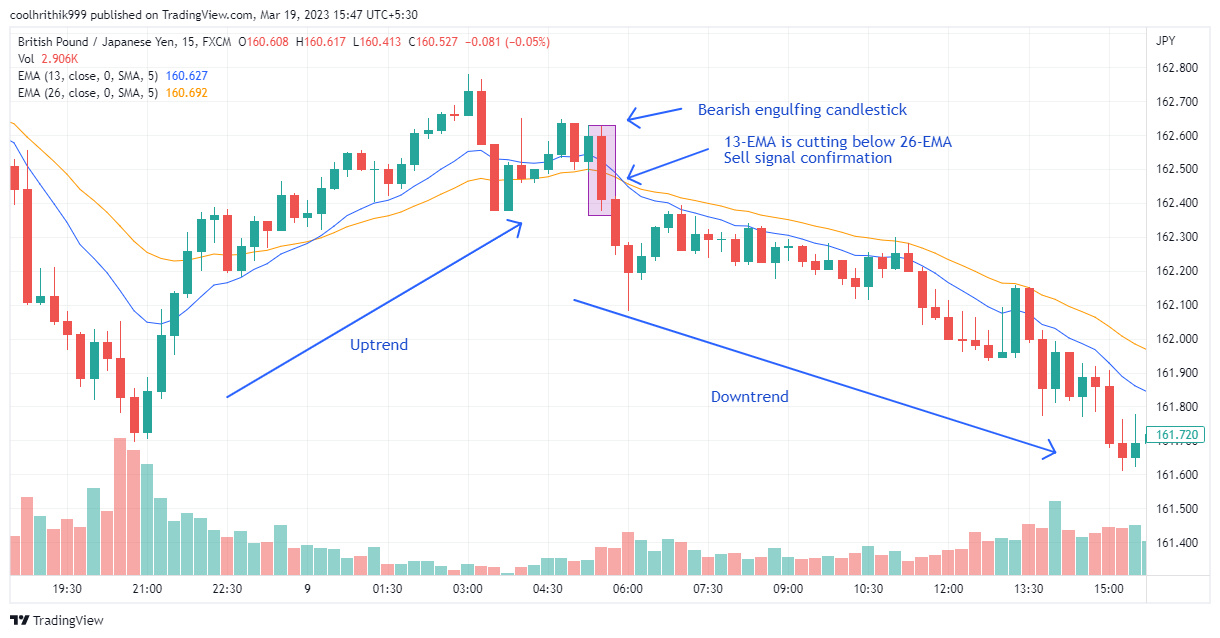
Moving averages indicator
Parabolic SAR
The Parabolic Stop and Reverse (SAR) indicator is a valuable tool for identifying trend direction and potential reversal points. When an engulfing pattern coincides with a Parabolic SAR reversal, it can provide a strong confirmation of a trend change. For instance, a bullish engulfing pattern accompanied by a Parabolic SAR reversal from above to below the price can indicate a potential uptrend.
Parabolic SAR indicator
How to use engulfing patterns effectively?
Engulfing patterns can be powerful tools for traders, offering insights into potential reversals, trend continuation, and exit signals. To harness the full potential of engulfing patterns, it's essential to understand their various applications and employ them strategically in your trading approach. In this section, TU experts will explore several ways to use engulfing patterns effectively, delving into extreme detail for each application.
Spotting reversals: One of the primary uses of engulfing patterns is to identify potential trend reversals. By carefully monitoring the market for bullish and bearish engulfing patterns, traders can pinpoint optimal entry points for new trades. When a reversal pattern is spotted, it's crucial to confirm the signal with additional technical indicators, such as the RSI, MACD, or Stochastic Oscillator. This confluence of signals increases the likelihood of a successful trade and helps traders ride the new trend to completion.
Trend continuation: Engulfing patterns can also serve as a confirmation of an existing trend's strength. For instance, if a bullish engulfing pattern appears during the retracement of an uptrend, it suggests that the trend is likely to continue, providing traders with more conviction in their current positions. Similarly, a bearish engulfing pattern during a retracement of the downtrend can indicate that the downward trend is still strong.
Exit strategy: Engulfing patterns can be valuable exit signals for existing trades. If a trader holds a position in a trend that appears to be nearing its end, an opposing engulfing pattern can signal that it's time to close the position. For example, if a trader is long in an uptrend and a bearish engulfing pattern forms, it might be a sign to exit the trade and lock in profits.
How to trade Forex using engulfing patterns?
Experts have prepared a straightforward three-step process to use engulfing patterns effectively:
Step 1: Identify the Pattern
First, keep an eye out for engulfing patterns on your Forex chart. These patterns show up when a larger candle (either bullish or bearish) follows a smaller candle in the opposite direction. Wait for a confirmation candle after spotting the pattern.
Step 2: Enter the Trade
To open a long (buy) position, enter the trade above the high of the bullish engulfing pattern. For a short (sell) position, enter the trade below the low of the bearish engulfing pattern.
Step 3: Set Profit Targets and Stop-Loss Orders
Establish your profit targets and stop-loss orders to manage your risk effectively. As a general rule of thumb, most traders place profit targets above the entry point for bullish engulfing patterns and below the entry point for bearish engulfing patterns. Similarly, stop-loss orders are set below the low of the bullish candle for long positions and above the high of the bearish candle for short positions.
Best Forex brokers
RoboForex


RoboForex is a brokerage company that was founded in 2009. It provides services to financial markets in 169 countries. More than 3.5 million users are RoboForex clients. RoboForex is the leading software developer in the Forex industry.
RoboForex is recognized as a reliable partner by the most respected financial market experts. The company has won numerous prestigious awards. The RoboForex group of companies has an international license to provide services from FSC Belize, and a European license from CySEC (license No. is 191/13 Robomarkets Ltd).
EXNESS Group

Exness Trading Company has been working in the Forex market since 2008. The broker operates legally in more than 130 countries, fully complying with local laws in all jurisdictions. The Exness group of companies holds licensed issued by the following regulatory authorities: FCA (UK), CySEC (Cyprus), FSA (Seychelles), CBCS (Curacao and Saint Martin) FSC (British Virgin Islands), FSC (Mauritius), FSCA (South Africa) , CMA (Kenya).
The broker holds the leading position in Forex ratings. The company’s monthly trading turnover totals $325.8 billion USD. The broker currently has CFDs available for cryptocurrency, stocks, more than 120 currency pairs, energy and metals. Exness’s service provides favorable working conditions for traders: low commission, instant execution of orders and withdrawal of funds. There are several options for opening an account depending on the traders’ needs. A demo account is available - a training account that is useful for both beginner level traders and professional traders.
Tickmill

Tickmill brokerage introduces a new standard in the provision of brokerage services. The focus on innovation is what the company is proud of and why traders choose it. The trading conditions of the broker are appreciated by fans of scalping and passive trading with the help of robots because Tickmill provides minimal spreads. The company has earned many awards. Thus, for two years in a row (2018 and 2019), it was awarded the “Best Execution Broker” title, and it also won the “Most Transparent Broker” title in 2019.
Summary
In Forex trading, bullish and bearish engulfing patterns are significant candlestick patterns that signal potential trend reversals. A bullish engulfing pattern occurs when a larger green or white candle engulfs a smaller red or black candle, indicating a potential uptrend. Conversely, a bearish engulfing pattern forms when a larger red candle engulfs a smaller green candle, suggesting a possible downtrend. To trade Forex using engulfing patterns, follow these steps: (1) identify the pattern on your chart, (2) enter the trade above the high of a bullish engulfing pattern or below the low of a bearish engulfing pattern, and (3) set profit targets and stop-loss orders to manage your risk. Combining engulfing patterns with other technical indicators, such as MACD, moving averages, Parabolic SAR, RSI, Stochastic Oscillator, and support and resistance lines, can improve their effectiveness in identifying high-probability trade setups.
FAQ
Which time frame is best for engulfing candles?
The best time frame for engulfing candles depends on your trading style and strategy. Engulfing patterns can be found across various time frames, from 1-minute to monthly charts. However, higher time frames like the 4-hour, daily, and weekly charts tend to produce more reliable and robust signals, as they encompass more significant price movements and reduce the impact of market noise.
What is an engulfing candle in Forex?
An engulfing candle in Forex is a candlestick pattern that signals a potential trend reversal in the market. It occurs when the body of one candle completely engulfs the body of the preceding candle, reflecting a strong shift in market sentiment. Engulfing candles can be divided into two types: bullish engulfing candles (indicating a potential uptrend) and bearish engulfing candles (suggesting a possible downtrend).
How does an engulfing candle work?
An engulfing candle works by signaling a shift in market sentiment and a potential trend reversal. A bullish engulfing pattern forms when a larger green candle engulfs a smaller red candle, suggesting that buying pressure has increased and a potential uptrend may follow. A bearish engulfing pattern occurs when a larger red candle engulfs a smaller green candle, indicating that selling pressure has risen and a possible downtrend may ensue. Traders use these patterns to identify potential trading opportunities and enter or exit trades accordingly.
What is the win rate of engulfing patterns?
The win rate of engulfing patterns varies depending on factors such as the time frame, market conditions, and the trader's ability to identify and execute trades based on these patterns. While engulfing patterns can provide valuable insights into potential trend reversals, their effectiveness can be influenced by market noise, false signals, and isolated analysis. To improve the win rate of engulfing patterns, traders should combine them with other technical indicators and market analysis techniques, as well as utilize proper risk management strategies.
Glossary for novice traders
-
1
CFD
CFD is a contract between an investor/trader and seller that demonstrates that the trader will need to pay the price difference between the current value of the asset and its value at the time of contract to the seller.
-
2
Long position
A long position in Forex, represents a positive outlook on the future value of a currency pair. When a trader assumes a long position, they are essentially placing a bet that the base currency in the pair will appreciate in value compared to the quote currency.
-
3
Scalping
Scalping in trading is a strategy where traders aim to make quick, small profits by executing numerous short-term trades within seconds or minutes, capitalizing on minor price fluctuations.
-
4
Risk Management
Risk management is a risk management model that involves controlling potential losses while maximizing profits. The main risk management tools are stop loss, take profit, calculation of position volume taking into account leverage and pip value.
-
5
Day trading
Day trading involves buying and selling financial assets within the same trading day, with the goal of profiting from short-term price fluctuations, and positions are typically not held overnight.
Related Articles


Team that worked on the article

Chinmay Soni is a financial analyst with more than 5 years of experience in working with stocks, Forex, derivatives, and other assets. As a founder of a boutique research firm and an active researcher, he covers various industries and fields, providing insights backed by statistical data. He is also an educator in the field of finance and technology.
As an author for Traders Union, he contributes his deep analytical insights on various topics, taking into account various aspects.

Dr. BJ Johnson is a PhD in English Language and an editor with over 15 years of experience. He earned his degree in English Language in the U.S and the UK. In 2020, Dr. Johnson joined the Traders Union team. Since then, he has created over 100 exclusive articles and edited over 300 articles of other authors.

Mirjan Hipolito is a journalist and news editor at Traders Union. She is an expert crypto writer with five years of experience in the financial markets. Her specialties are daily market news, price predictions, and Initial Coin Offerings (ICO).
