How Do Volume Indicators Work In Forex?


Editorial Note: While we adhere to strict Editorial Integrity, this post may contain references to products from our partners. Here's an explanation for How We Make Money. None of the data and information on this webpage constitutes investment advice according to our Disclaimer.
Best volume indicators is as follows:
Tick Volume. Available on МТ4.
Real Volume. Classic volumes that have been used sincethebeginning of the 20th century.
Delta and Bid Ask. An indicator that breaks volumes down intobuys and sells.
Volume Profile. Horizontal volumes.
Depth of Market. Limit order volumes.
Trading volume analysis is an intrinsic part of successful trading and an important part of technical analysis. Understanding how volumes interact with asset prices can be a significant advantage for traders, helping them predict price changes based on the actions of market participants. However, interpretation of volumes is not a simple science.In this article, I will consider 6 volume indicators that I find best for analyzing balances between supply and demand, and making informed predictions about price action. These tools include both traditional analysis methods and new technological solutions that provide deep, multilevel analysis of market activity.
My top 6 best volume indicators for Forex trading
On Balance Volume (OBV), Volume Price Trend (VPT), and Chaikin Money Flow (CMF) are often called some of the best, but I don’t have a lot of experience in using them and therefore will provide my own version of the 6 best indicators:
Tick Volume. Available on МТ4;
Real Volume. Classic volumes that have been used since the beginning of the 20th century;
Delta and Bid Ask. An indicator that breaks volumes down into buys and sells;
Volume Profile. Horizontal volumes;
Depth of Market. Limit order volumes;
Indicators derived from footprint charts.
Each of the indicators is briefly discussed below.
Tick Volume
MetaTrader 4 offers a small set of volume indicators by default. The Tick Volume indicator shows the number of price changes per unit of time, and not trading volume in stocks, contracts, etc. This type of volume is characteristic of the interbank Forex market, which does not have a single center providing trading volume data in real time.
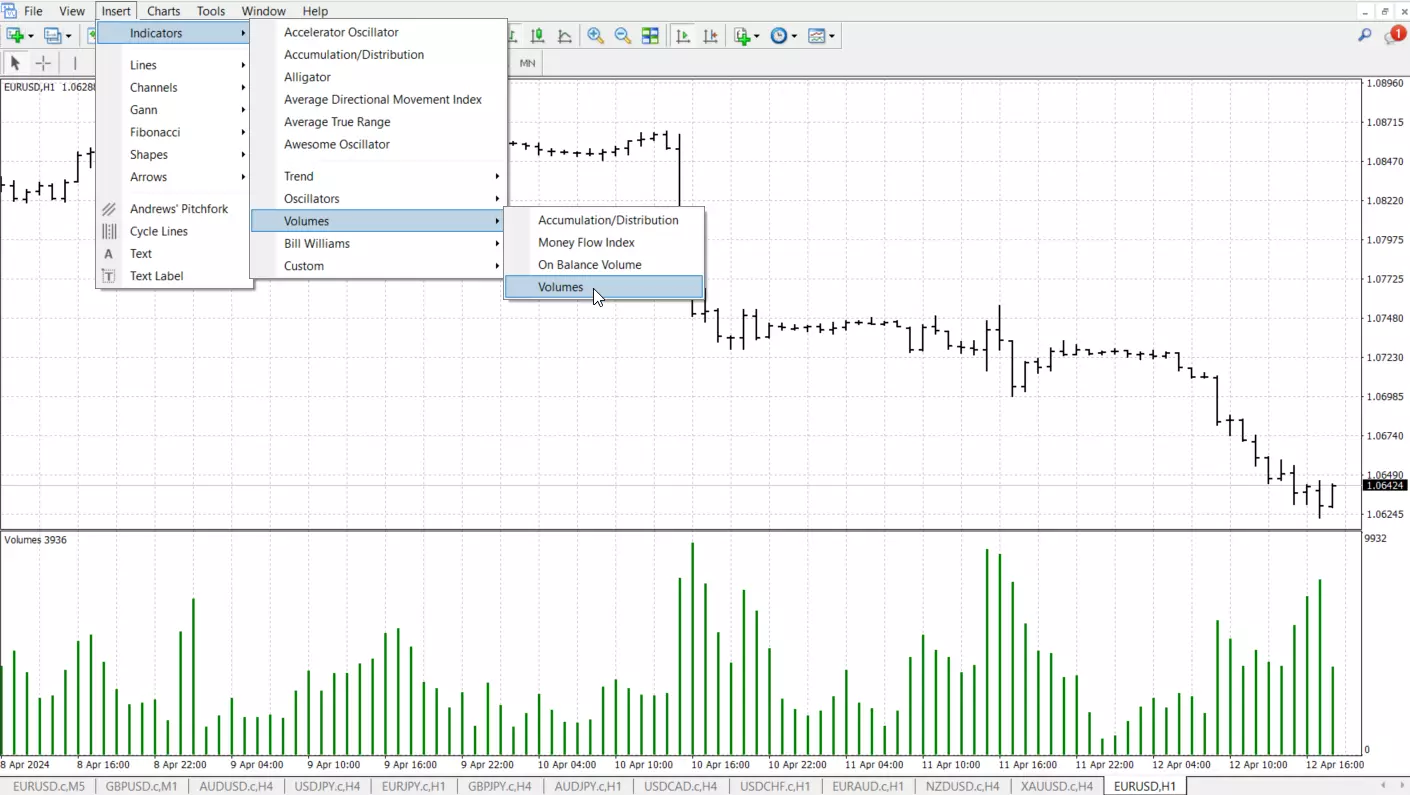
According to Tom Williams – the creator of Volume Spread Analysis – tick volumes can be useful because they reflect trading activity. However, real volumes from exchanges are more informative, as will be shown later.
I put this indicator first on my list because it is widely used due to the popularity of МТ4. Beginners who pay attention to this indicator can become interested in volume analysis as a new metric alongside price and time to better understand the market’s nature.
Real Volume
One easy way to analyze real volumes in Forex is to open a futures chart on TradingView. For example, for EUR/USD, enter the 6E ticker and add the real volume indicator to the chart.
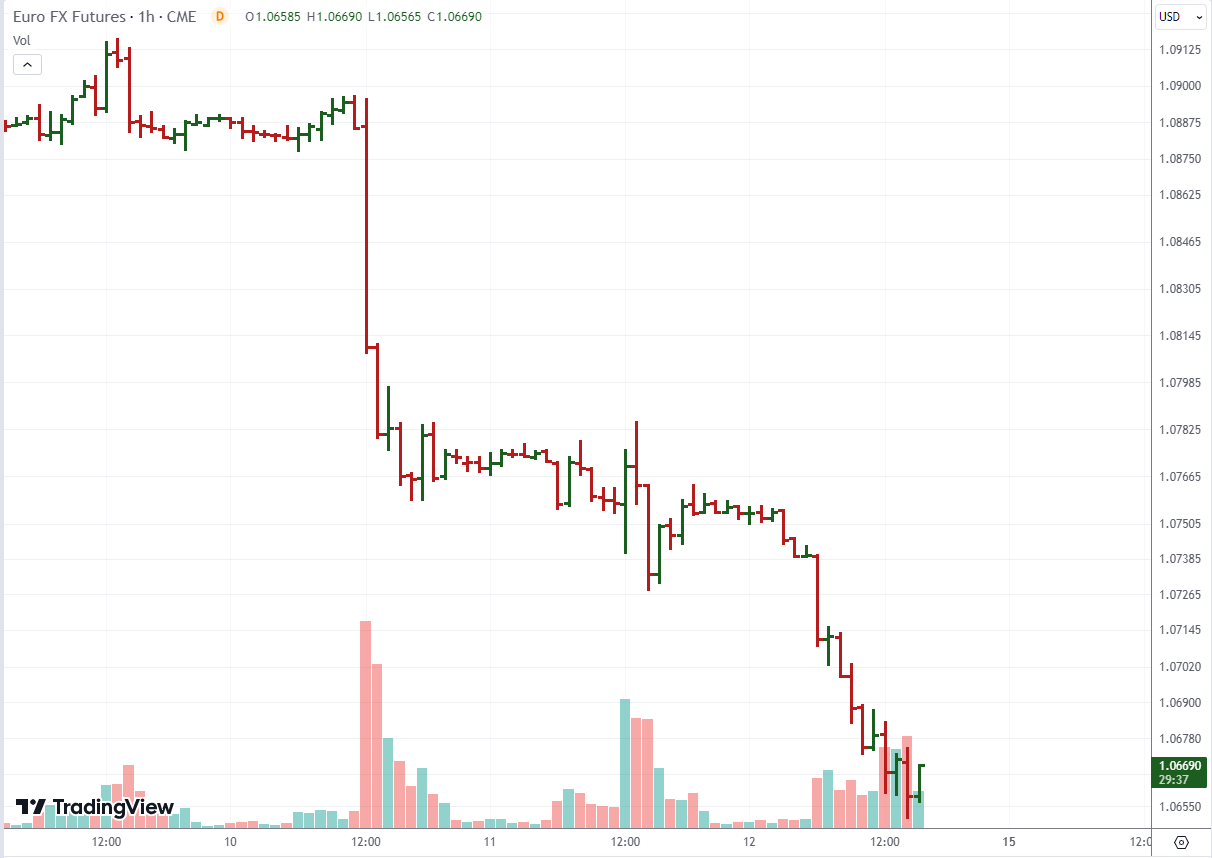
Volume data can be provided with delays and its analysis in real time can involve additional expenses. The same goes for trying to use volume data from the CME futures market on MT4.
To know more about futures, read Futures Contract: What is It and How to Trade it?
Delta and Bid Ask
The Delta indicator shows the difference in volume between trades of two types:
Ask is a trade where a buy market order is paired with a sell limit order. Such trades reflect the aggressiveness of buyers who push the price up.
Bid is a trade where a sell market order is paired with a buy limit order. Predominance of such trades can indicate selling pressure and bearish sentiment.
Below is an example from the ATAS platform designed for volume analysis.
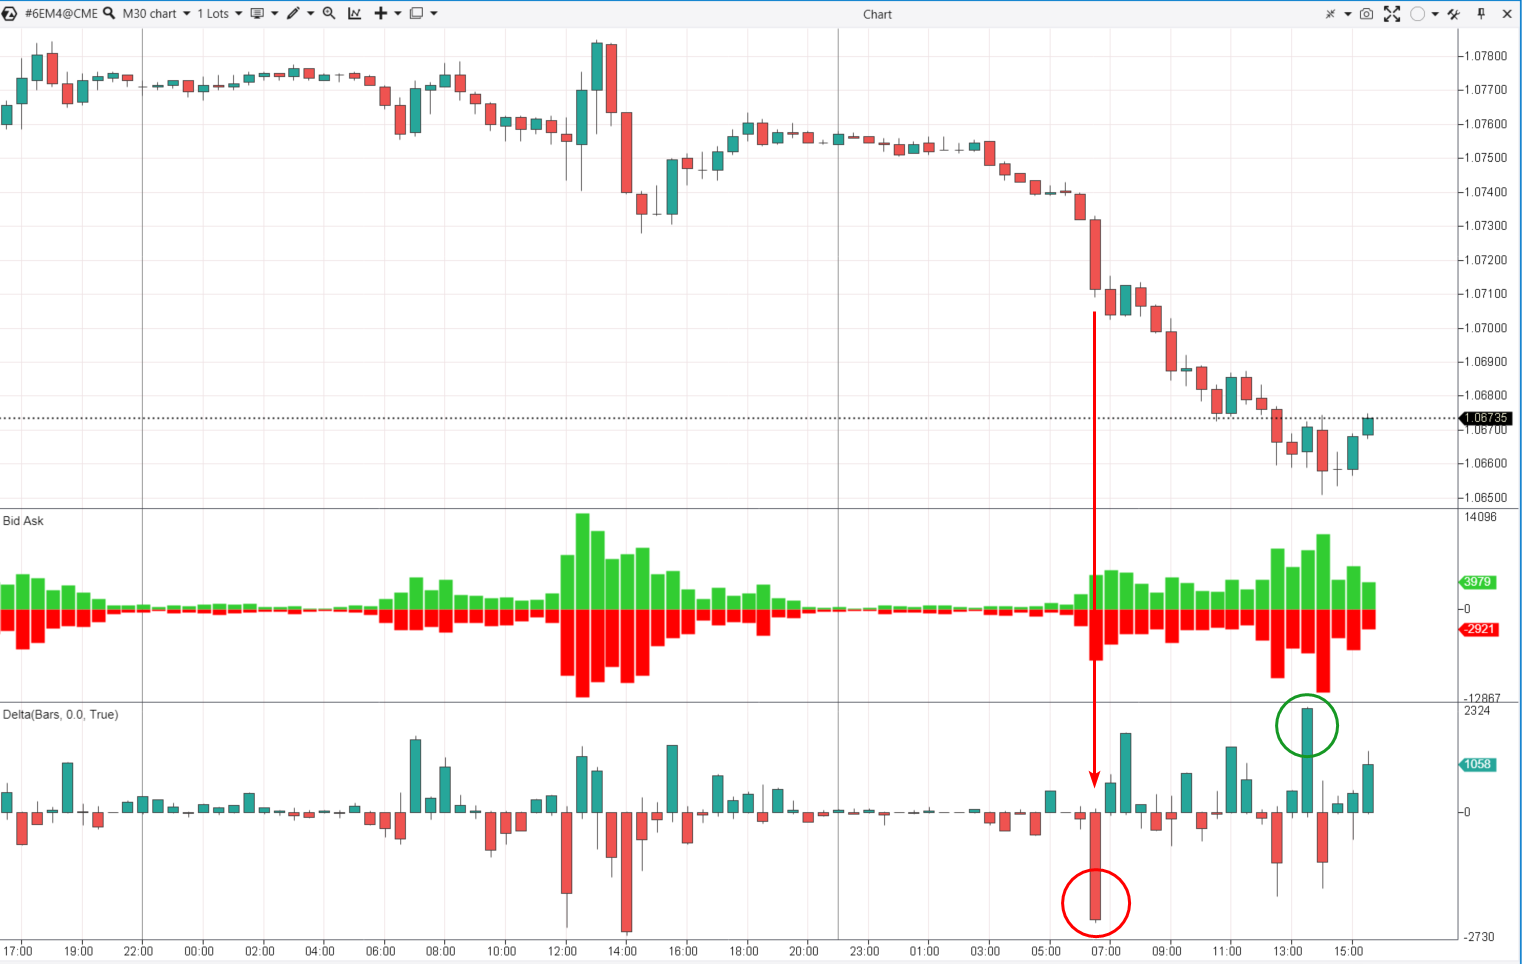
On this chart, the Bid Ask indicator shows market buys in green and market sells in red. The Delta indicator calculates the difference between them.
The superiority of market sells (marked with a red circle) corresponds to an abrupt price drop. And the activation of market buys (marked with a green circle) corresponds to a stop or delay in the downtrend.
Volume Profile
Volume Profile shows trading activity at every price level in a specified time period. This indicator appears on a chart as a horizontal histogram, which is why volume profiles are sometimes called horizontal volumes.
The chart below shows a volume profile for the 6E futures market with a breakdown into market buys (blue) and market sells (red).
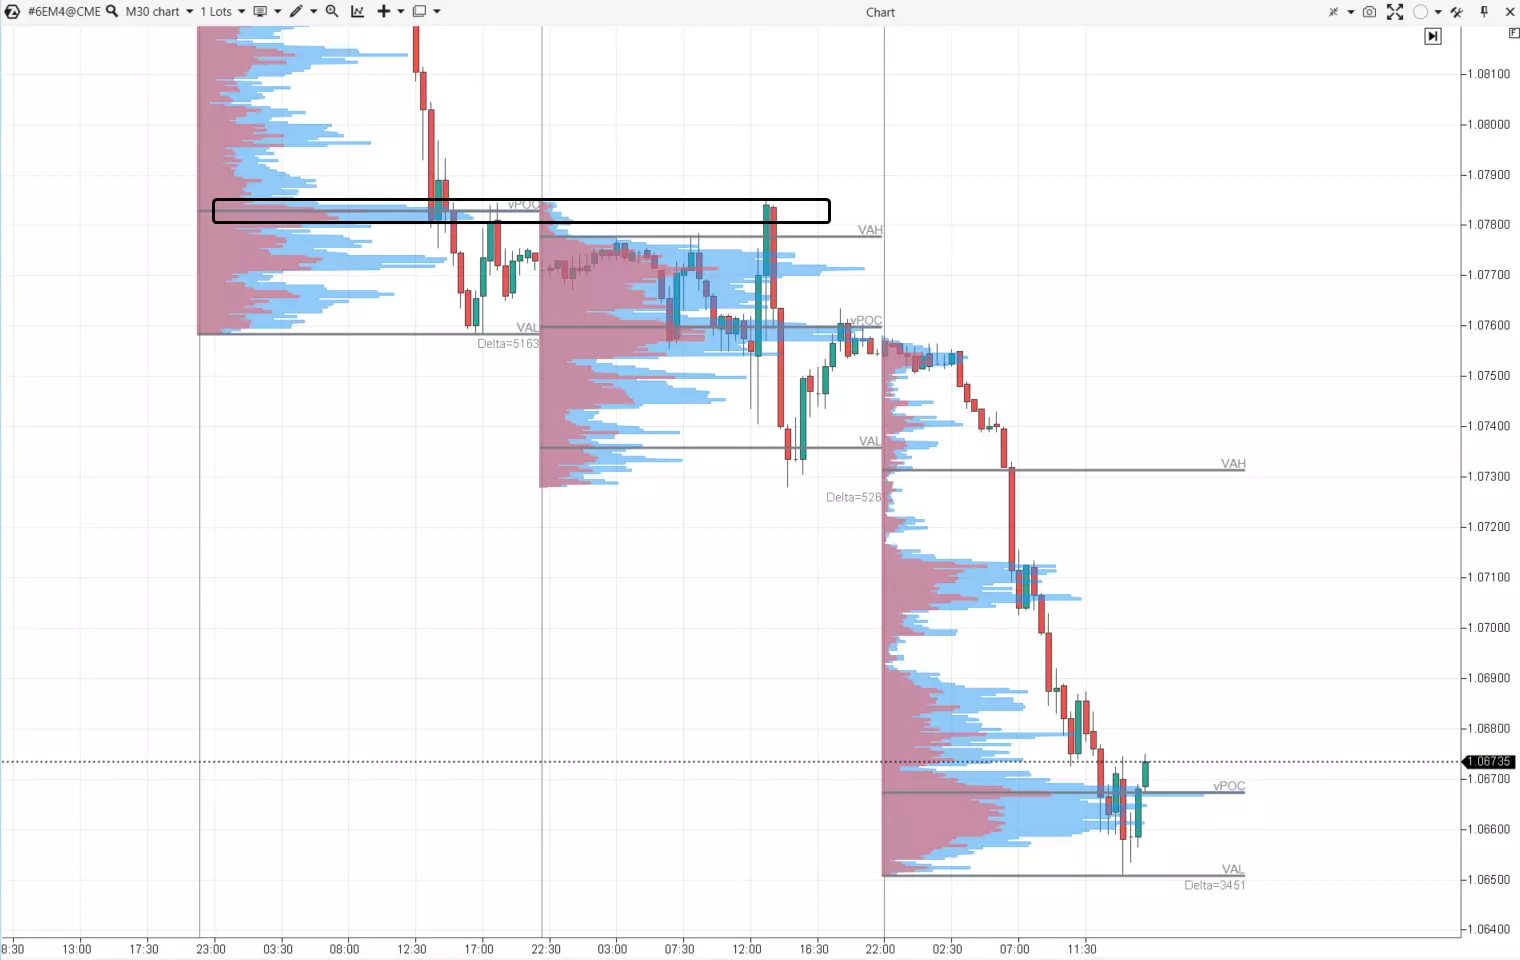
Volume profiles help find important levels of support and resistance.
For example, the black rectangle indicates that the price level a little over 1.0780, at which the most trades were executed the preceding day, became an important resistance level the next day.
Depth of Market
The Depth of Market (DOM) indicator, also called Level II, is special in that it shows limit order volumes. These are not volumes of trades that have already been made, but volumes that show intentions of making trades.
Depth of market analysis often involves additional payment for Level II data provided in real time.
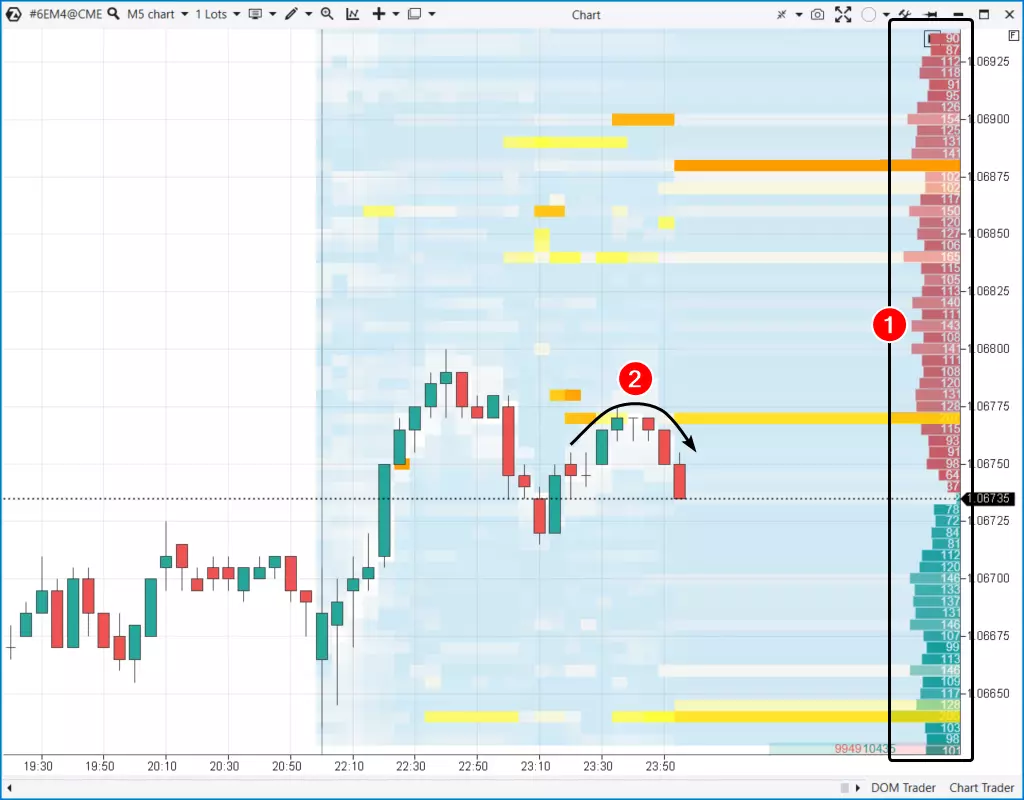
DOM indicator and its levels
DOM also helps find important levels of support and resistance.
The chart above includes:
(1) DOM indicator in the form of a horizontal histogram;
(2) influence of large volumes of limit orders on the price. Brighter colors mark larger volumes on the DOM indicator.
Depth of market analysis is of little use to long-term investors, but enables intraday Forex traders to find better points for entering and exiting positions.
Indicators derived from footprint charts
A footprint is a type of chart that allows you to analyze markets and trading volumes in maximum detail. It became possible with the development of technologies and equipment.
In other words, footprints let you look “inside” candles to see how buyers and sellers struggled.
This can give you a trading advantage, but, on the other hand, the use of footprint charts involves processing huge amounts of data. And indicators for footprint analysis serve to simplify this work.
One of such indicators is Imbalance. It shows:
levels at which sellers prevailed over buyers (red). They usually work as resistance;
levels at which buyers prevailed over sellers (green). They usually work as support.
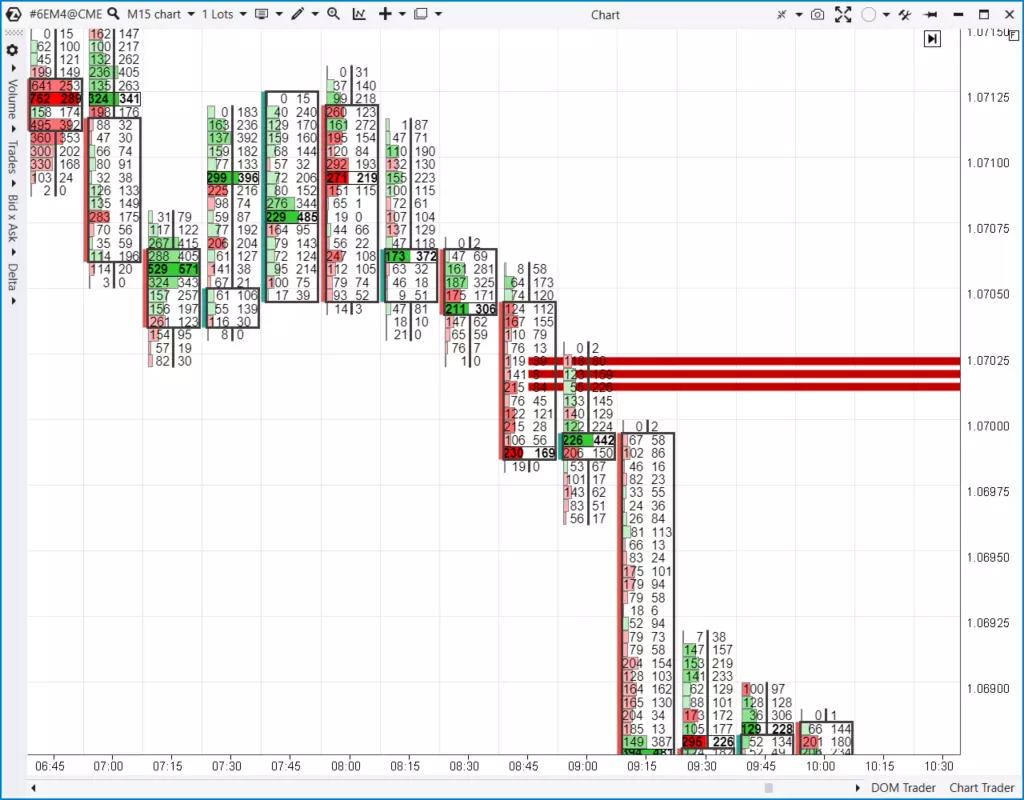
Look at the example above. On the 08:45 candle, the Imbalance indicator shows sellers’ advantage on thebreak of the 1.07025 support level.
How to use volume indicators in Forex
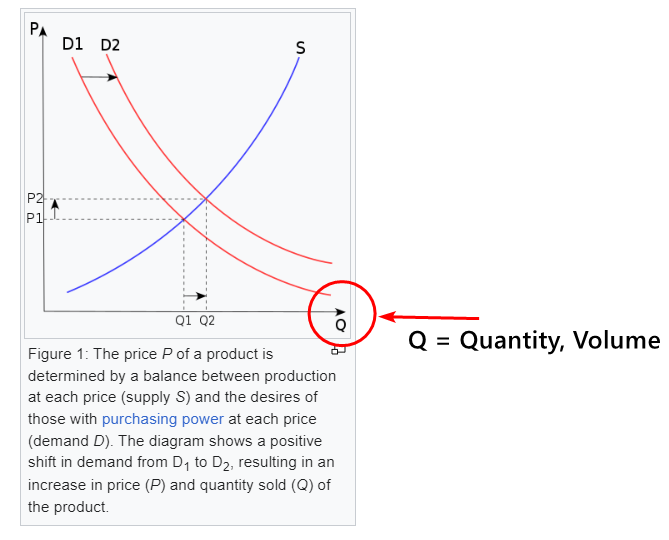
The law of supply and demand is the basic logic that explains why prices change in any market, including Forex, stocks, and cryptocurrencies.
Volume analysis is the key to understanding the changes in supply and demand balance in real time. By assessing trading activity at different price levels, readers of volume indicators can imagine where the equilibrium price should be or, in other words, find the price’s path of least resistance.Thus, volume analysis helps determine the direction in which the market is more likely to move.
Effective volume analysis depends not only on the indicator itself, but also on the trading infrastructure provided by your broker. Fast order execution, support for MT4/MT5, access to advanced charting tools, and stable pricing feeds are especially important when working with volume-based strategies.
Below is a comparison of Forex brokers that offer suitable conditions for traders using volume indicators and intraday analytical tools.
| zForex | Plus500 | Trading.com USA | OANDA | FOREX.com | Venom by Cobra Trading | |
|---|---|---|---|---|---|---|
|
Tradable assets |
80 | 2800 | 69 | 129 | 5500 | No |
|
Demo |
Yes | Yes | Yes | Yes | Yes | Yes |
|
Min. deposit, $ |
10 | 100 | 50 | No | 100 | 5000 |
|
Max. leverage |
1:1000 | 1:300 | 1:50 | 1:200 | 1:50 | 1:4 |
|
Standard EUR/USD spread |
0.3 | 0.7 | 1.1 | 0.3 | 1.0 | 0.4 |
|
MT4 |
No | No | No | Yes | Yes | No |
|
MT5 |
Yes | No | Yes | Yes | Yes | No |
|
Open an account |
Go to broker Your capital is at risk.
|
Go to broker 80% of retail CFD accounts lose money. |
Go to broker Your capital is at risk. |
Go to broker Your capital is at risk. |
Study review | Study review |
Is volume a good indicator?
According to Oleg Pylypenko volume analysis is an important tool in a trader’s arsenal. It can be used in both trending and flat markets. However, like any other analytical tool, volume analysis and its indicators have their pros and cons.
Benefits of using volume indicators
They allow you to independently judge market situations based on actual balances and imbalances of supply and demand.
They enable you to analyze large players’ actions.
They give you trading advantages by finding more accurate levels for trading and risk reduction.
They can be applied to various timeframes, stock markets, and cryptocurrencies.
Downsides of using volume indicators
Interpreting indicators for volume analysis is complicated and requires time for learning. Like any other indicator, volume indicators can sometimes give false or misleading signals resulting in mistaken trading decisions.
Real volumes in the Forex market are unavailable. And the use of real-time volume data, as well as professional software for volume analysis, can involve additional expenses.
Volume confirms market intent, not just price direction

In my experience, traders often focus too much on price patterns and underestimate the importance of trading activity behind the move. A breakout without increasing volume is usually unreliable, while strong volume growth near key levels often signals participation from institutional players. That is why I recommend using volume indicators not as standalone entry signals, but as confirmation tools that help filter out weak setups.
For beginners, tick volume on MT4 is enough to start understanding how market activity changes during trends, consolidations, and news releases. More advanced traders should gradually move toward tools like Volume Profile or Delta analysis, especially for intraday trading, because they provide deeper insight into where liquidity and aggressive orders are concentrated.
Another important point is consistency. There is no need to overload charts with multiple volume-based indicators at once. One well-understood volume tool combined with clear risk management is usually far more effective than a complex setup that creates conflicting signals.
Conclusion
Volume indicators are a critical but often underutilized tool that can significantly enhance Forex trading by revealing the true dynamics of supply and demand. While interpreting volume requires time and skill—especially given the decentralized nature of the Forex market—tools like Tick Volume for beginners or more advanced options such as Volume Profile and Delta analysis offer traders valuable insights into market intent, not just price direction. For instance, a breakout accompanied by strong volume is far more convincing than one on low participation, and recognizing such setups can give traders a real edge. Ultimately, the most powerful takeaway is that integrating even a single well-understood volume indicator with disciplined risk management can lead to smarter decisions and better trading outcomes, as it sharpens your perception of where the real action takes place in the market.
FAQs
What are the common mistakes traders make when using Forex volume indicators?
How do Forex volume indicators differ from those used in stock trading?
Can volume indicators be effectively used on all Forex timeframes?
What should beginners consider when choosing a Forex volume indicator?
Editors' Top Picks and Insights

Hunting crypto owners: Why criminals have gone offline

BitMEX is shutting down: Why Trump could not save the exchange

Do governments need crypto workers?

Brent nears $100: Why oil prices are rising

Gram Wallet launch: Can Telegram bring crypto to the masses?

AI without limits: How dangerous are neural networks?
Related Articles
Team that worked on the article
For over 15 years, Oleg worked as a copywriter and journalist at advertising and marketing agencies, as well as radio and television companies. His writing style is aimed at using simple terms to explain only those things that matter to the reader – benefits, risks, and realizable ideas.
Dr. BJ Johnson is a PhD in English Language and an editor with over 15 years of experience. He earned his degree in English Language in the U.S and the UK.
Mirjan Hipolito is a journalist and news editor at Traders Union. She is an expert crypto writer with five years of experience in the financial markets.
Index in trading is the measure of the performance of a group of stocks, which can include the assets and securities in it.
Risk management is a risk management model that involves controlling potential losses while maximizing profits. The main risk management tools are stop loss, take profit, calculation of position volume taking into account leverage and pip value.
A bear market is a period of time in which an investment asset, such as stocks, bonds, or commodities, experiences a decline in price for an extended period of time.
Forex leverage is a tool enabling traders to control larger positions with a relatively small amount of capital, amplifying potential profits and losses based on the chosen leverage ratio.
A futures contract is a standardized financial agreement between two parties to buy or sell an underlying asset, such as a commodity, currency, or financial instrument, at a predetermined price on a specified future date. Futures contracts are commonly used in financial markets to hedge against price fluctuations, speculate on future price movements, or gain exposure to various assets.

-
 Afghanistan
-
 Albania
-
 Algeria
-
 Angola
-
 Argentina
-
 Armenia
-
 Australia
-
 Austria
-
 Azerbaijan
-
 Bahamas
-
 Bahrain
-
 Bangladesh
-
 Belarus
-
 Belgium
-
 Bolivia
-
 Botswana
-
 Brazil
-
 Brunei
-
 Bulgaria
-
 Cambodia
-
 Cameroon
-
 Canada
-
 Chile
Chile
-
 China
China
-
 Colombia
-
 Congo
Congo
-
 Costa Rica
-
 Cote d'Ivoire
-
 Croatia
-
 Cuba
Cuba
-
 Cyprus
-
 Czechia
-
 DR Congo
-
 Denmark
-
 Dominican Republic
-
 Ecuador
-
 Egypt
Egypt
-
 El Salvador
-
 Estonia
-
 Eswatini
-
 Ethiopia
-
 Finland
-
 France
-
 Georgia
-
 Germany
-
 Ghana
Ghana
-
 Greece
-
 Haiti
Haiti
-
 Hong Kong
-
 Hungary
-
 India
India
-
 Indonesia
-
 Iran, Islamic republic
-
 Iraq
Iraq
-
 Ireland
-
 Israel
-
 Italy
Italy
-
 Jamaica
-
 Japan
Japan
-
 Jordan
-
 Kazakhstan
-
 Kenya
Kenya
-
 Korea
Korea
-
 Kuwait
-
 Kyrgyzstan
-
 Laos
Laos
-
 Latvia
-
 Lebanon
-
 Lesotho
-
 Libya
Libya
-
 Lithuania
-
 Luxembourg
-
 Madagascar
-
 Malaysia
-
 Malta
Malta
-
 Mauritius
-
 Mexico
-
 Moldova
-
 Mongolia
-
 Montenegro
-
 Morocco
-
 Mozambique
-
 Myanmar
-
 Namibia
-
 Nepal
Nepal
-
 Netherlands
-
 New Zealand
-
 Nigeria
-
 North Macedonia
-
 Norway
-
 Oman
Oman
-
 Pakistan
-
 Palestine
-
 Panama
-
 Papua New Guinea
-
 Paraguay
-
 Peru
Peru
-
 Philippines
-
 Poland
-
 Portugal
-
 Puerto Rico
-
 Qatar
Qatar
-
 Reunion
-
 Romania
-
 Rwanda
-
 Saudi Arabia
-
 Serbia
-
 Singapore
-
 Slovakia
-
 Slovenia
-
 Somalia
-
 South Africa
-
 Spain
Spain
-
 Sri Lanka
-
 Sweden
-
 Switzerland
-
 Syria
Syria
-
 Taiwan
-
 Tajikistan
-
 Tanzania
-
 Thailand
-
 Trinidad and Tobago
-
 Tunisia
-
 Turkey
-
 UAE
UAE
-
 Uganda
-
 Ukraine
-
 United Kingdom
-
United States
-
 Uruguay
-
 Uzbekistan
-
 Venezuela
-
 Vietnam
-
 Yemen
Yemen
-
 Zambia
-
 Zimbabwe
- Forex
- Crypto
