Elliott Wave Theory – A Complete Guide


Editorial Note: While we adhere to strict Editorial Integrity, this post may contain references to products from our partners. Here's an explanation for How We Make Money. None of the data and information on this webpage constitutes investment advice according to our Disclaimer.
Elliott Wave Theory helps traders analyze market cycles and predict price movements:
Five-wave impulse structure. Trends move in a five-wave sequence.
Three-wave corrective pattern. Price corrections follow a three-wave move.
Fractal market behavior. Waves repeat across timeframes.
Wave extensions exist. Some waves stretch longer.
Fibonacci relationships matter. Wave lengths follow Fibonacci ratios.
Works best in liquid markets. High-volume assets improve accuracy.
Markets don’t always move in a straight line, but Elliott Wave Theory helps traders make sense of price trends. Developed by Ralph Nelson Elliott in the 1930s, it shows how prices follow repeating patterns driven by crowd behavior and emotions.
This guide breaks down the key ideas, rules, and strategies behind Elliott Wave Theory, including how to draw waves and apply them in trading. Whether you're new to trading or already experienced, learning Elliott Wave Theory can help you spot trends early.
What are Elliott Waves?

Elliott Waves are recurring price patterns in financial markets that reflect collective investor sentiment. They consist of a five-wave impulse pattern, which moves in the direction of the main trend, followed by a three-wave corrective pattern that moves against it.
Most beginners assume Elliott Waves are just five up and three down, but the key is seeing how they repeat at different scales. Markets form patterns inside patterns, and a small wave on an hourly chart might just be part of a much bigger wave on the daily chart. Looking at different timeframes helps traders avoid getting stuck in small moves instead of following the bigger trend.
Another important concept is how waves balance out. If Wave 2 drops fast and deep, Wave 4 usually moves slower and sideways. Many traders misread waves and enter at the wrong time because they don’t expect this shift. But spotting these patterns can help traders wait for better setups and avoid jumping into weak trades.
Elliott Waves also reflect how traders feel about the market. Big momentum usually drives Wave 3 because traders pile in, but by Wave 5, most people have already entered, and smart money is starting to exit. Understanding when sentiment shifts can help traders avoid late entries and getting caught in trends that are about to turn.
Elliott Wave principle explained

Most traders learn the basic five-wave impulse and three-wave correction, but they often miss a key detail — wave personality. Not all waves behave the same way. The third wave is usually the strongest, but if the first wave is unusually long, the third might be shorter. Recognizing these variations helps traders avoid the common mistake of expecting textbook-perfect patterns. Instead of forcing trades based on rigid structures, traders should adapt based on real-time wave behavior.
Another mistake is ignoring wave failures. A fifth wave that doesn’t break past the third wave’s high (or low in a downtrend) is a sign of exhaustion. Many traders mistakenly expect another move in the trend’s direction, but a truncated fifth wave often signals a major reversal. Spotting these failures early can save traders from holding onto losing trades and even help them catch trend reversals before the crowd.
Elliott Wave theory isn’t just about price movement — it’s deeply tied to market sentiment. A strong impulse wave with large candles and high volume signals confidence, while weak waves with choppy movement suggest hesitation. Combining Elliott Wave analysis with volume and momentum indicators can confirm whether a wave is strong or weak. This helps traders avoid false breakouts and gives them a better understanding of market psychology.
Rules of Elliott Wave theory

Rule 1: Wave 2 cannot retrace more than 100% of wave 1
Wave 2 pulls back against Wave 1 but shouldn’t go past its starting point. If it breaks below Wave 1’s start, the pattern is invalid, and traders should reconsider their wave count.
A retracement beyond 100% means the first move was likely not an impulse but part of a different pattern, such as a corrective wave. Spotting this early can help traders avoid misreading market direction.
Many traders use Fibonacci levels to estimate how deep Wave 2 might go. A typical retracement lands between 50% and 61.8% of Wave 1, making these levels useful for identifying potential reversal zones.
Rule 2: Wave 3 cannot be the shortest impulse wave
Wave 3 usually moves with the most force and high trading activity in an impulse sequence. It needs to be longer than at least one of the other two impulse waves — either Wave 1 or Wave 5. If Wave 3 is the shortest, the pattern is likely wrong and needs to be checked again.
This rule keeps the impulse pattern in check, as Wave 3 is usually the longest because traders jump in aggressively. A short Wave 3 might mean the pattern isn’t valid, so you may need to take another look at the wave count.
Rule 3: Wave 4 cannot enter the price territory of wave 1
Wave 4 is a pullback phase but should not drop into Wave 1’s price range. If it does, it breaks the basic impulse wave pattern and hints at a different setup, like a diagonal or correction.
This guideline helps separate trending and corrective moves. Traders pay close attention to this overlap because it often means it’s time to rethink the wave structure and look at other possible patterns.
How to draw Elliott Waves

Drawing Elliott Waves correctly requires more than just marking highs and lows. A structured approach can help traders identify real wave patterns instead of forcing them onto the chart.
Start with a naked chart. Before adding indicators, zoom out and study raw price action. Identify major peaks and troughs to see the broader structure. Too many traders rely on indicators first, which can distract from actual wave formation.
Find the dominant trend first. Waves move within a trend, not in isolation. Use a higher timeframe (like the daily or weekly) to spot the overall direction. If you misread the primary trend, your wave count will likely be wrong from the start.
Look for wave symmetry. Elliott Waves aren’t just random zigzags; they have a rhythm. Waves 1, 3, and 5 should have a proportional look, and corrective waves (2 and 4) should mirror each other in depth and duration. If something looks forced, reconsider your count.
Use volume to confirm waves. True impulse waves often have rising volume, while corrective waves see lower volume. If Wave 3 has weak volume, it might not be a real impulse wave. This extra confirmation prevents false wave counts.
Adjust in real-time, not after the fact.Elliott Wave counting is dynamic. Don’t wait for perfect setups — adjust as new price action unfolds. Many traders make the mistake of only reviewing their waves in hindsight, missing real-time opportunities.
Elliott Wave Oscillator & other indicators
The Elliott Wave Oscillator (EWO) helps traders confirm wave structures, but using it effectively requires more than just looking at green and red bars.
Find wave strength with EWO peaks. Instead of just spotting waves, compare the height of EWO peaks. In impulse waves, Wave 3 should have the strongest peak, while Wave 5 is often weaker. If Wave 5’s peak is stronger than Wave 3, it may signal an extended fifth wave rather than a trend reversal.
Use RSI to confirm wave exhaustion. When EWO shows Wave 3 peaking, check the RSI. If RSI is in the overbought zone (above 70), the market may be preparing for a correction. If Wave 5 forms with RSI divergence (lower RSI while price makes a new high), it’s a strong signal of an upcoming reversal.
MACD crossovers signal early wave shifts. When MACD lines cross after a deep EWO valley, it often marks the start of Wave 1. If the MACD crosses down while EWO prints a weaker Wave 5, it’s an early warning that the uptrend is losing momentum.
Volume spikes confirm valid wave counts. A true Wave 3 should have a noticeable increase in volume. If price moves aggressively but volume stays flat, the wave count might be incorrect. For corrective waves, low volume during Wave B often signals a false breakout.
Fine-tune entries with Fibonacci levels. Once EWO confirms a wave structure, use Fibonacci retracements for precise entries. A Wave 2 retracing to 50-61.8% of Wave 1 is a strong buying zone, while a Wave 4 retracing 38.2% of Wave 3 suggests a continuation setup.
How to trade using Elliott Wave theory
Mastering Elliott Wave Theory isn’t just about spotting waves — it’s about knowing how to trade them effectively.
Start with the bigger picture. Before zooming into a short-term chart, analyze the larger time frame to spot major waves. Many beginners jump into smaller waves too soon and misinterpret corrections. Always start with a weekly or daily chart before moving to shorter time frames.
Use Fibonacci retracements to confirm wave positions. Instead of blindly labeling waves, use Fibonacci levels to validate them. For example, Wave 2 often retraces 50-61.8% of Wave 1, while Wave 4 tends to hold above 38.2%. If the retracement doesn’t align, you may have mislabeled the structure.
Identify weak corrections before a breakout. The strongest trades happen when a correction weakens before a big move. If Wave 4 is taking longer but with smaller price swings, it signals exhaustion. This is where big traders position themselves for Wave 5.
Wait for an impulse wave confirmation. Many traders jump in too early. Let Wave 1 complete, then trade the Wave 2 pullback or catch Wave 3. The best trades often happen after confirmation, not anticipation.
Combine Elliott Waves with momentum indicators.RSI divergence at the end of Wave 5 or MACD crossovers during Wave 3 can add confidence to your trades. Elliott Wave is powerful, but pairing it with technical indicators improves accuracy.
Elliott Wave examples
Bullish Elliott wave example

In a rising market, prices tend to follow a five-wave pattern. This pattern includes three waves pushing higher and two pullbacks in between.
Wave 1 (Initial move up). The first wave begins as early buyers step in, pushing prices higher. This often happens when traders start recognizing a new trend.
Wave 2 (Pullback/correction). Some traders take profits, causing a dip. However, prices don’t fall below the start of Wave 1.
Wave 3 (Strongest upward move). This wave is the strongest because more buyers step in with confidence. More traders get involved, driving prices up quickly.
Wave 4 (Another pullback). A brief pause happens as traders take profits again, but this dip is usually smaller than Wave 2.
Wave 5 (Final upward push). Wave 5 is often driven by hype and the fear of missing out. Prices peak before a larger correction happens.
Trading strategy. A good strategy is to buy after Wave 2 or Wave 4, since they are temporary dips in an uptrend.
Bearish Elliott wave example

In a downtrend, Elliott Waves also move in five waves but downward. A downtrend usually plays out like this:
Wave 1 (Initial drop). Sellers start to take control, kicking off the downtrend.
Wave 2 (Temporary recovery). Buyers try to push prices back up, but the move is weak and fails to make a new high.
Wave 3 (Strongest decline). This is when the selling hits hardest, often causing panic. Fear and bad news make the sell-off worse.
Wave 4 (Short-lived rebound). A small price bump happens as some traders take profits, but it doesn’t last long.
Wave 5 (Final drop). The final leg down brings prices to new lows. This wave often ends in an oversold market, setting up for a bigger bounce.
Trading strategy. Many traders wait for Wave 2 or 4 to short before the next drop.
Common challenges & limitations of Elliott Wave theory
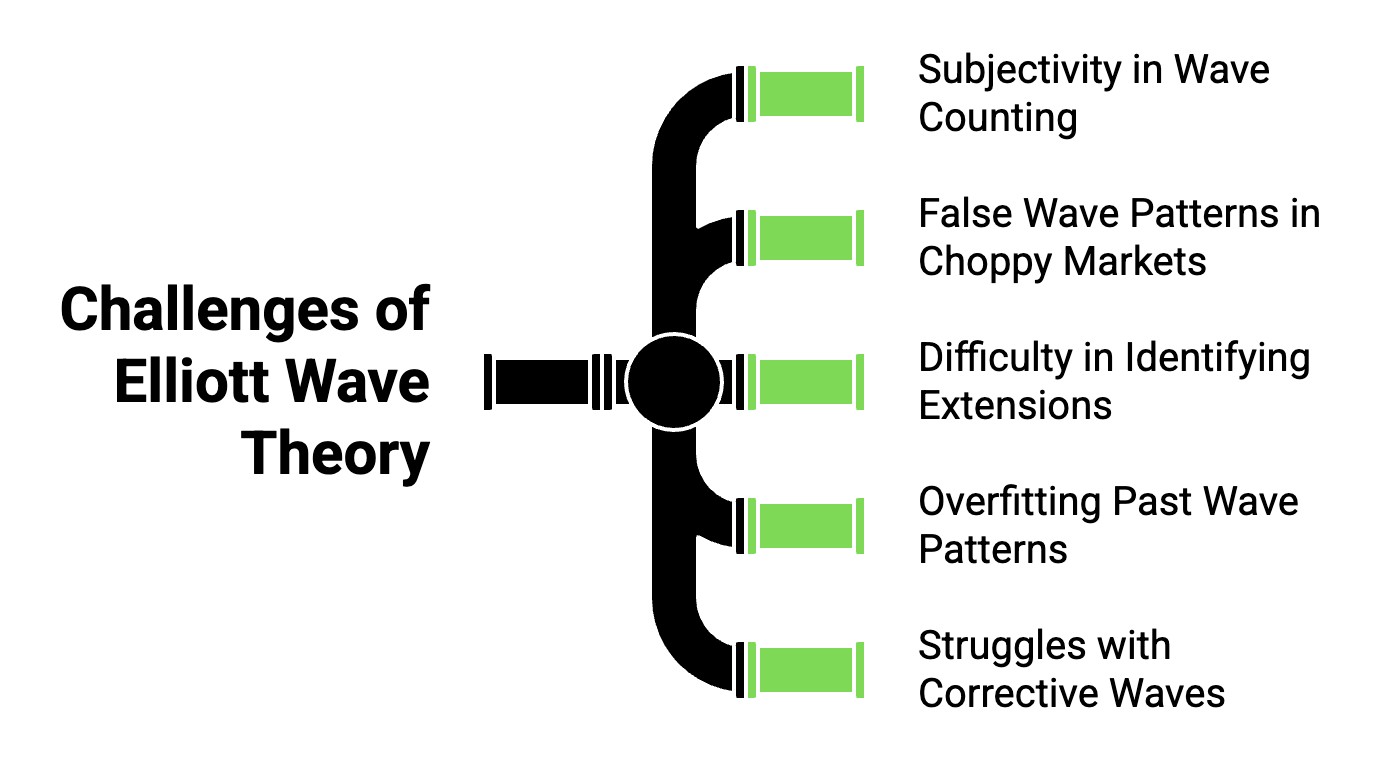
Elliott Wave Theory is a powerful tool, but it comes with its own set of challenges that can make it difficult for traders to apply consistently. Here are five key limitations that beginners often struggle with and how to work around them.
Subjectivity in wave counting. Even experienced traders often disagree on wave counts because there’s no absolute way to label them. Market conditions, emotions, and different interpretations can lead to conflicting analyses. To improve accuracy, compare multiple timeframes and combine Elliott Wave with other indicators like Fibonacci retracements.
False wave patterns in choppy markets. Sideways or erratic price movements can trick traders into seeing waves where none exist. This often leads to forced trades based on misidentified structures. When markets are unclear, step back and wait for a confirmed trend before applying wave counts.
Difficulty in identifying extensions. Some impulse waves stretch much longer than expected, throwing off traders who assume symmetry. This can lead to premature exits or missed opportunities. Instead of assuming all waves will be the same length, track previous market cycles to spot where extensions are most likely to occur.
Overfitting past wave patterns. Traders often try to force past Elliott Wave structures onto current price action, assuming history will repeat exactly. Markets evolve, and while patterns rhyme, they don’t always repeat perfectly. Stay flexible and prioritize real-time confirmation over textbook patterns.
Struggles with corrective waves. Corrective waves are more complex than impulse waves, with many variations that confuse traders. Many get stuck trying to fit a perfect ABC pattern. Instead, focus on recognizing the overall corrective structure rather than forcing a specific count.
Tips for beginners learning Elliott Waves
Elliott Wave Theory can be overwhelming for beginners, but following a structured approach can make learning easier and more effective.
Start with just impulse waves. Don’t try to learn everything at once. First, focus only on five-wave impulse moves. Print historical charts and mark impulsive trends without worrying about corrections. Once you can spot these easily, move on to corrective waves.
Use a single asset at first. Elliott Waves behave differently across markets. Pick one asset (like EUR/USD or BTC/USD) and study its wave behavior over different timeframes. This helps you notice unique price patterns instead of getting confused by different assets reacting differently.
Don’t over-rely on Fibonacci levels. Many beginners assume every wave perfectly aligns with Fibonacci ratios. In reality, waves often deviate slightly. Instead of forcing trades based on exact ratios, use Fibonacci as a guideline, not a rule. Focus on overall wave structure first.
Learn to spot wave failures. Not every five-wave move completes as expected. Sometimes, the market reverses early, forming a truncated wave. If you see a fifth wave struggling to push past the third wave’s high, prepare for a possible reversal instead of assuming the trend will continue.
Keep a trading journal of waves. Instead of relying on memory, document wave counts and patterns you identify daily. Write down what worked, what failed, and how waves played out over time. Reviewing your past analysis will sharpen your ability to spot real-time wave structures accurately.
Is Elliott Wave theory worth using?
Elliott Wave Theory is worth using for traders who can apply it correctly, as it offers a structured approach to analyzing market trends and predicting price movements. While it requires experience and interpretation, it can be a powerful tool when combined with other technical analysis methods.
Many professional traders use Elliott Wave analysis alongside Fibonacci retracements, RSI, and MACD to enhance accuracy. Since wave counting can be subjective, these additional indicators help confirm patterns and reduce the chances of misinterpretation.
However, the Elliott Wave Theory is not a foolproof system. Market noise, unexpected events, and differing wave counts can lead to inconsistent results. Traders who invest time in studying historical charts and refining their wave identification skills are more likely to benefit from its application.
If, at the end, you decide to use the Elliott Wave Theory, consider trading through these brokers that will help you with a demo account to test the strategy along with high quality technical tools:
| zForex | Plus500 | OANDA | Trading.com USA | FOREX.com | |
|---|---|---|---|---|---|
|
Tradable assets |
80 | 2800 | 129 | 69 | 5500 |
|
Min. deposit, $ |
10 | 100 | No | 50 | 100 |
|
Copy trading |
Yes | No | Yes | No | Yes |
|
Standard EUR/USD spread, avg pips |
0.3 | 0.7 | 0.3 | 1.1 | 1.0 |
|
ECN Spread EUR/USD, avg pips |
0.1 | No | 0.15 | No | 0.2 |
|
Deposit fee, % |
No | No | No | No | No |
|
Withdrawal fee, % |
No | No | No | No | No |
|
Open an account |
Go to broker Your capital is at risk.
|
Go to broker 80% of retail CFD accounts lose money. |
Go to broker Your capital is at risk. |
Go to broker Your capital is at risk. |
Study review |
Smart traders prepare for wave 4 while everyone else chases wave 3

Most beginners focus too much on wave counting, but the real trick is reading market psychology behind the moves. Here’s a counterintuitive truth: Wave 3 exhaustion is where most retail traders get caught, but pros are already planning their next move. Everyone’s taught that Wave 3 is the biggest move, so they try to ride it halfway through. But seasoned traders? They’re watching for signs of slowing momentum — especially on higher timeframes. If price keeps pushing up, but volume is fading, that’s a huge red flag. It means smart money is getting out while retail traders are piling in. That’s when you start preparing for Wave 4 instead of chasing late-stage hype.
Another big secret? Wave alternation isn’t just a pattern rule — it’s a glimpse into how big players manipulate the market. You might’ve heard that if Wave 2 is simple, Wave 4 will be complex. But why does that even happen? It’s not random. Institutions use Wave 2 to quietly buy in, while Wave 4 is where they flush out weak hands before sending price higher. If you can spot where liquidity is getting wiped out, you can catch Wave 5 before the breakout. Instead of just watching Fibonacci levels, look for order flow imbalances and liquidity gaps. The market isn’t a perfect pattern — it’s a battlefield of buyers and sellers, and Elliott Wave is just the map.
Conclusion
Elliott Wave Theory stands as a powerful framework for understanding and anticipating market trends, offering traders a structured approach to analyzing price movements. By mastering its key principles—such as the five-wave impulse and three-wave corrective patterns—traders gain a valuable edge in timing entries and exits. Practical strategies rooted in wave analysis can help identify high-probability setups, as seen when traders spot the end of a corrective wave and position for the next impulsive move. While no method guarantees success, consistently applying Elliott Wave Theory equips traders to navigate market cycles with greater confidence. Ultimately, those who embrace its nuances can turn market patterns into meaningful opportunities.
FAQs
How does market sentiment influence Elliott Wave patterns?
Why is analyzing multiple timeframes important in Elliott Wave Theory?
What are the key rules traders should follow to ensure valid Elliott Wave counts?
How can technical indicators improve Elliott Wave analysis?
Editors' Top Picks and Insights

U.S. Bitcoin reserve: Trump’s unrealized crypto promise

Aiming for leadership: Payment giants prepare a new stablecoin

Proof of Reserves: the new standard for cryptocurrency exchanges

Three trends that could reshape the crypto market over the next decade

Trump financial disclosure: How the president's crypto income became a U.S. ethics issue

Code red: What's behind Bitcoin’s sharp selloff?
Related Articles
Team that worked on the article
Alamin Morshed is a contributor at Traders Union. He specializes in writing articles for businesses that want to improve their Google search rankings to compete with their competition.
Dan Blystone began his trading career in 1998 as an arbitrage clerk on the floor of the Chicago Mercantile Exchange (CME). He later traded bond and Eurex futures at proprietary firms such as Altea Trading, gaining valuable experience in high-frequency trading and risk management.
Chinmay Soni is a financial analyst with more than 5 years of experience in working with stocks, Forex, derivatives, and other assets. As a founder of a boutique research firm and an active researcher, he covers various industries and fields, providing insights backed by statistical data.
Risk management is a risk management model that involves controlling potential losses while maximizing profits. The main risk management tools are stop loss, take profit, calculation of position volume taking into account leverage and pip value.
Forex indicators are tools used by traders to analyze market data, often based on technical and/or fundamental factors, to make informed trading decisions.
Take-Profit order is a type of trading order that instructs a broker to close a position once the market reaches a specified profit level.
Xetra is a German Stock Exchange trading system that the Frankfurt Stock Exchange operates. Deutsche Börse is the parent company of the Frankfurt Stock Exchange.
Copy trading is an investing tactic where traders replicate the trading strategies of more experienced traders, automatically mirroring their trades in their own accounts to potentially achieve similar results.

-
 Afghanistan
-
 Albania
-
 Algeria
-
 Angola
-
 Argentina
-
 Armenia
-
 Australia
-
 Austria
-
 Azerbaijan
-
 Bahamas
-
 Bahrain
-
 Bangladesh
-
 Belarus
-
 Belgium
-
 Bolivia
-
 Botswana
-
 Brazil
-
 Brunei
-
 Bulgaria
-
 Cambodia
-
 Cameroon
-
 Canada
-
 Chile
Chile
-
 China
China
-
 Colombia
-
 Congo
Congo
-
 Costa Rica
-
 Cote d'Ivoire
-
 Croatia
-
 Cuba
Cuba
-
 Cyprus
-
 Czechia
-
 DR Congo
-
 Denmark
-
 Dominican Republic
-
 Ecuador
-
 Egypt
Egypt
-
 El Salvador
-
 Estonia
-
 Eswatini
-
 Ethiopia
-
 Finland
-
 France
-
 Georgia
-
 Germany
-
 Ghana
Ghana
-
 Greece
-
 Haiti
Haiti
-
 Hong Kong
-
 Hungary
-
 India
India
-
 Indonesia
-
 Iran, Islamic republic
-
 Iraq
Iraq
-
 Ireland
-
 Israel
-
 Italy
Italy
-
 Jamaica
-
 Japan
Japan
-
 Jordan
-
 Kazakhstan
-
 Kenya
Kenya
-
 Korea
Korea
-
 Kuwait
-
 Kyrgyzstan
-
 Laos
Laos
-
 Latvia
-
 Lebanon
-
 Lesotho
-
 Libya
Libya
-
 Lithuania
-
 Luxembourg
-
 Madagascar
-
 Malaysia
-
 Malta
Malta
-
 Mauritius
-
 Mexico
-
 Moldova
-
 Mongolia
-
 Montenegro
-
 Morocco
-
 Mozambique
-
 Myanmar
-
 Namibia
-
 Nepal
Nepal
-
 Netherlands
-
 New Zealand
-
 Nigeria
-
 North Macedonia
-
 Norway
-
 Oman
Oman
-
 Pakistan
-
 Palestine
-
 Panama
-
 Papua New Guinea
-
 Paraguay
-
 Peru
Peru
-
 Philippines
-
 Poland
-
 Portugal
-
 Puerto Rico
-
 Qatar
Qatar
-
 Reunion
-
 Romania
-
 Rwanda
-
 Saudi Arabia
-
 Serbia
-
 Singapore
-
 Slovakia
-
 Slovenia
-
 Somalia
-
 South Africa
-
 Spain
Spain
-
 Sri Lanka
-
 Sweden
-
 Switzerland
-
 Syria
Syria
-
 Taiwan
-
 Tajikistan
-
 Tanzania
-
 Thailand
-
 Trinidad and Tobago
-
 Tunisia
-
 Turkey
-
 UAE
UAE
-
 Uganda
-
 Ukraine
-
 United Kingdom
-
United States
-
 Uruguay
-
 Uzbekistan
-
 Venezuela
-
 Vietnam
-
 Yemen
Yemen
-
 Zambia
-
 Zimbabwe
- Forex
- Crypto
- What are Elliott Waves?
- Elliott Wave principle
- Rules of Elliott Wave theory
- How to draw Elliott Waves
- Elliott Wave Oscillator & indicators
- How to trade using Elliott Wave
- Elliott Wave examples
- Common challenges & limitations
- Tips for beginners
- Is Elliott Wave theory worth using?
- Expert opinion
- Conclusion
- FAQs
