Creating an Excel Trading Journal – Step-by-Step Guide


Editorial Note: While we adhere to strict Editorial Integrity, this post may contain references to products from our partners. Here's an explanation for How We Make Money. None of the data and information on this webpage constitutes investment advice according to our Disclaimer.
To create a free trading journal in excel, follow these steps:
A trading journal serves as a valuable tool for traders. It helps them organize and analyze their trading activities, and allows them to record and track crucial data such as stock purchases, sales, trade dates, entry and exit points, quantities, and prices. This data can then be used to generate insightful visualizations, monitor trading performance, and identify patterns over time. In addition, Excel's calculation capabilities can aid in deter mining profits, losses, and overall portfolio performance almost instantaneously while also facilitating the creation of graphs and charts that can help traders visualize trends and make informed decisions. In this article, the experts at TU have discussed the step-by-step process using which anyone can create their own free trading journal.
Download free trading journal template
Importance of maintaining a trading journal
A trading journal serves as a comprehensive record of trading decisions, strategies, and outcomes. Documenting the rationale behind each trade provides traders with insights into thought processes, helps them learn from both achievements and errors, and enables them to adapt their strategies accordingly. The journal nurtures self-discipline via consistent analysis and reflection, identifying behavioral patterns, emotional triggers, and biases influencing decisions. Looking back at your journal regularly keeps the learning process going, which helps in improving your decision-making skills and trading performance.
Creating a trading journal in 5 easy steps
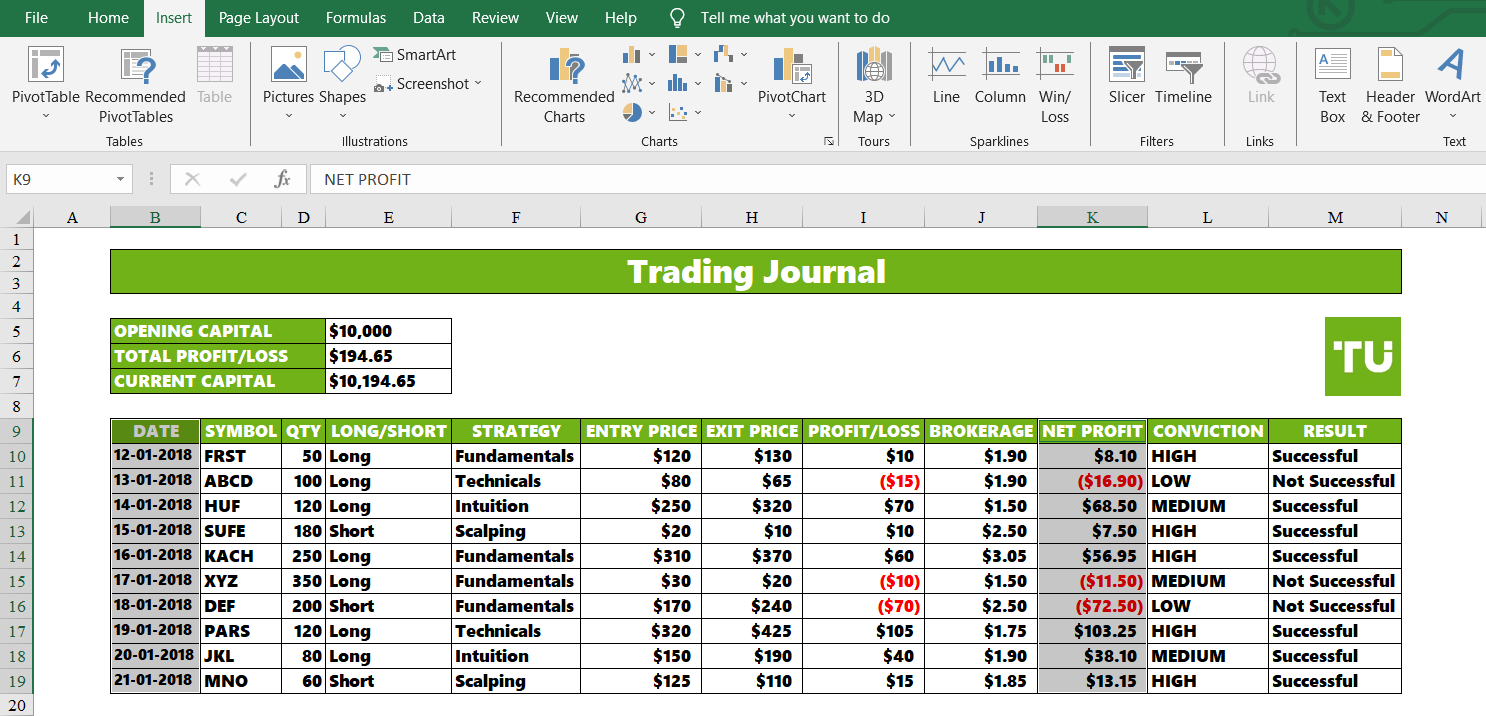
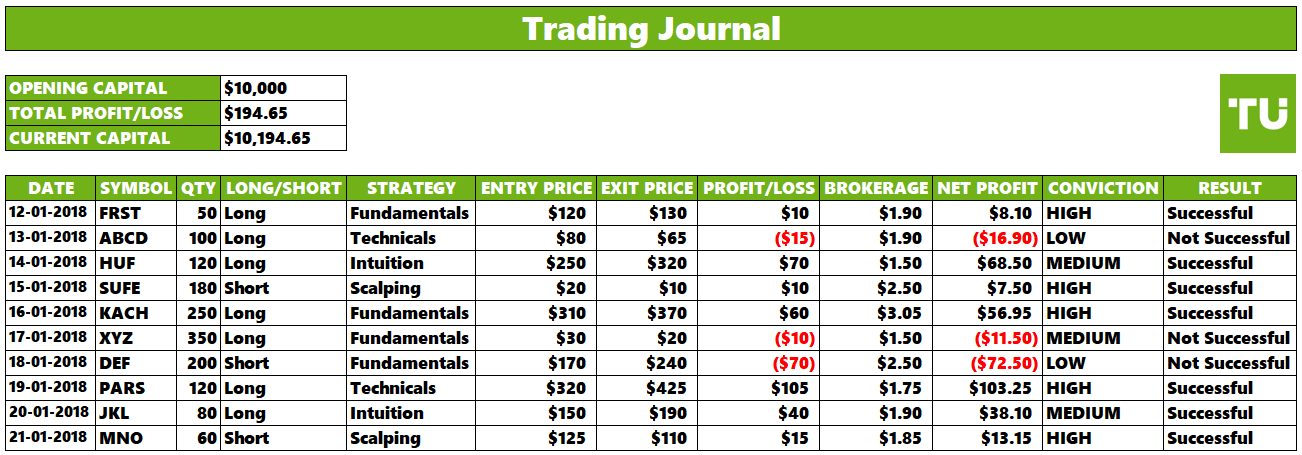 Excel trading journal – Final result
Creating an excel trading journal is easy, if done with the help of a step-by-step guide. You can follow these steps to get started.
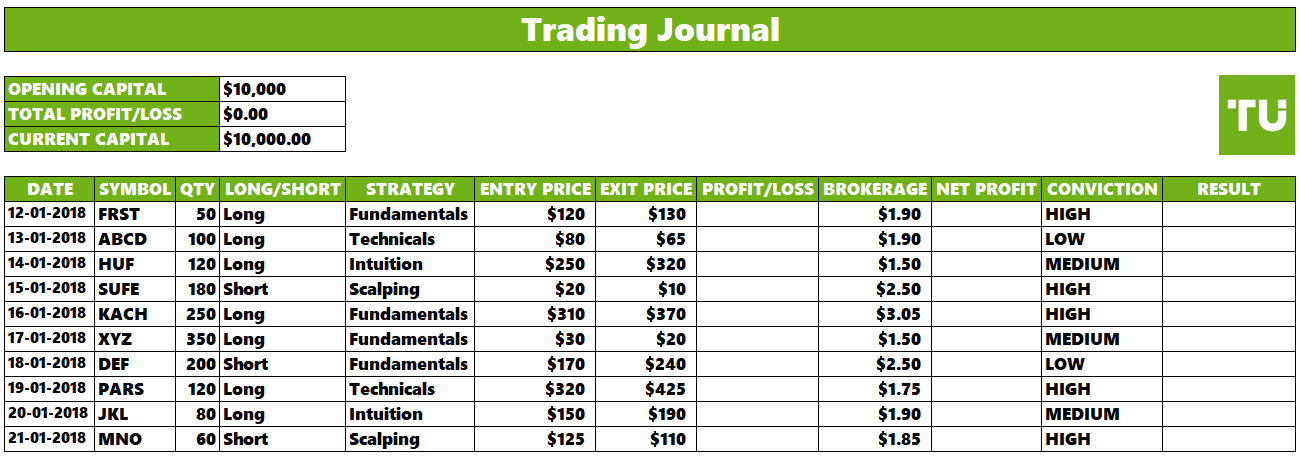
Step 1 – Set up your spreadsheet
Step 1 – Setting up a spreadsheetSetting up your trading journal in a spreadsheet provides a structured format for recording and analyzing your trades. Each column captures specific data points that contribute to understanding your trading performance. Key input parameters include trade date, quantity, strategy used, entry price, exit price, brokerage paid, and the level conviction for that trade.
Additionally, you may also create total profit/loss and current capital tabs using the following formula inputs
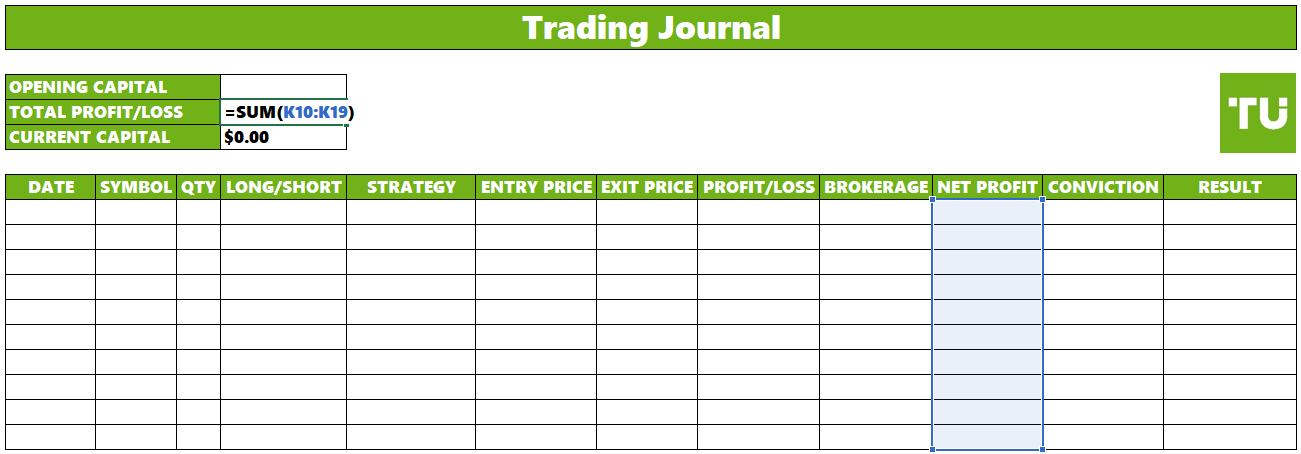
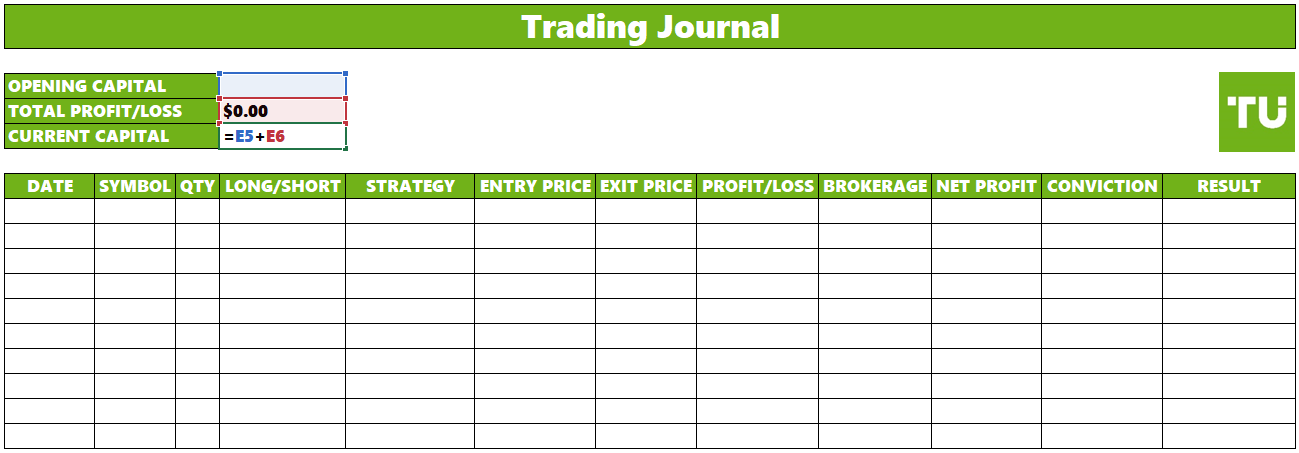 Formula input for current capital tab
Step 2 – Enter your trading data
 Step 2 – Entering your trading data
Enter the details of each trade in the respective columns. These details include the date of the trade, the trading symbol (stock or asset), quantity of units traded, whether it's a long or short position, the strategy used for the trade, the entry price, and the exit price. You may add additional parameters relevant to your specific strategy.
Step 3 – Calculate profit/loss
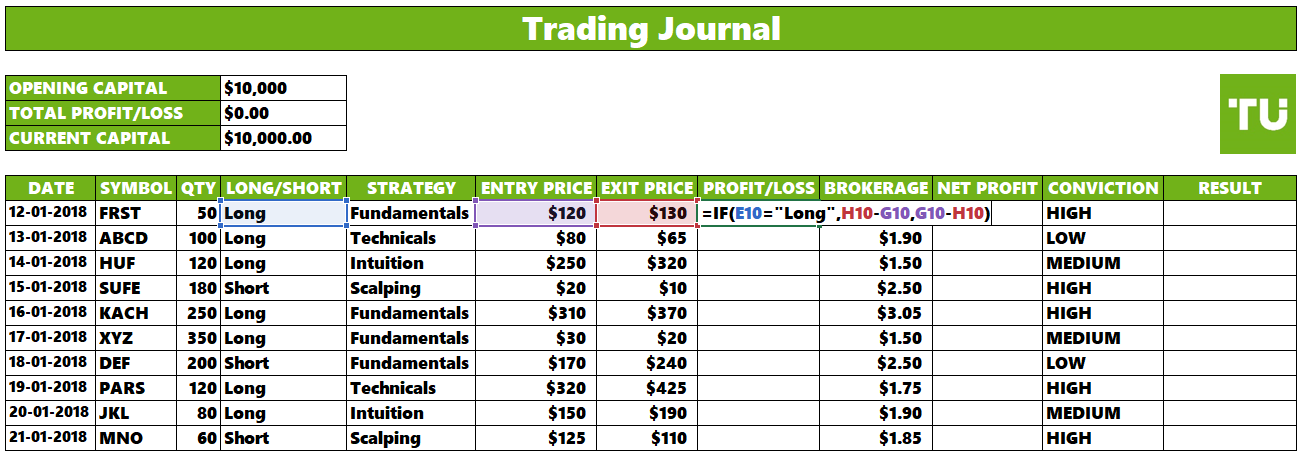
Use conditional formulas to calculate the profit or loss for each trade based on whether it was a long or short position. This enables you to see the financial outcome of each trade, which is crucial for evaluating the effectiveness of your trading strategies. Input the formula =IF(D11="Long", G11-F11, F11-G11) in the first cell of the profit/loss column and drag it downwards to fill it for the entire table.
Let's consider two scenarios:
If the trade was a "Long" position
The formula checks whether the value in cell D11 (which indicates "Long" or "Short") is equal to "Long". If the condition is met (meaning the trade was a long position), the formula calculates the profit by subtracting the entry price (F11) from the exit price (G11). This is because in a long trade, you aim to buy low and sell high to make a profit.If the trade was a "Short" position
If the condition in cell D11 is not met (meaning the trade was not a long position, so it must be a short position), the formula calculates the profit by subtracting the exit price (G11) from the entry price (F11). In a short trade, you aim to sell high and buy back low to make a profit.
The formula thus accommodates both scenarios, providing the appropriate calculation based on the trade type.
Step 4 – Calculate net profit
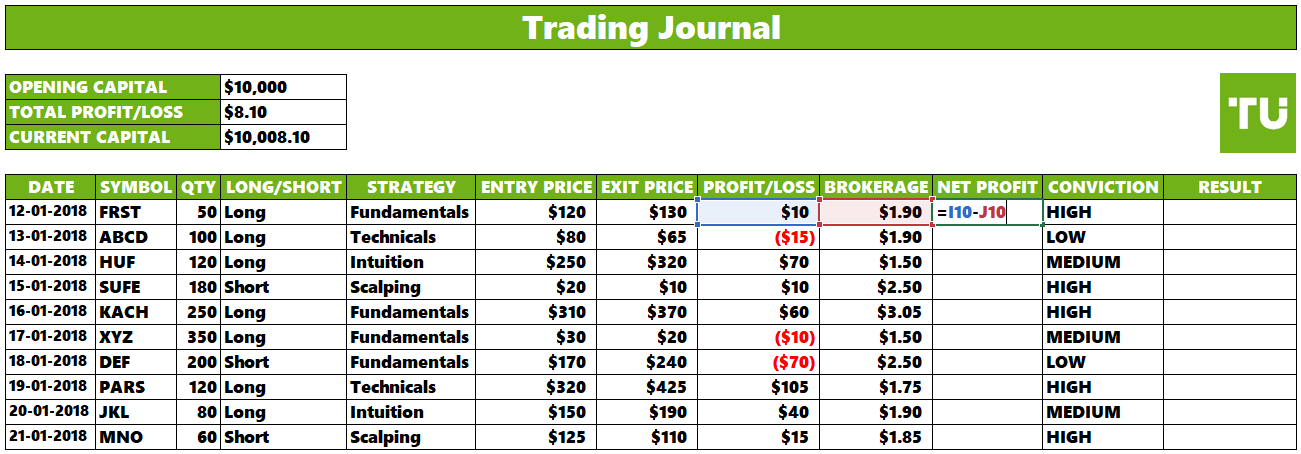
Calculate the net profit for each trade by subtracting the brokerage fees from the calculated profit/loss. For the provided excel template, using the formula “= H11 – I11” and filling it downwards provides you with a clear picture of the net profit earned from each trade after accounting for brokerage fees. This information enables you to understand and manage your trading costs effectively, and also to accurately assess the financial impact of your trading activities.
Step 5 – Determine Strategy and Trade Result
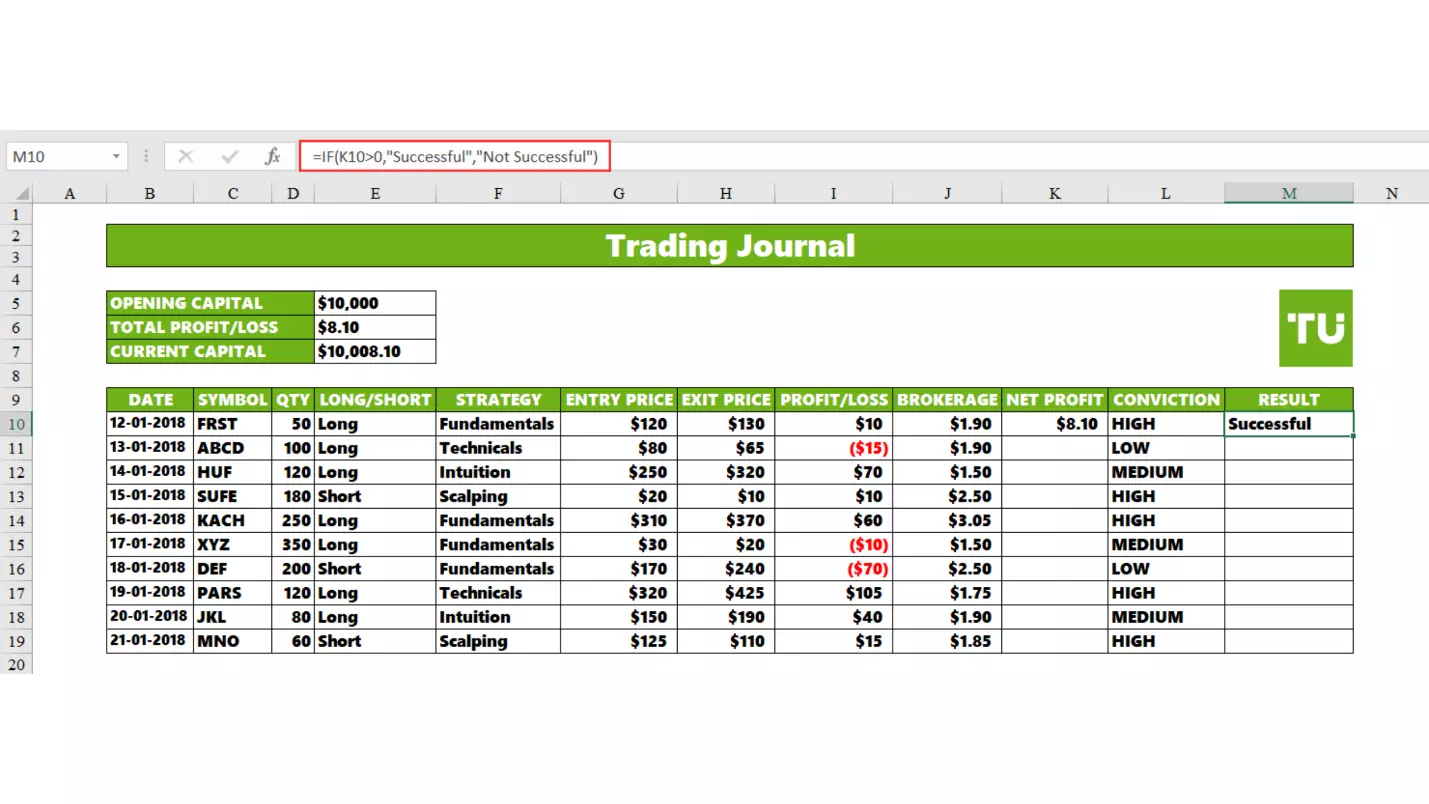 Step 5 – Determining strategy and trade result
Determine the result for the trade and analyze it based on strategy you used to initiate the trade whether it was fundamental, technical, scalping or intuitive. The definition of success is subjective for each trader. In the provided template, if the trade resulted in a positive net profit, it is said to be successful. This can be asserted in the form of formula as “IF(K10>0,”Successful”,”Not Successful”) . Fill the formula in the designated cell and fill it downwards.
With this, you have successfully created an excel trading journal within 5 steps. The final result will look something like this:
Excel trading journal – Final resultFinding the right metrics
When first starting a trading journal, it's natural to feel unsure about which key metrics and parameters to monitor. A helpful approach is to open a demo or cent/micro account and conduct some sample trades. This hands-on experience will allow you to determine what's most important to track once you have trades to analyze.
Specifically, you can export your trading history from platforms like MT4 and MT5 directly into an Excel file. This automatic process will generate many of the key data columns needed for proper evaluation of trades, identification of strengths and weaknesses, and refinement of your strategy. Experts recommend leveraging one of these platforms through a broker below, as their backtesting and demo trading functionality - followed by effortless spreadsheet export - proves tremendously beneficial for beginners still deciding how best to structure their trading journal.
| MT4 | MT5 | Demo | Cent | Micro | Open account | |
|---|---|---|---|---|---|---|
| Yes | Yes | Yes | No | Yes | Go to broker Your capital is at risk. |
|
| Yes | Yes | Yes | No | Yes | Study review | |
| Yes | Yes | Yes | No | No | Study review |
How to analyse trading journal results?
Now that your trading journal is populated with data, you can begin analyzing your trading performance. Here's how the data can be useful:
Identify patterns
By sorting and filtering the data, you can identify patterns in your successful and unsuccessful trades. For instance, you might notice that trades based on certain strategies tend to be more profitable than others.
Track progress
You can see how your trading performance evolves over time. This insight helps you gauge whether you are improving as a trader or if there are persistent issues you need to address.
Spot mistakes
Reviewing unsuccessful trades can help you pinpoint mistakes in your decision-making process. This knowledge can lead to better-informed future trades.
Refine strategies
If you notice that certain strategies consistently result in losses, you can adjust or refine those strategies. Similarly, you can reinforce strategies that have consistently yielded positive results.
What are the best brokers with extra tools?
If you actively trade, you might be interested in regulated brokers with additional features such as support for trading directly from TradingView, bot builders, and other useful functionalities for traders.
| Min. deposit, $ | TradingView | EAs | Free VPS | EA builder | Open account | |
|---|---|---|---|---|---|---|
| 100 | Yes | No | No | No | Go to broker 80% of retail CFD accounts lose money. |
|
| 50 | Yes | Yes | No | No | Go to broker Your capital is at risk. |
|
| No | Yes | Yes | Yes | Yes | Go to broker Your capital is at risk. |
How to filter trades based on strategy in trading journal?
To filter trades based on strategy, follow these simple steps:
Step 1 – Apply excel filter
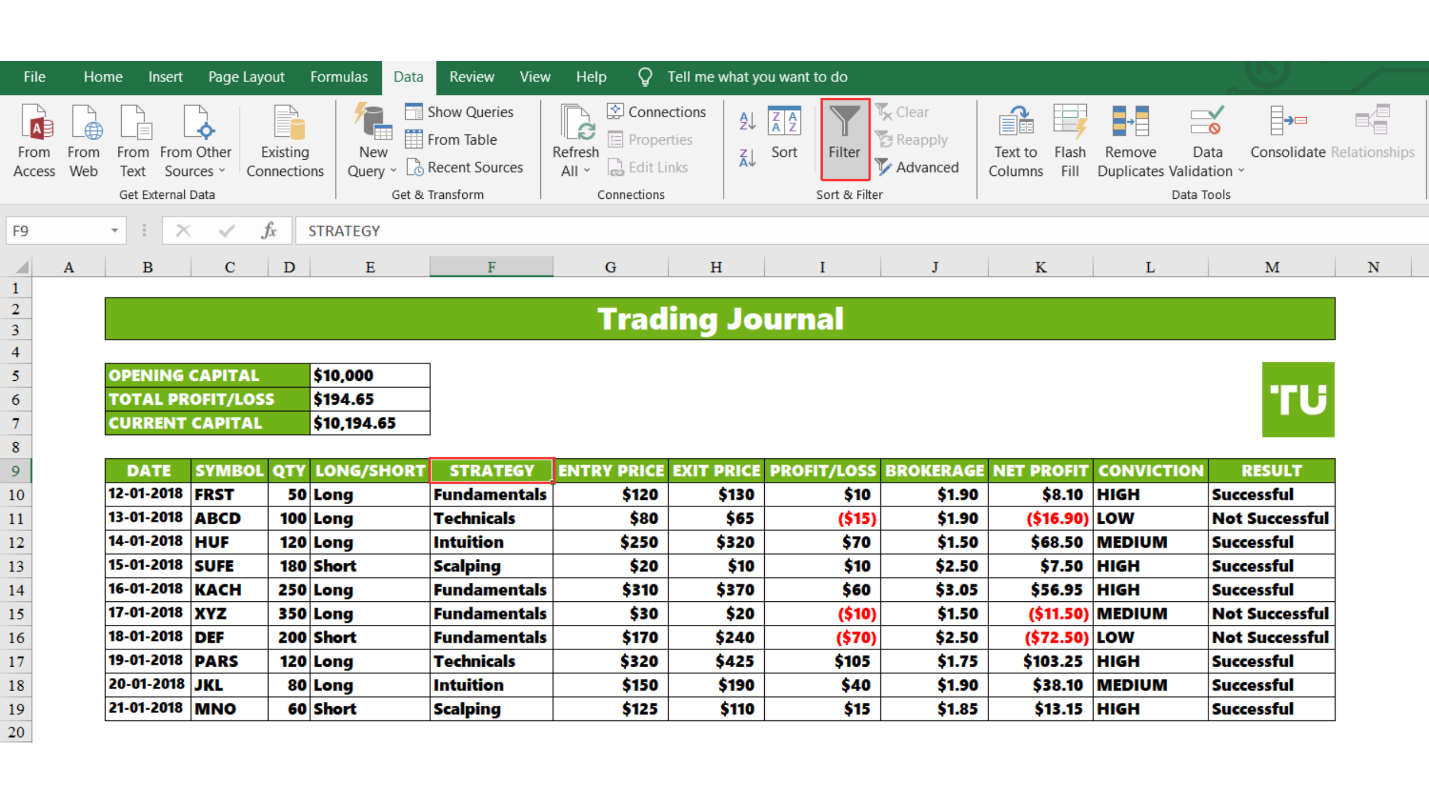 Applying excel filter
Select the “Strategy” header cell. Then, click on “Data” followed by “Filter”. This will apply a filter to the strategy tab.
Step 2 – Select the strategy to be filtered
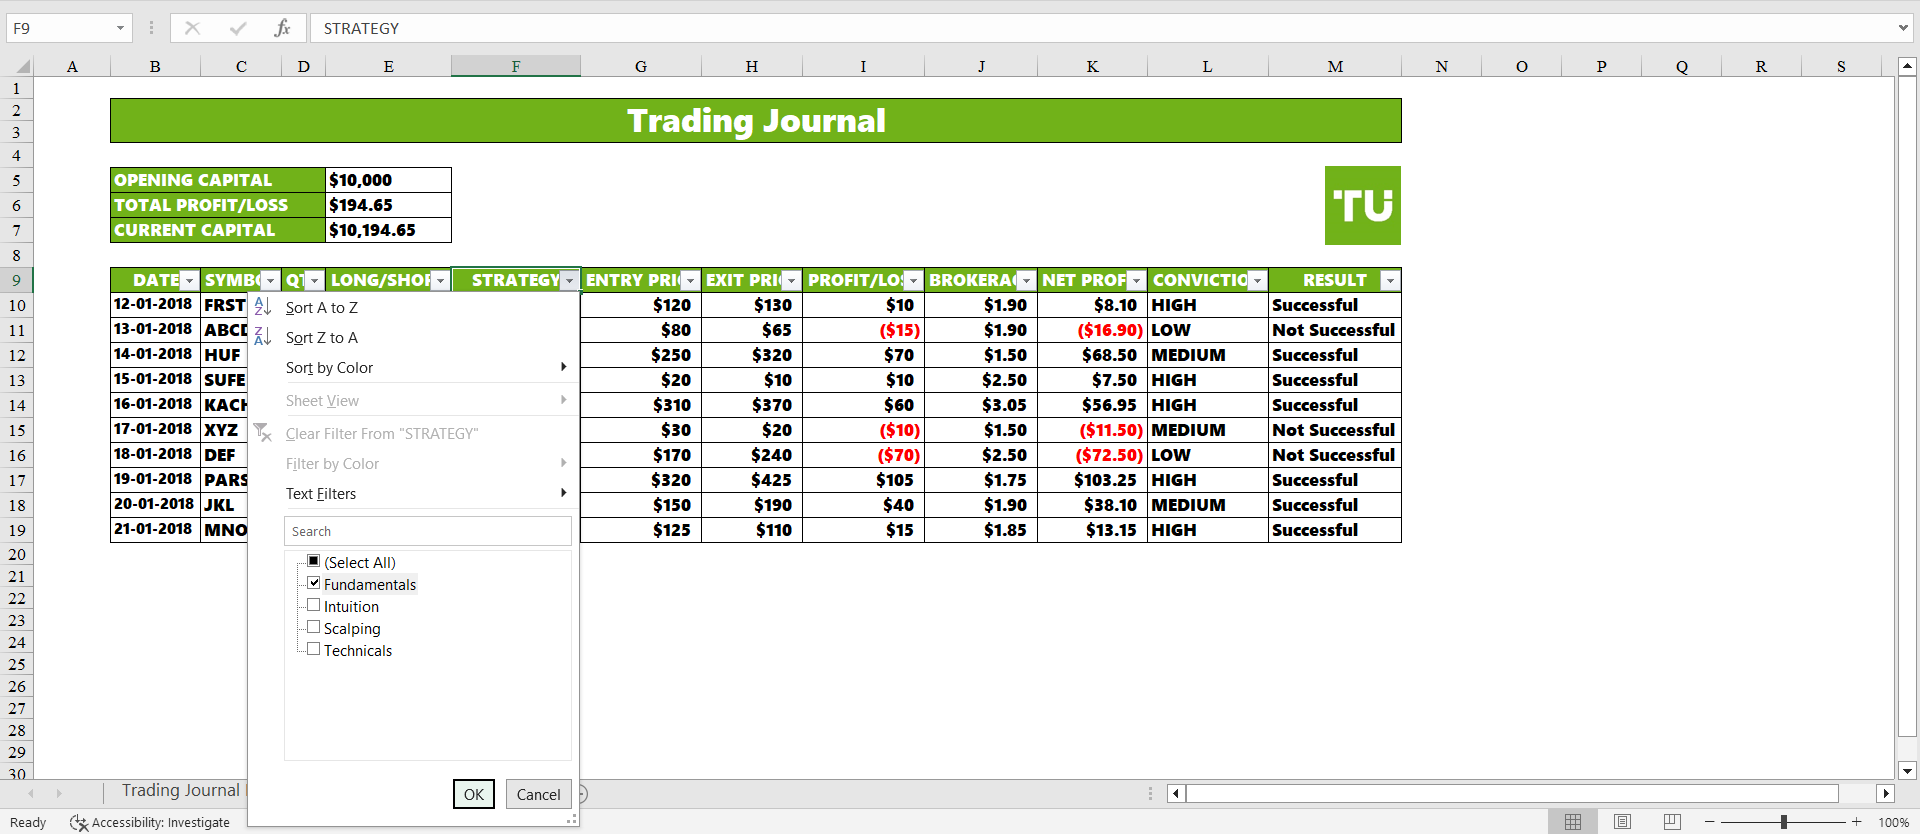 Applying excel filter
After you apply the filter, click on the arrow in the “Strategy” cell to open the filter dropdown menu. Then, deselect all strategies and select the specific strategy you want to filter.
Step 3 – Analyse the specific strategy results
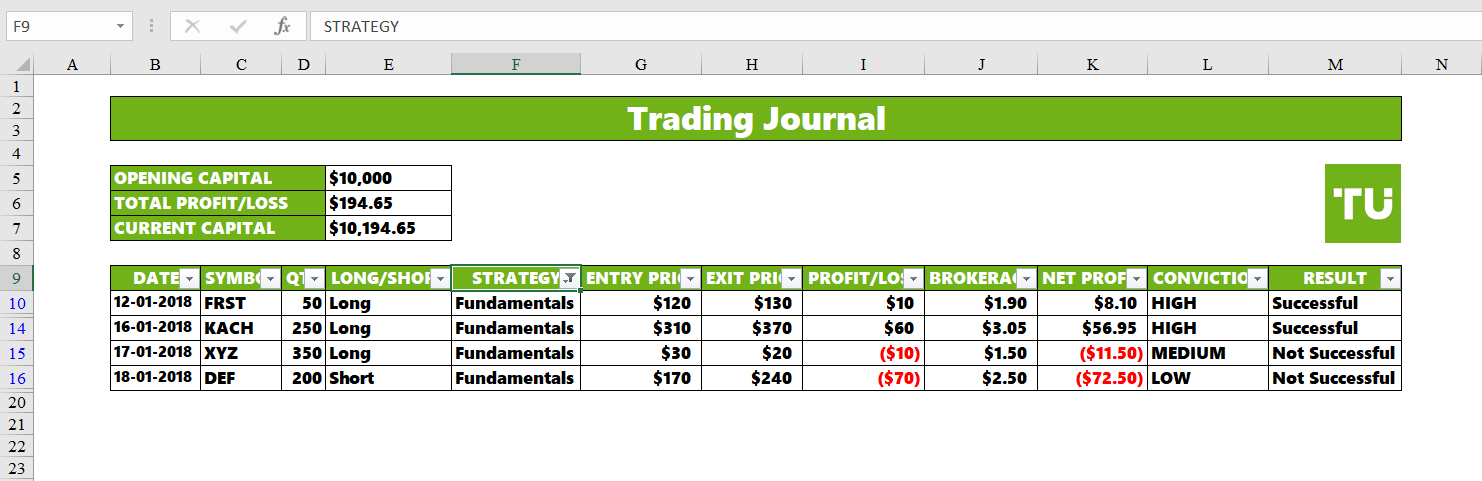 Applying excel filter
Done, you can now analyse any of your strategies in isolation. Note that calculating the total profit/loss from a specific strategy requires one additional step of applying the SUM formula to the specific “Net Profit” cells of the strategy.
Recording trading strategy for each trade – Why is it important?
It's important to record which trading strategy was used for each trade for several reasons, including:
Performance evaluation
By noting the strategy used for each trade, you can later assess which strategies are most successful for you. Excel allows you to create summary statistics and charts, making it easy to compare the performance of different strategies over time.
Strategy-specific metrics
You can track strategy-specific metrics like win rate, average profit, and average loss. Excel's calculation capabilities allow you to automatically compute these metrics, providing insights into the effectiveness of each strategy.
Adaptation and optimization
As you accumulate data in your Excel trading journal, you can identify trends in the performance of specific strategies. This information can guide you in adapting and optimizing your trading approach. For instance, if you notice that a particular strategy consistently yields losses, you may decide to replace it.
Risk management
Excel can help you calculate risk-adjusted returns for each strategy by factoring in metrics like the Sharpe ratio or drawdown analysis. This can assist in understanding the risk associated with each strategy and whether it justifies the potential returns.
Decision-making
When entering new trades, having a record of past trades and their associated strategies in your Excel journal can help inform your decision-making process. You can review which strategies have been most successful in current market conditions.
In summary, recording the strategy used for each trade in your trading journal helps you systematically evaluate and improve your trading performance. It enables data-driven decision-making, strategy optimization, and better risk management, ultimately contributing to your success as a trader.
Creating graphs in trading journal
Creating graphs or charts in Excel based on your trading journal data can provide visual insights into your trading performance. Here are the steps you can follow to insert graphs based on your trading data.
Step 1 - Select data
 Creating graphs
Open your Excel spreadsheet containing the trading journal data. Highlight the columns you want to use for your graph. In your case, you might want to choose "DATE" and "NET PROFIT" or any other combination of columns that suits your analysis.
Step 2 – Insert a chart
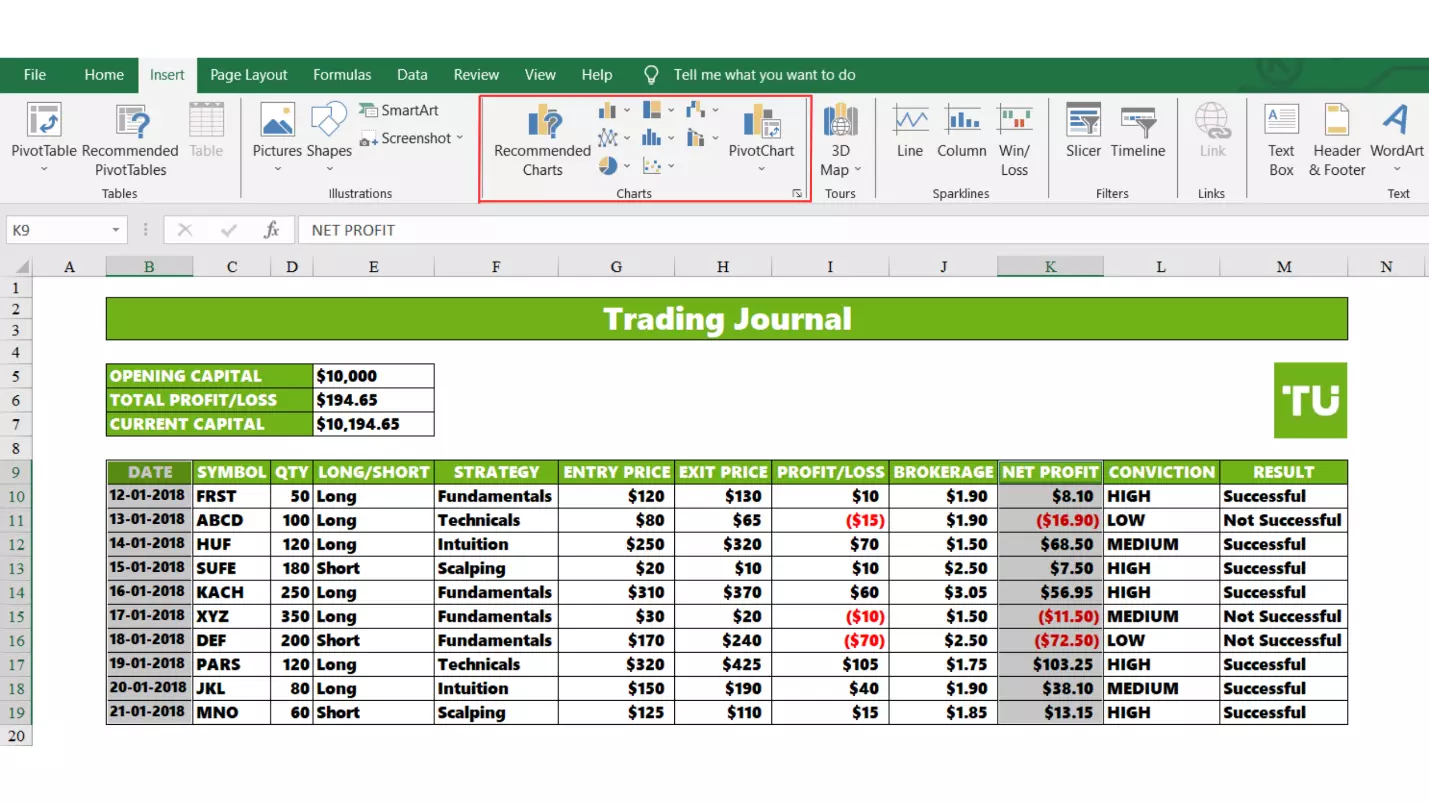 Creating graphs
With your data selected, go to the "Insert" tab in Excel. In the Charts group, choose the type of chart that suits your analysis. For financial data like trading profits, a line chart or a bar chart can be useful. You might also consider creating a combination chart with multiple series if you want to display more than one type of data.
Step 3 – Customize the chart
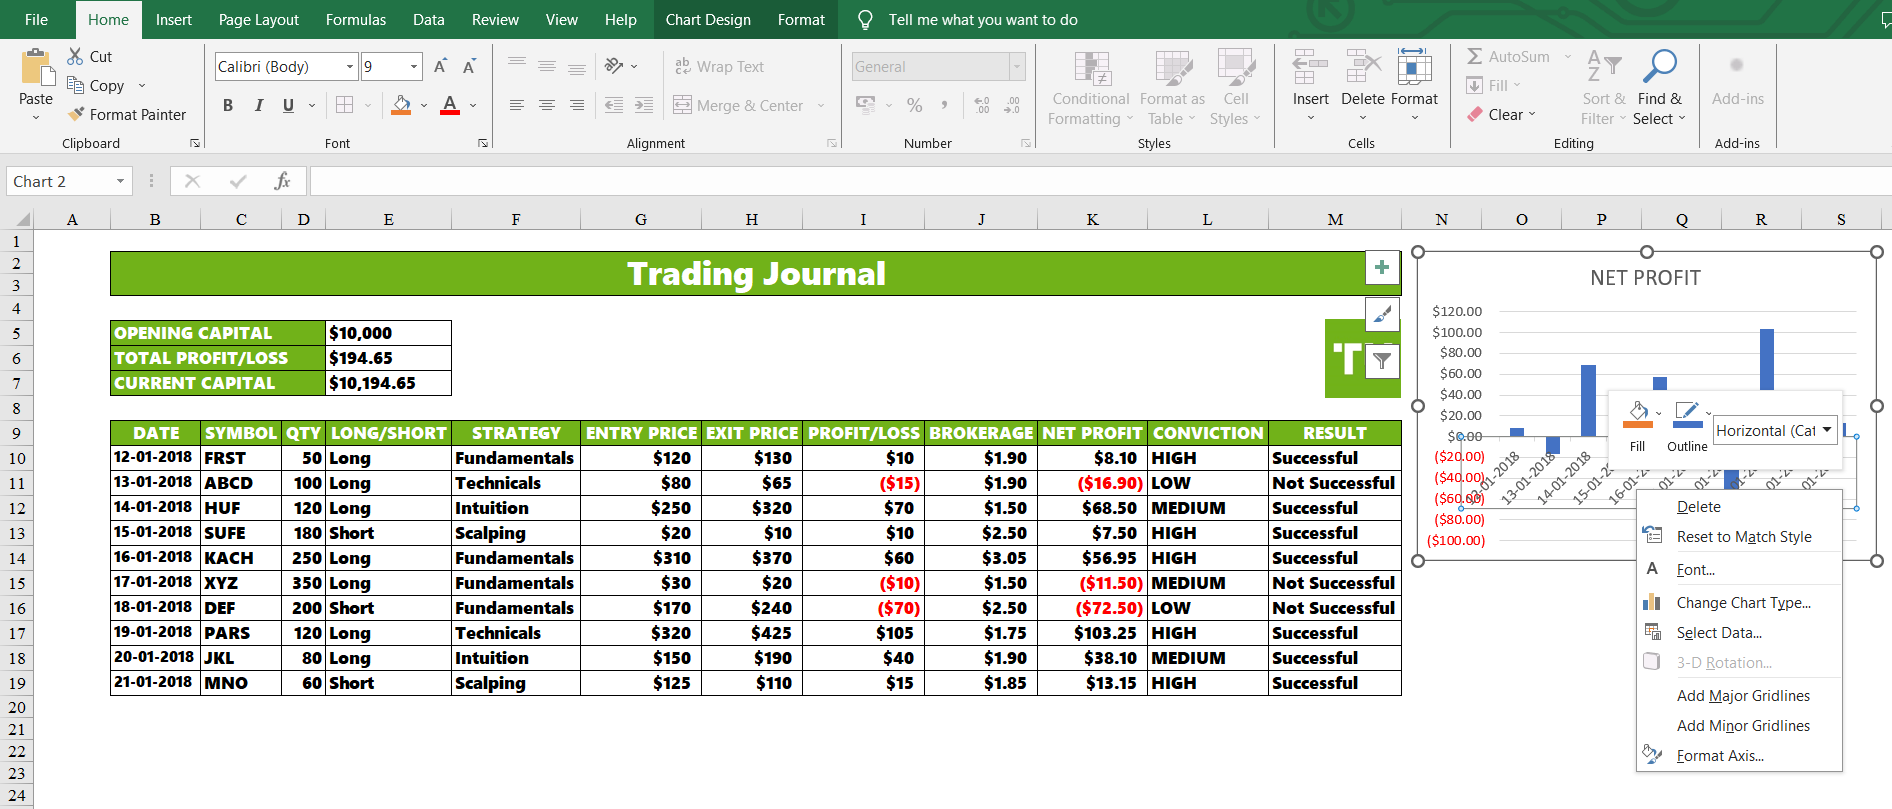 Creating graphs
Once you have inserted your chart, Excel will create a default chart using your selected data. You can customize the chart by right-clicking on various chart elements (axes, data points, legends, etc.) and selecting format options to change colors, labels, and more. Add a title, axis labels, and a legend to make your chart more informative.
Step 4 – Interpret the chart
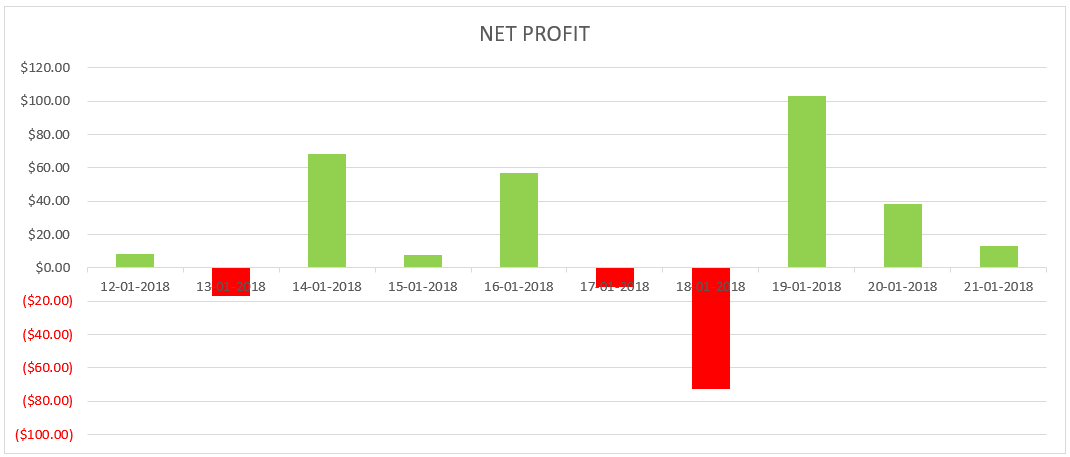 Creating graphs
Your chart will visually represent your trading data. For instance, if you choose "Date" and "Net Profit," the x-axis will show dates, and the y-axis will display your net profit over time. Look for trends, patterns, or any insights that the chart reveals. Are there periods of consistent profitability or losses? Did specific strategies perform better during certain times? Answering these questions will help you interpret your performance better.
Step 5 – Save and update the chart
Save your chart within the Excel document. To keep the chart updated with new trading data, simply add new rows of data to your trading journal as you make new trades. The chart will automatically reflect these changes.
Advantages of maintaining a trading journal
According to experts, maintaining a trading journal has the following advantages:
Unbiased evaluation
A trading journal offers an unbiased record of trades, allowing you to objectively assess your decisions and results.
Learning from errors
By analyzing unsuccessful trades, you gain insights from mistakes and prevent their recurrence.
Leveraging strengths
Trading journals help you to identify your strengths and capitalize on them, focusing on strategies that consistently yield profits.
Adapting and progressing
Regular journal reviews aid in adjusting to changing markets and refining strategies over time.
Understanding emotions
Recording conviction and emotions during trades provides insights into psychological influences on decisions.
Measuring growth
Using trading journals, you can track your trading journey, acknowledging achievements and utilizing setbacks as valuable learning experiences.
Informed choices
Trading journals enable you to rely on historical trade data, rather than memory, for making well-informed decisions.
Maintaining discipline
A trading journal fosters accountability and discipline in your trading approach. Consistency and thoughtful use of a trading journal yield substantial insights into trading patterns and contribute to becoming a more accomplished and prosperous trader.
Don’t aim for a perfect journal from day one

I can say that a trading journal only starts paying off when you stop treating it as a formal record and begin using it as a decision-making tool. Excel works particularly well for this because it forces discipline: you see your numbers exactly as they are, without visual noise or platform-specific bias.
What surprised me most when I first committed to journaling in Excel was how quickly patterns emerged – not just in profitability, but in behavior. Certain setups looked great in theory, yet consistently underperformed once fees and timing were factored in. Others, which I initially considered “secondary,” turned out to be far more stable over time. These insights didn’t come from individual trades, but from aggregated data viewed calmly after the fact.
Another key advantage is flexibility. As your trading evolves, your journal evolves with you. You’re not locked into someone else’s logic – you decide which metrics matter, when to simplify, and when to go deeper. This makes Excel especially valuable for traders who want to think independently rather than blindly follow templates or signals.
My recommendation is simple: don’t aim for a perfect journal from day one. Start tracking consistently, review results weekly, and let the data guide small, practical adjustments. Over time, this process builds confidence not from emotions or streaks, but from evidence – and that’s one of the most underrated edges a trader can have.
Conclusion
Creating a free trading journal in Excel empowers traders to take control of their performance and decision-making. By systematically recording each trade, from entry and exit points to strategy and outcome, traders gain invaluable insights into their habits and areas for improvement. For example, tracking winning and losing trades can highlight patterns such as emotional entries or rushed exits, allowing for targeted refinement. With the provided trading journal template, anyone can kick-start this process without technical hurdles. Ultimately, consistent journaling turns trading into a process of learning and mastery, proving that discipline beats luck in the pursuit of trading success.
FAQs
What are the essential columns to include in a free trading journal in Excel?
How can Excel charts enhance the analysis of your trading journal?
Can you import trade histories from trading platforms directly into Excel?
Why is it important to log the rationale behind each trade in your Excel trading journal?
Editors' Top Picks and Insights

Brent nears $100: Why oil prices are rising

Gram Wallet launch: Can Telegram bring crypto to the masses?

AI without limits: How dangerous are neural networks?

Worldcoin on Wall Street: From iris scans to ETF

Mark Cuban's wealth philosophy: Why stocks matter more than salary or crypto

Dangerous but indispensable: Why the crypto market needs bridges
Related Articles
Team that worked on the article
Parshwa is a content expert and finance professional possessing deep knowledge of stock and options trading, technical and fundamental analysis, and equity research. As a Chartered Accountant Finalist, Parshwa also has expertise in Forex, crypto trading, and personal taxation.
Chinmay Soni is a financial analyst with more than 5 years of experience in working with stocks, Forex, derivatives, and other assets. As a founder of a boutique research firm and an active researcher, he covers various industries and fields, providing insights backed by statistical data.
Mirjan Hipolito is a journalist and news editor at Traders Union. She is an expert crypto writer with five years of experience in the financial markets.
Xetra is a German Stock Exchange trading system that the Frankfurt Stock Exchange operates. Deutsche Börse is the parent company of the Frankfurt Stock Exchange.
Cryptocurrency is a type of digital or virtual currency that relies on cryptography for security. Unlike traditional currencies issued by governments (fiat currencies), cryptocurrencies operate on decentralized networks, typically based on blockchain technology.
Options trading is a financial derivative strategy that involves the buying and selling of options contracts, which give traders the right (but not the obligation) to buy or sell an underlying asset at a specified price, known as the strike price, before or on a predetermined expiration date. There are two main types of options: call options, which allow the holder to buy the underlying asset, and put options, which allow the holder to sell the underlying asset.
Yield refers to the earnings or income derived from an investment. It mirrors the returns generated by owning assets such as stocks, bonds, or other financial instruments.
Index in trading is the measure of the performance of a group of stocks, which can include the assets and securities in it.

-
 Afghanistan
-
 Albania
-
 Algeria
-
 Angola
-
 Argentina
-
 Armenia
-
 Australia
-
 Austria
-
 Azerbaijan
-
 Bahamas
-
 Bahrain
-
 Bangladesh
-
 Belarus
-
 Belgium
-
 Bolivia
-
 Botswana
-
 Brazil
-
 Brunei
-
 Bulgaria
-
 Cambodia
-
 Cameroon
-
 Canada
-
 Chile
Chile
-
 China
China
-
 Colombia
-
 Congo
Congo
-
 Costa Rica
-
 Cote d'Ivoire
-
 Croatia
-
 Cuba
Cuba
-
 Cyprus
-
 Czechia
-
 DR Congo
-
 Denmark
-
 Dominican Republic
-
 Ecuador
-
 Egypt
Egypt
-
 El Salvador
-
 Estonia
-
 Eswatini
-
 Ethiopia
-
 Finland
-
 France
-
 Georgia
-
 Germany
-
 Ghana
Ghana
-
 Greece
-
 Haiti
Haiti
-
 Hong Kong
-
 Hungary
-
 India
India
-
 Indonesia
-
 Iran, Islamic republic
-
 Iraq
Iraq
-
 Ireland
-
 Israel
-
 Italy
Italy
-
 Jamaica
-
 Japan
Japan
-
 Jordan
-
 Kazakhstan
-
 Kenya
Kenya
-
 Korea
Korea
-
 Kuwait
-
 Kyrgyzstan
-
 Laos
Laos
-
 Latvia
-
 Lebanon
-
 Lesotho
-
 Libya
Libya
-
 Lithuania
-
 Luxembourg
-
 Madagascar
-
 Malaysia
-
 Malta
Malta
-
 Mauritius
-
 Mexico
-
 Moldova
-
 Mongolia
-
 Montenegro
-
 Morocco
-
 Mozambique
-
 Myanmar
-
 Namibia
-
 Nepal
Nepal
-
 Netherlands
-
 New Zealand
-
 Nigeria
-
 North Macedonia
-
 Norway
-
 Oman
Oman
-
 Pakistan
-
 Palestine
-
 Panama
-
 Papua New Guinea
-
 Paraguay
-
 Peru
Peru
-
 Philippines
-
 Poland
-
 Portugal
-
 Puerto Rico
-
 Qatar
Qatar
-
 Reunion
-
 Romania
-
 Rwanda
-
 Saudi Arabia
-
 Serbia
-
 Singapore
-
 Slovakia
-
 Slovenia
-
 Somalia
-
 South Africa
-
 Spain
Spain
-
 Sri Lanka
-
 Sweden
-
 Switzerland
-
 Syria
Syria
-
 Taiwan
-
 Tajikistan
-
 Tanzania
-
 Thailand
-
 Trinidad and Tobago
-
 Tunisia
-
 Turkey
-
 UAE
UAE
-
 Uganda
-
 Ukraine
-
 United Kingdom
-
United States
-
 Uruguay
-
 Uzbekistan
-
 Venezuela
-
 Vietnam
-
 Yemen
Yemen
-
 Zambia
-
 Zimbabwe
- Forex
- Crypto
- Download free excel trading journal template
- Importance of maintaining a trading journal
- Creating a trading journal
- Finding the right metrics
- How to analyse trading journal
- Best brokers with extra tools
- How to filter trades based on strategy
- Recording trading strategy for each trade
- Creating graphs
- Advantages of maintaining a trading journal
- Expert opinion
- Conclusion
- FAQs
