Forex Line Trading | Tips And Examples


Editorial Note: While we adhere to strict Editorial Integrity, this post may contain references to products from our partners. Here's an explanation for How We Make Money. None of the data and information on this webpage constitutes investment advice according to our Disclaimer.
Forex line trading involves using lines such as trend lines, support, and resistance levels to predict future price movements. These lines help traders identify potential entry and exit points and understand market trends. Here are some Forex line trading tips:
Forex line trading is a simple and effective trading strategy based on the use of trend lines and support and resistance levels. In this article, we will discuss the top Forex line trading tips along with examples, risks related to this strategy, and impact of major events on this set-up.
Forex line trading tips and examples
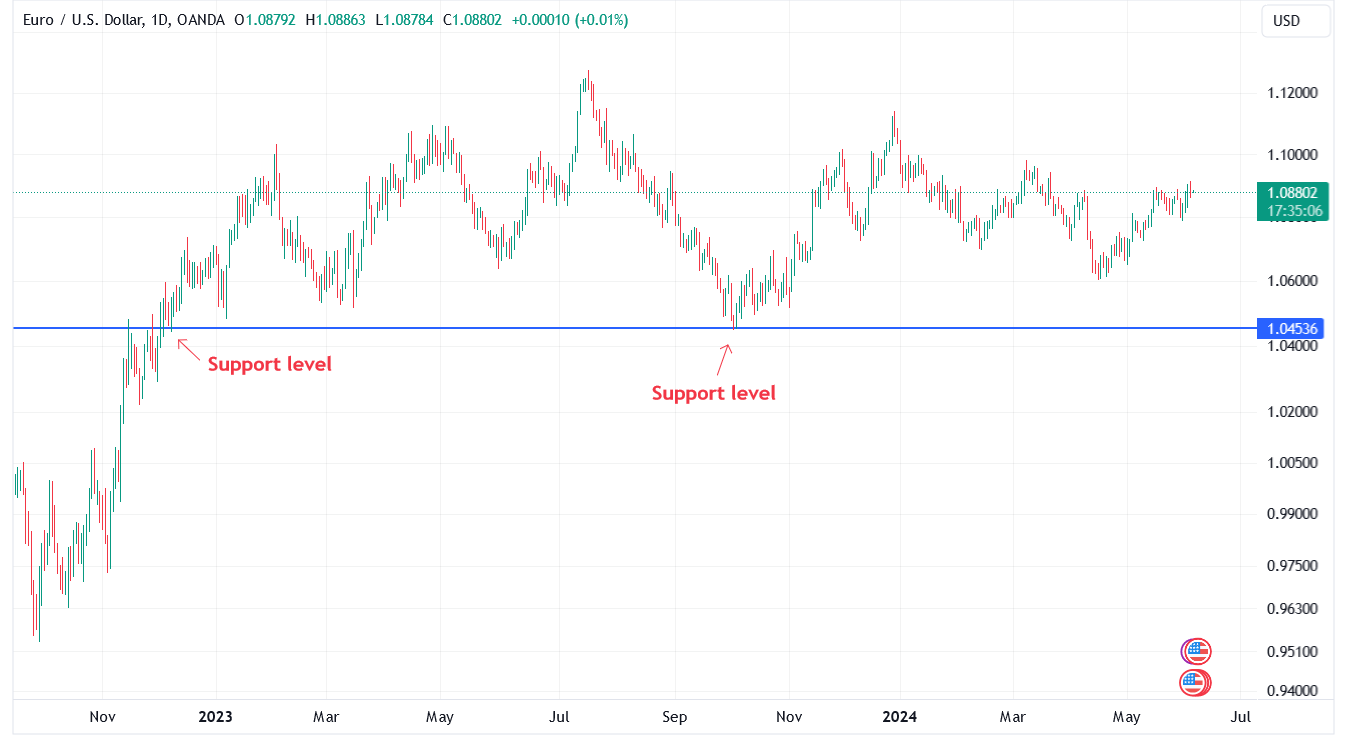
Identify key support and resistance levels
Support and resistance levels are important parameters for identifying potential entry and exit points in trading. Support levels show where the price can stop falling and turn upwards, and resistance levels show where the price can stop rising and start declining.
Using these levels in combination with other technical indicators, such as moving averages, can enhance trading decisions. Traders can place buy orders near support levels and sell orders near resistance levels.
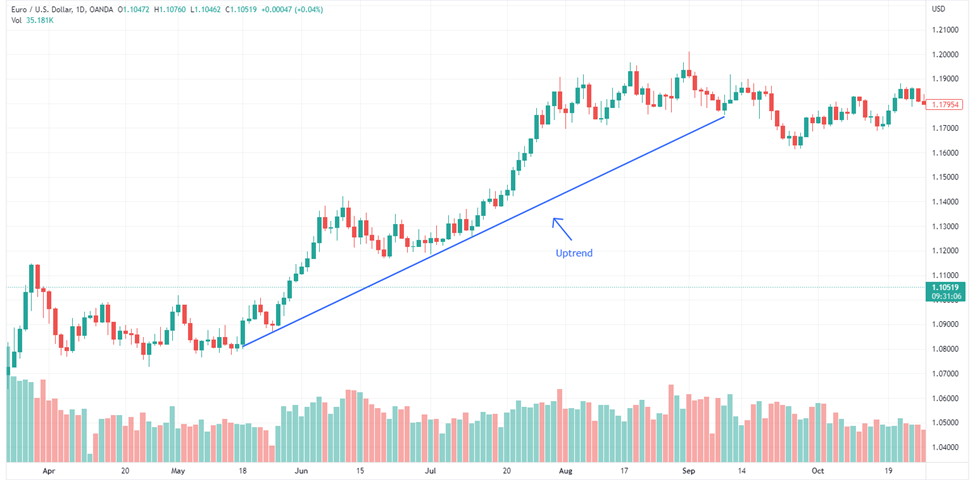
Use trend lines for market direction
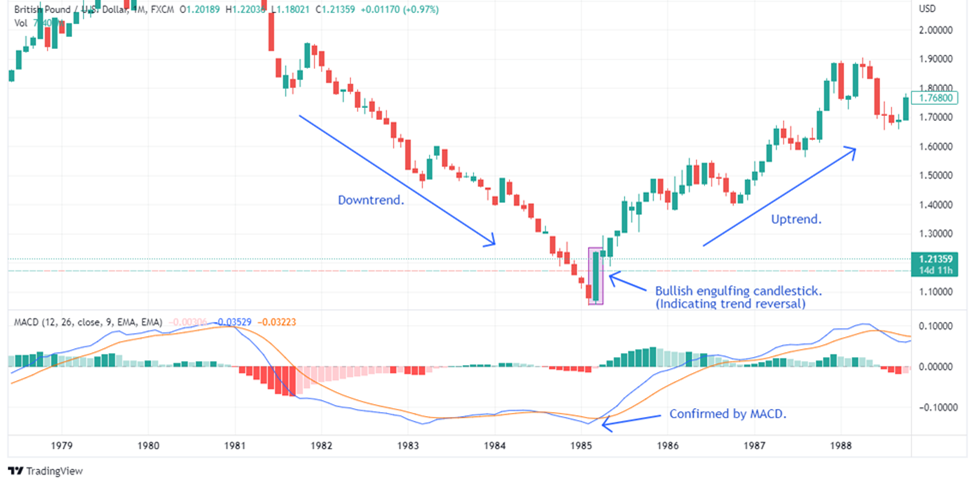
Trend lines help in identifying the overall direction of the market. An uptrend is indicated by a line drawn along the lows, while a downtrend is marked by a line along the highs.
Trend lines are used not only to identify trends but also to predict potential reversals. When a trend line is broken, it can signal a change in market direction.
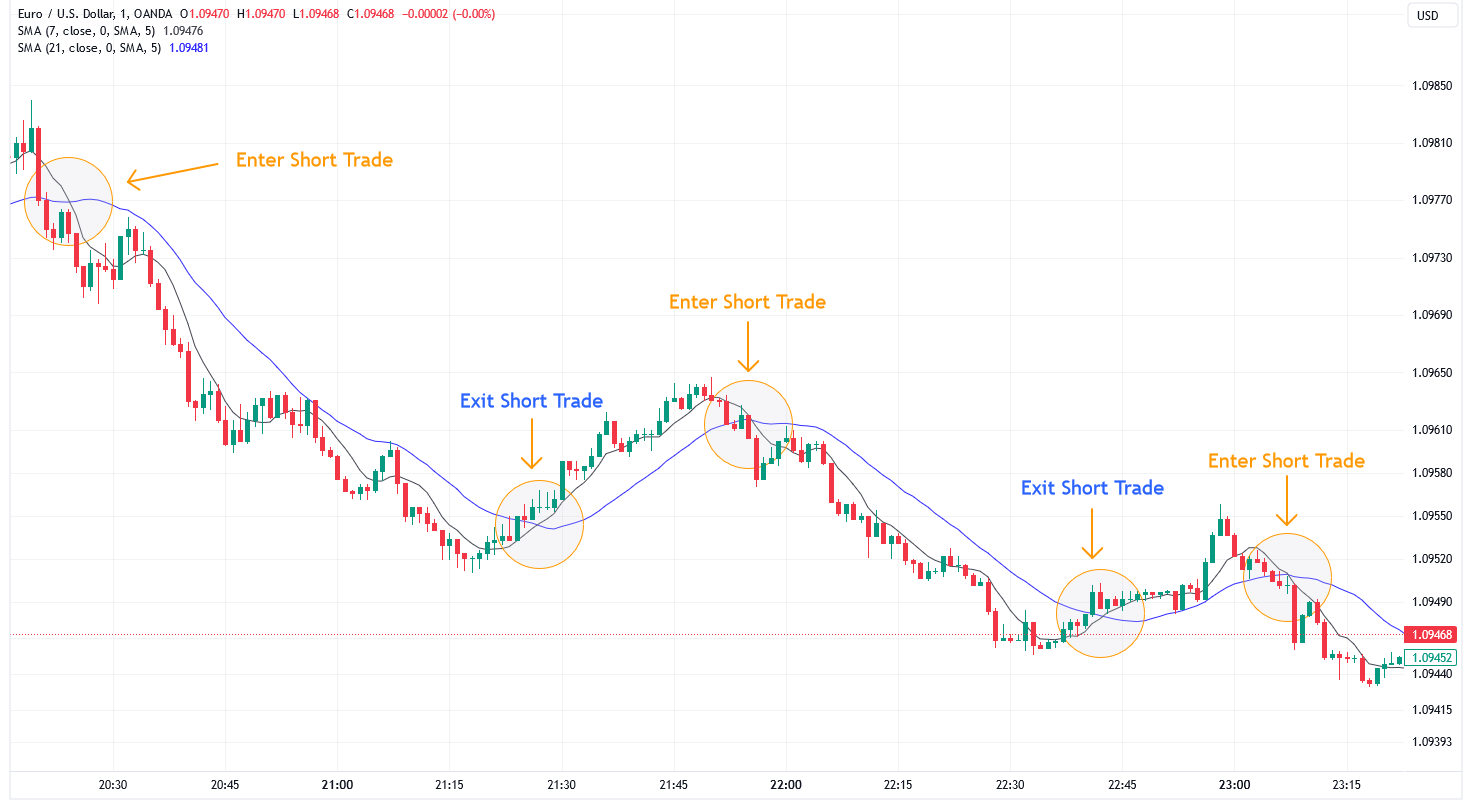
Incorporate moving averages
Moving averages smooth out price data to help identify the direction of the trend. Simple Moving Averages (SMA) and Exponential Moving Averages (EMA) are the most commonly used types.
Combining short-term and long-term moving averages can provide signals for entry and exit points. For example, a buy signal occurs when a short-term moving average crosses above a long-term moving average.
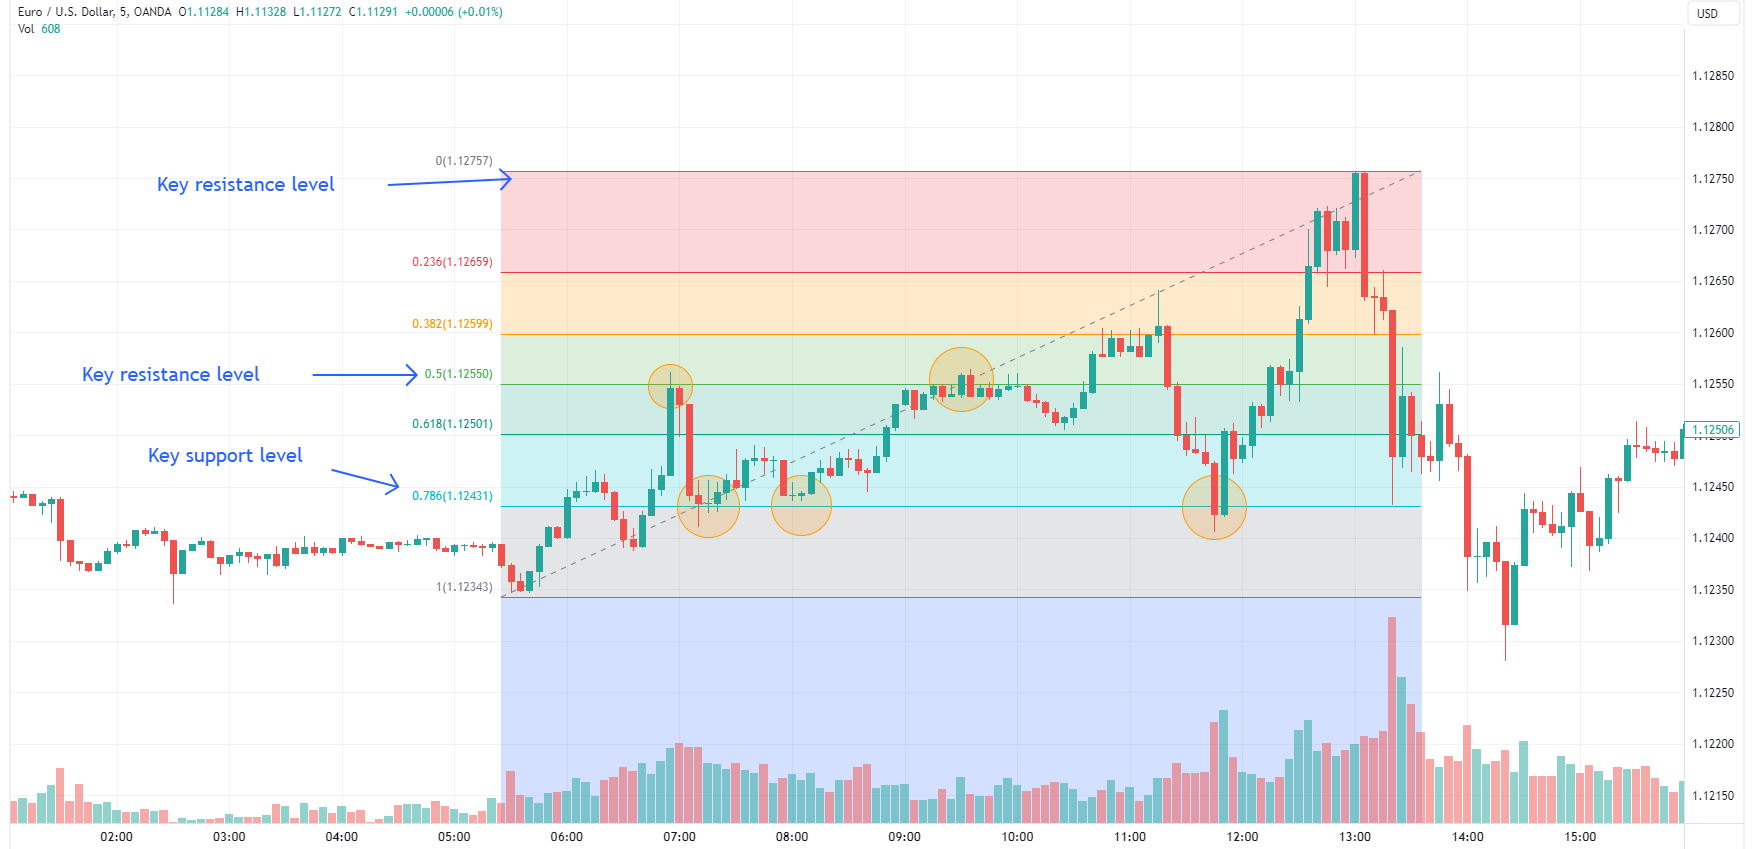
Leverage Fibonacci retracement levels
Fibonacci retracement levels help in predicting potential reversal points by identifying levels where price movements are likely to stall and reverse.
Fibonacci levels are used in conjunction with other indicators to confirm potential reversal points. Common retracement levels include 38.2%, 50%, and 61.8%.
Utilize price action trading
Price action trading focuses on historical price movements to make trading decisions. It involves analyzing candlestick patterns, chart patterns, and trend lines. Key price action patterns like pin bars, inside bars, and engulfing patterns can provide signals for entering or exiting trades.
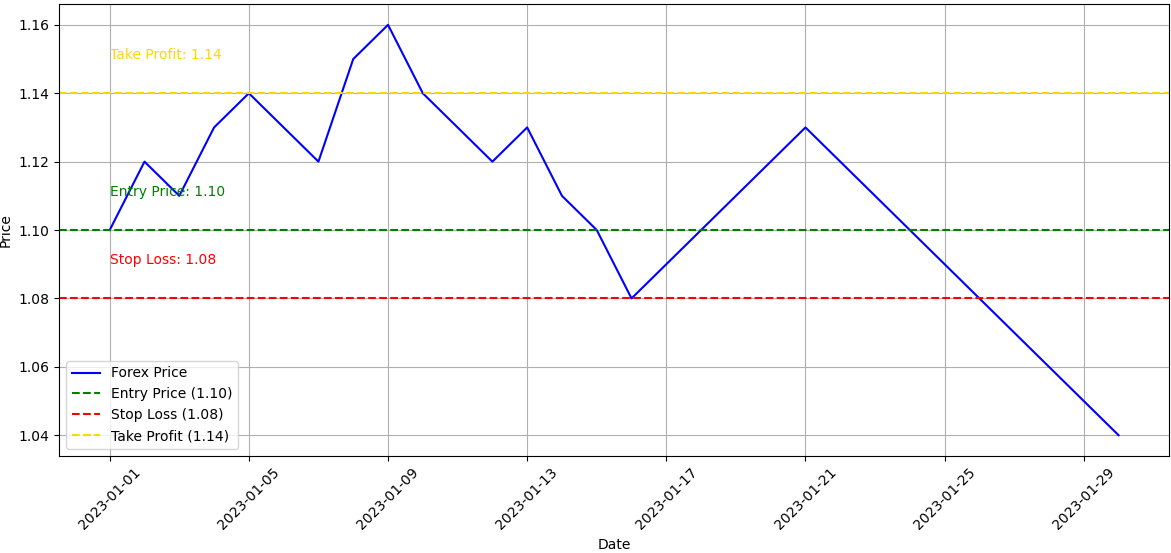
Implement risk management techniques
Risk management is crucial in trading. Using stop-loss and take-profit orders helps manage potential losses and secure profits.
Proper risk management strategies can significantly improve long-term trading success. Traders should never risk more than a small percentage of their capital on a single trade.
Risks and how to avoid them
The main risks that you may encounter in Forex line trading and their mitigation strategies are discussed below:
Market volatility can lead to significant price swings, increasing the potential for both gains and losses;
Leverage risks can amplify both gains and losses, making it a double-edged sword in trading;
Economic and geopolitical risks can bring large movements in Forex prices.
How to avoid them:
Setting stop-loss orders can help limit potential losses and protect your capital;
Diversifying your investments across multiple assets can help reduce overall risk;
Adjusting trade size based on risk tolerance and account size helps manage potential losses.
Recommendations on Forex line trading

There are a few key recommendations that can really help you up your Forex trading game. First off, mastering the basics is essential. Make sure you understand how to draw and use trend lines, as well as identify support and resistance levels. These tools are helpful for spotting trading opportunities and making smart decisions.
Another important tip is to keep an eye on moving averages. They can help you identify trends and potential reversals, giving you a clearer picture of the market. Don't forget about risk management either. Always set stop-loss orders to protect your capital and avoid significant losses.
Next thing to keep in mind is staying disciplined. Stick to your trading plan and don't let emotions drive your decisions. Consistency and a clear strategy are your best friends in trading.
Lastly, never stop learning. The Forex market is constantly evolving, so keep educating yourself. Read market reports, take online courses, and stay updated with financial news. The more you learn, the better you'll become at anticipating market movements and making profitable trades.
Conclusion
Forex line trading is a simple strategy using trend lines and support and resistance levels. A major part of the strategy is identifying support and resistance levels to spot entry and exit points, where buying is done near support and selling is done near resistance. For traders using this strategy, applying risk management techniques, such as stop-loss and take-profit orders is important for managing losses and securing profits. Risks in Forex line trading include market volatility, leverage, and geopolitical events. These can be mitigated by setting stop-loss orders, diversifying investments, and adjusting trade size. Finally, maintaining discipline, adhering to a trading plan, and continuous learning are key for improving trading skills and making profitable trades.
FAQs
How do I draw trend lines on a Forex chart?
To draw a trend line, connect at least two high points for a downtrend line or two low points for an uptrend line. The more points a trend line touches, the more significant it becomes.
What are support and resistance levels in Forex trading?
Support levels are price points where a currency tends to find buying interest and stop falling, while resistance levels are points where selling interest prevents the price from rising. Identifying these levels helps in making informed trading decisions.
Why are moving averages important in Forex trading?
Moving averages smooth out price data to help identify trends. They are used to generate buy and sell signals based on crossovers and to confirm the direction of the trend. Common types include Simple Moving Averages (SMA) and Exponential Moving Averages (EMA).
How can Fibonacci retracement levels be used in Forex trading?
Fibonacci retracement levels are used to identify potential reversal points by dividing the vertical distance between high and low points by key Fibonacci ratios (23.6%, 38.2%, 50%, 61.8%, and 100%). These levels help predict where the price might retrace before continuing in the original direction.
Editors' Top Picks and Insights

Bitcoin price prediction based on RSI: Is BTC poised for a new rally?

Toncoin becomes Gram: Why Durov restored token's original name

Why Tether flipping Ethereum is a pivotal moment for crypto

MiCA deadline: Why crypto companies are leaving Europe

From “Holy Trinity” to WLD crash: How Arthur Hayes became a market-moving seller

The world's first trillionaire: How Musk built his fortune on electric cars, space and AI
Related Articles
Team that worked on the article
Chinmay Soni is a financial analyst with more than 5 years of experience in working with stocks, Forex, derivatives, and other assets. As a founder of a boutique research firm and an active researcher, he covers various industries and fields, providing insights backed by statistical data.
Dr. BJ Johnson is a PhD in English Language and an editor with over 15 years of experience. He earned his degree in English Language in the U.S and the UK.
Mirjan Hipolito is a journalist and news editor at Traders Union. She is an expert crypto writer with five years of experience in the financial markets.
Forex trading, short for foreign exchange trading, is the practice of buying and selling currencies in the global foreign exchange market with the aim of profiting from fluctuations in exchange rates. Traders speculate on whether one currency will rise or fall in value relative to another currency and make trading decisions accordingly. However, beware that trading carries risks, and you can lose your whole capital.
Volatility refers to the degree of variation or fluctuation in the price or value of a financial asset, such as stocks, bonds, or cryptocurrencies, over a period of time. Higher volatility indicates that an asset's price is experiencing more significant and rapid price swings, while lower volatility suggests relatively stable and gradual price movements.
Index in trading is the measure of the performance of a group of stocks, which can include the assets and securities in it.
Take-Profit order is a type of trading order that instructs a broker to close a position once the market reaches a specified profit level.
Cryptocurrency is a type of digital or virtual currency that relies on cryptography for security. Unlike traditional currencies issued by governments (fiat currencies), cryptocurrencies operate on decentralized networks, typically based on blockchain technology.

-
 Afghanistan
-
 Albania
-
 Algeria
-
 Angola
-
 Argentina
-
 Armenia
-
 Australia
-
 Austria
-
 Azerbaijan
-
 Bahamas
-
 Bahrain
-
 Bangladesh
-
 Belarus
-
 Belgium
-
 Bolivia
-
 Botswana
-
 Brazil
-
 Brunei
-
 Bulgaria
-
 Cambodia
-
 Cameroon
-
 Canada
-
 Chile
Chile
-
 China
China
-
 Colombia
-
 Congo
Congo
-
 Costa Rica
-
 Cote d'Ivoire
-
 Croatia
-
 Cuba
Cuba
-
 Cyprus
-
 Czechia
-
 DR Congo
-
 Denmark
-
 Dominican Republic
-
 Ecuador
-
 Egypt
Egypt
-
 El Salvador
-
 Estonia
-
 Eswatini
-
 Ethiopia
-
 Finland
-
 France
-
 Georgia
-
 Germany
-
 Ghana
Ghana
-
 Greece
-
 Haiti
Haiti
-
 Hong Kong
-
 Hungary
-
 India
India
-
 Indonesia
-
 Iran, Islamic republic
-
 Iraq
Iraq
-
 Ireland
-
 Israel
-
 Italy
Italy
-
 Jamaica
-
 Japan
Japan
-
 Jordan
-
 Kazakhstan
-
 Kenya
Kenya
-
 Korea
Korea
-
 Kuwait
-
 Kyrgyzstan
-
 Laos
Laos
-
 Latvia
-
 Lebanon
-
 Lesotho
-
 Libya
Libya
-
 Lithuania
-
 Luxembourg
-
 Madagascar
-
 Malaysia
-
 Malta
Malta
-
 Mauritius
-
 Mexico
-
 Moldova
-
 Mongolia
-
 Montenegro
-
 Morocco
-
 Mozambique
-
 Myanmar
-
 Namibia
-
 Nepal
Nepal
-
 Netherlands
-
 New Zealand
-
 Nigeria
-
 North Macedonia
-
 Norway
-
 Oman
Oman
-
 Pakistan
-
 Palestine
-
 Panama
-
 Papua New Guinea
-
 Paraguay
-
 Peru
Peru
-
 Philippines
-
 Poland
-
 Portugal
-
 Puerto Rico
-
 Qatar
Qatar
-
 Reunion
-
 Romania
-
 Rwanda
-
 Saudi Arabia
-
 Serbia
-
 Singapore
-
 Slovakia
-
 Slovenia
-
 Somalia
-
 South Africa
-
 Spain
Spain
-
 Sri Lanka
-
 Sweden
-
 Switzerland
-
 Syria
Syria
-
 Taiwan
-
 Tajikistan
-
 Tanzania
-
 Thailand
-
 Trinidad and Tobago
-
 Tunisia
-
 Turkey
-
 UAE
UAE
-
 Uganda
-
 Ukraine
-
 United Kingdom
-
United States
-
 Uruguay
-
 Uzbekistan
-
 Venezuela
-
 Vietnam
-
 Yemen
Yemen
-
 Zambia
-
 Zimbabwe
- Forex
- Crypto
