Repainting (Redrawing) Indicators In Forex


Editorial Note: While we adhere to strict Editorial Integrity, this post may contain references to products from our partners. Here's an explanation for How We Make Money. None of the data and information on this webpage constitutes investment advice according to our Disclaimer.
Repainting indicators in Forex are technical analysis tools that change their historical values as new data becomes available. This can lead to misleading signals during live trading, making it essential for traders to understand their limitations and use them cautiously, often in conjunction with non-repainting indicators for more reliable analysis.
Repainting indicators, also known as redrawing indicators, alter their historical values whenever new data is received. This continuous recalculation can make an indicator appear highly accurate in retrospect, even though its real-time signals might have been unreliable. While they might seem to offer perfect predictions in backtests, their application in live trading often reveals significant shortcomings. Let’s explore how to tackle using such indicators.
How do repainting indicators work?
Repainting indicators adjust their outputs with every new data point, which can significantly change their historical appearance on a chart. For instance, an indicator designed to signal buy or sell opportunities might shift these signals as new candlesticks form, leading traders to believe it predicted market movements more accurately than it actually did.
The impact of repainting indicators on trading
Repainting indicators can have a material impact on trading strategies, often leading to unexpected outcomes:
Misleading signals. The most significant risk associated with repainting indicators is the potential for misleading signals. For example, an indicator might show a strong buy signal during live trading, only for that signal to disappear or change as the market evolves, resulting in potential losses.
False confidence. Repainting indicators can create a false sense of confidence, particularly among novice traders. When backtesting, these indicators may appear to have flawlessly predicted market movements, leading traders to place undue trust in them.
Disrupted trading strategies. For traders relying on precise entry and exit points, the instability of repainting indicators can be particularly damaging. A strategy that looks robust in historical analysis may fail in live trading due to the indicator's shifting nature.
Recognizing repainting indicators
Here is a more detailed breakdown of some commonly used indicators known for their repainting tendencies:
ZigZag indicator
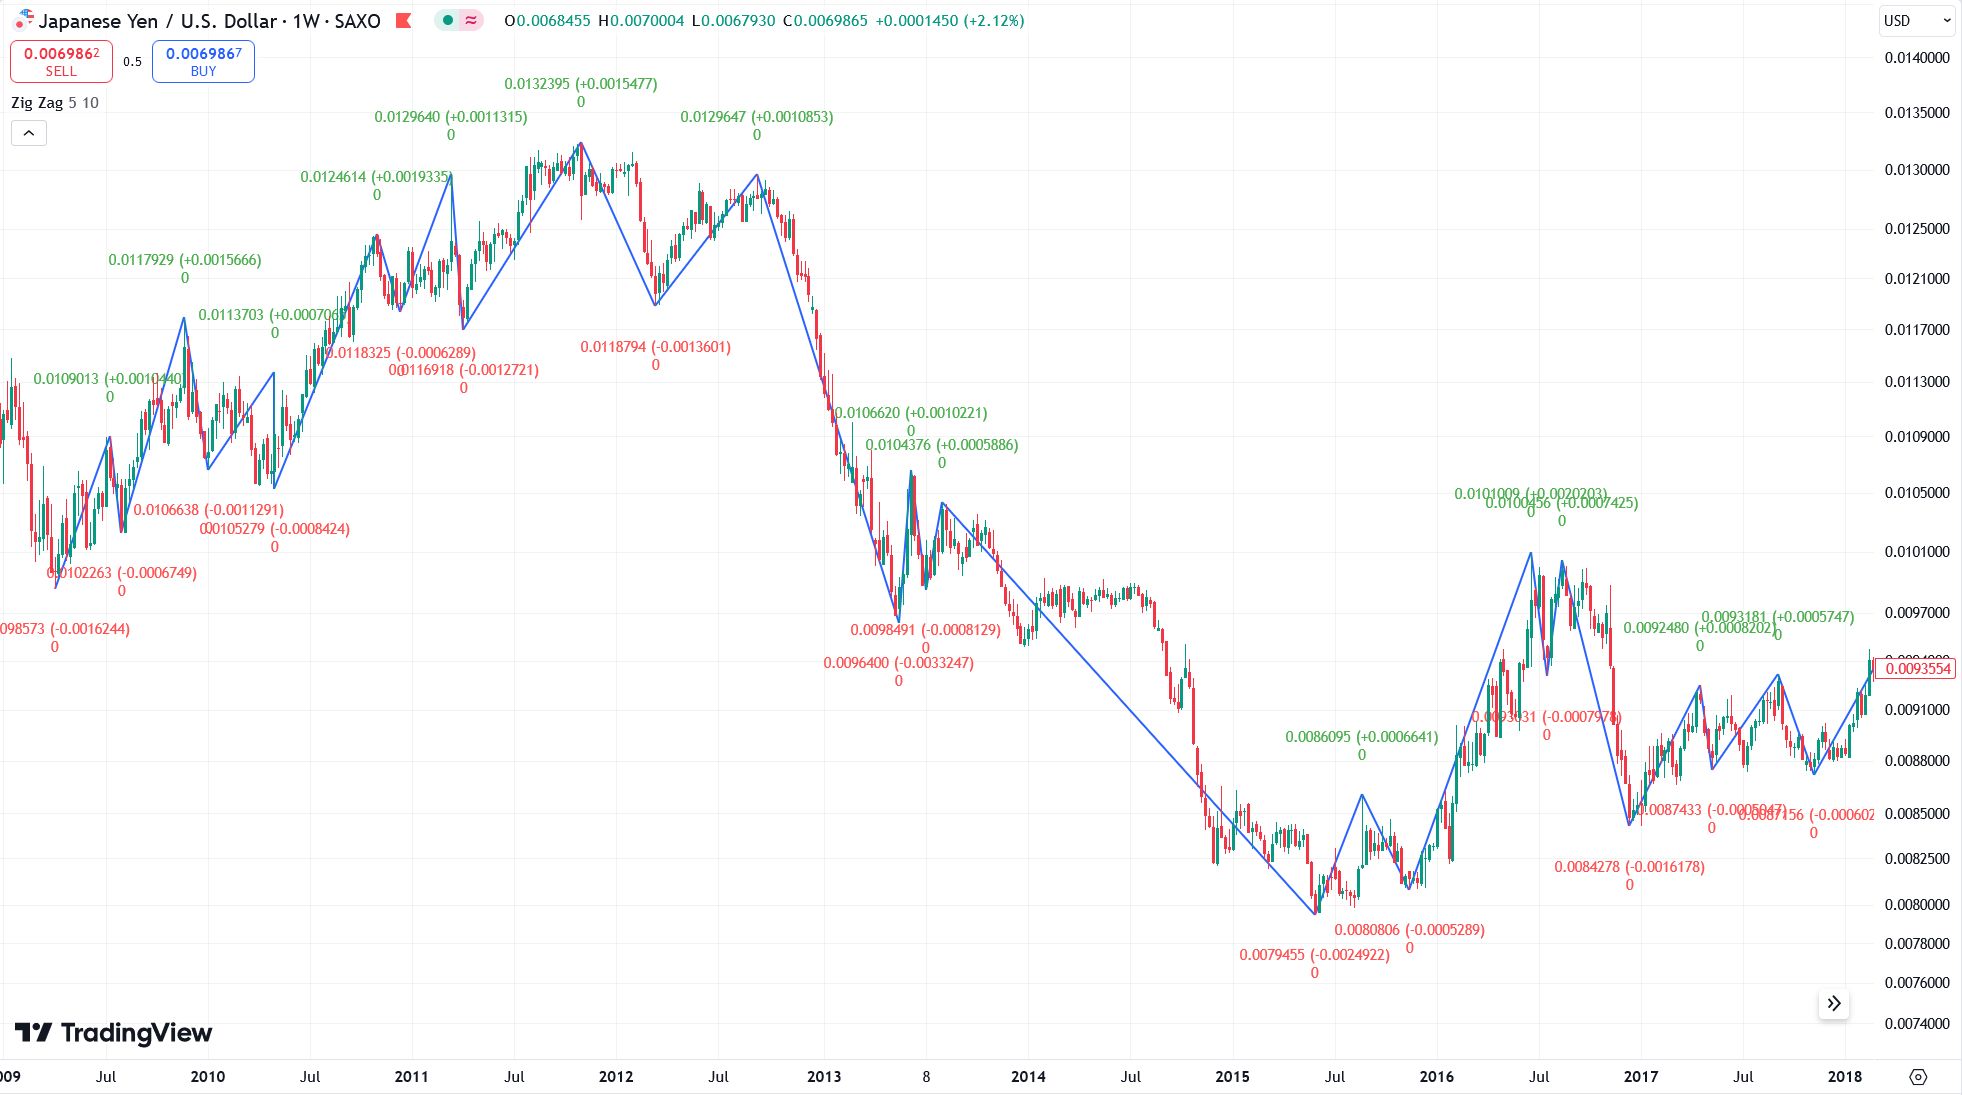
The ZigZag indicator is a popular tool designed to help traders filter out minor price movements and focus on the significant trends. It achieves this by drawing lines between the peaks and troughs that exceed a certain percentage of price movement, effectively smoothing out the price action.
However, one of the main drawbacks of the ZigZag indicator is its propensity to repaint. As new price data comes in, the indicator can adjust its previous points, altering the placement of the highs and lows that define the trend lines. For example, if the price movement does not reach the required percentage to validate a high or low, the indicator might remove or shift the point, changing the historical trendline. This can make the ZigZag indicator appear more accurate in hindsight than it is in real-time, potentially leading to false confidence in a trading strategy.
SuperTrend Indicator
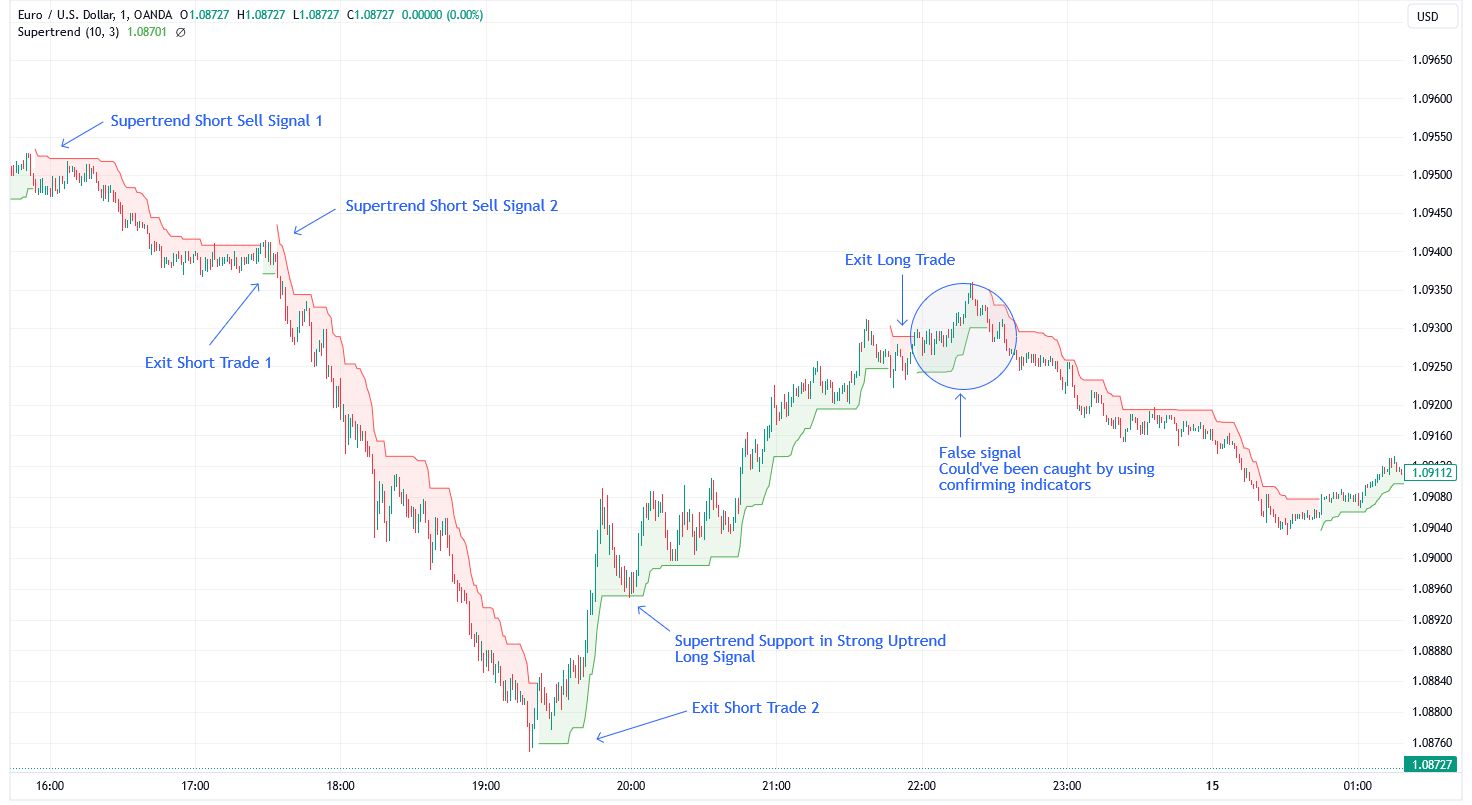
The SuperTrend indicator is widely used for identifying the prevailing trend and providing clear entry and exit points. It overlays a line on the price chart, indicating whether the market is in an uptrend or downtrend. This line is calculated using a combination of an average true range (ATR) and a chosen multiplier, which helps to set the distance of the line from the price.
While the SuperTrend indicator can be effective in trending markets, it is prone to repainting, especially in volatile market conditions. During periods of rapid price changes, the indicator may shift its position significantly, leading to the sudden disappearance or appearance of trend signals. For instance, a signal that appeared as a buy may change to a sell as the indicator recalculates its values based on the new price action. This can lead to confusion and potential losses if traders rely solely on these signals without additional confirmation. Learn more about Supertrend indicator settings and strategies.
Elliott Wave Indicators
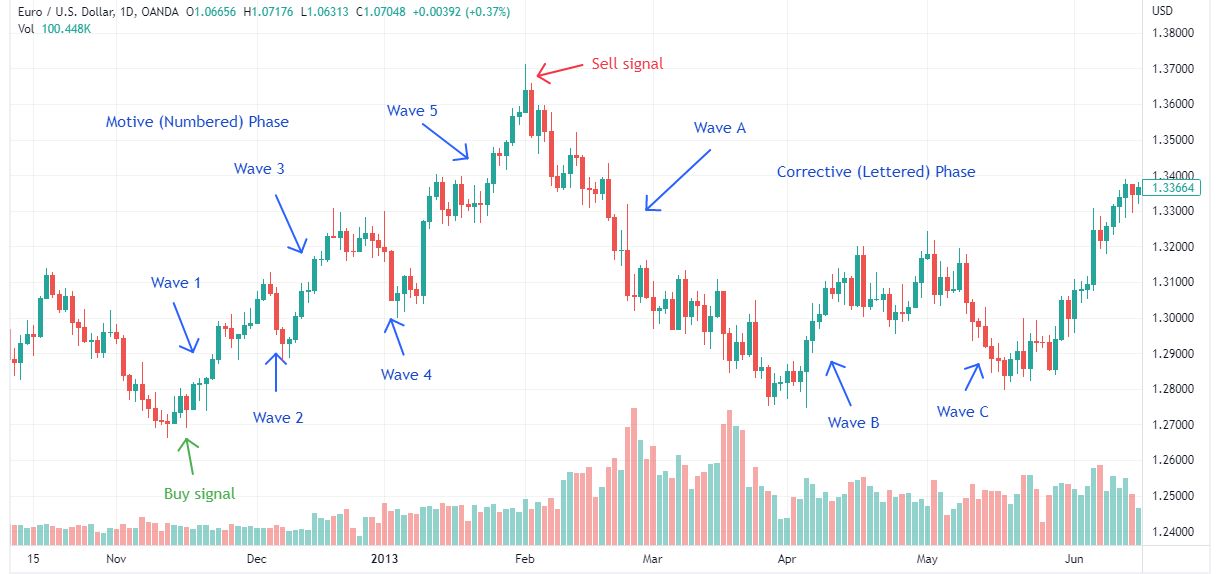
Elliott Wave indicators are based on the Elliott Wave theory, which posits that market movements follow a predictable pattern of five waves in the direction of the main trend, followed by three corrective waves. These indicators are designed to help traders identify these wave patterns in real-time.
However, the inherent complexity of market behavior means that these patterns do not always unfold as expected. As new price data is integrated, the indicator may adjust its interpretation of where a wave begins and ends, resulting in repainting. For example, a wave that was initially marked as the start of a new trend might be reassigned to a different position if the subsequent price action does not conform to the expected pattern. This repainting can be particularly problematic in volatile or unpredictable markets, where the waves may not follow the idealized structure that the indicator anticipates. Traders using Elliott Wave indicators need to be aware of this tendency and should consider combining it with other tools to confirm the analysis.
The strategies to mitigate repainting risks
There are some ways to tackle the issues that come with repainting indicators:
Use non-repainting indicators. One of the most effective strategies is to pair repainting indicators with non-repainting ones. Indicators like the Moving Average Convergence Divergence (MACD) or the Relative Strength Index (RSI) provide stable outputs, helping to confirm signals generated by repainting tools.
Rigorous backtesting across market conditions. Traders should rigorously backtest their indicators across various market conditions, including trending and sideways markets. This process helps reveal how the indicator behaves over time and whether it is prone to repainting.
Use higher time frames. Repainting is more pronounced on lower timeframes, where market noise can cause significant fluctuations in the indicator’s output. Switching to higher time frames can reduce the impact of repainting and provide a clearer view of the market's true direction.
Stay updated with the latest tools. The Forex market and the tools to analyze it are dynamic. Traders should regularly update their trading platforms and indicators, as updates often address known issues, including repainting.
Engage with the trading community. Engaging with other traders can provide valuable insights into the behavior of various indicators. Experienced traders often share their experiences with specific indicators, including whether they repaint and how to mitigate their effects.
Combine stable indicators with direct market analysis methods

Getting to grips with repainting indicators as a beginner in Forex can feel overwhelming, like trying to find your way without clear directions. Start by checking how consistent the indicator has been in the past. Instead of just watching it in action, go back over your charts for the last six months. Check to see if the signals it gave then still stand up to scrutiny now. This exercise helps you separate the indicators that just repaint from those that give signals you can trust. Tools like the ZigZag or Ichimoku Kinko Hyo can be set to reveal dependable insights when you adjust their settings to avoid retrospective changes.
Another clever strategy is to combine stable indicators with direct market analysis methods like price action. For example, if your repainting indicator is pointing to a buy opportunity, confirm this by looking for a bullish engulfing candlestick pattern at a key support level at the same time. Using this two-pronged approach reduces the risk of falling for false signals, which is a common pitfall when relying solely on repainting indicators. This way, you enhance your decision-making and boost your chances in the ever-changing Forex market.
Summary
Repainting indicators, while intriguing, present significant challenges for traders. Their tendency to alter past data can make them unreliable as standalone tools. However, by combining them with non-repainting indicators, backtesting thoroughly, and staying informed, traders can mitigate the risks associated with repainting and enhance the accuracy of their trading strategies. Understanding and addressing these challenges is crucial for successful Forex trading.
FAQs
How do I know if an indicator repaints?
Observe if past signals change when you refresh or scroll through historical data. If they do, it repaints.
Does the fractal indicator repaint?
Yes, the fractal indicator repaints as it needs two bars to confirm a fractal.
How to identify a strong trend in Forex?
Look for consistent higher highs and higher lows for an uptrend, and lower highs and lower lows for a downtrend, accompanied by high trading volume.
What are some common non-repainting indicators?
Common non-repainting indicators include the Moving Average Convergence Divergence (MACD), Relative Strength Index (RSI), and Moving Averages, all of which provide stable, consistent signals without altering historical data.
Editors' Top Picks and Insights

Pokémon cards for $2,500: How collectibles became a new form of gambling

The privacy paradox: How the crypto mixer market has changed

Is Bitcoin right for you? Five traits shared by many cryptocurrency holders

Chasing hits: Why investors are losing interest in Netflix

Tokenized stocks in the spotlight: How do they work and are they worth trading?

Do politicians make the best stock traders?
Related Articles
Team that worked on the article
Oleg Tkachenko is an economic analyst and risk manager having more than 14 years of experience in working with systemically important banks, investment companies, and analytical platforms. He has been a Traders Union analyst since 2018.
Chinmay Soni is a financial analyst with more than 5 years of experience in working with stocks, Forex, derivatives, and other assets. As a founder of a boutique research firm and an active researcher, he covers various industries and fields, providing insights backed by statistical data.
Mirjan Hipolito is a journalist and news editor at Traders Union. She is an expert crypto writer with five years of experience in the financial markets.
Supertrend Indicator is a trend-following indicator that helps traders identify potential entry and exit points in the market. It combines price and volatility data to plot a trend-following line that can be used to guide trading decisions. When the price is above the Supertrend line, it suggests a bullish trend, and when below, a bearish trend.
An investor is an individual, who invests money in an asset with the expectation that its value would appreciate in the future. The asset can be anything, including a bond, debenture, mutual fund, equity, gold, silver, exchange-traded funds (ETFs), and real-estate property.
Index in trading is the measure of the performance of a group of stocks, which can include the assets and securities in it.
Forex trading, short for foreign exchange trading, is the practice of buying and selling currencies in the global foreign exchange market with the aim of profiting from fluctuations in exchange rates. Traders speculate on whether one currency will rise or fall in value relative to another currency and make trading decisions accordingly. However, beware that trading carries risks, and you can lose your whole capital.
CFD is a contract between an investor/trader and seller that demonstrates that the trader will need to pay the price difference between the current value of the asset and its value at the time of contract to the seller.

-
 Afghanistan
-
 Albania
-
 Algeria
-
 Angola
-
 Argentina
-
 Armenia
-
 Australia
-
 Austria
-
 Azerbaijan
-
 Bahamas
-
 Bahrain
-
 Bangladesh
-
 Belarus
-
 Belgium
-
 Bolivia
-
 Botswana
-
 Brazil
-
 Brunei
-
 Bulgaria
-
 Cambodia
-
 Cameroon
-
 Canada
-
 Chile
Chile
-
 China
China
-
 Colombia
-
 Congo
Congo
-
 Costa Rica
-
 Cote d'Ivoire
-
 Croatia
-
 Cuba
Cuba
-
 Cyprus
-
 Czechia
-
 DR Congo
-
 Denmark
-
 Dominican Republic
-
 Ecuador
-
 Egypt
Egypt
-
 El Salvador
-
 Estonia
-
 Eswatini
-
 Ethiopia
-
 Finland
-
 France
-
 Georgia
-
 Germany
-
 Ghana
Ghana
-
 Greece
-
 Haiti
Haiti
-
 Hong Kong
-
 Hungary
-
 India
India
-
 Indonesia
-
 Iran, Islamic republic
-
 Iraq
Iraq
-
 Ireland
-
 Israel
-
 Italy
Italy
-
 Jamaica
-
 Japan
Japan
-
 Jordan
-
 Kazakhstan
-
 Kenya
Kenya
-
 Korea
Korea
-
 Kuwait
-
 Kyrgyzstan
-
 Laos
Laos
-
 Latvia
-
 Lebanon
-
 Lesotho
-
 Libya
Libya
-
 Lithuania
-
 Luxembourg
-
 Madagascar
-
 Malaysia
-
 Malta
Malta
-
 Mauritius
-
 Mexico
-
 Moldova
-
 Mongolia
-
 Montenegro
-
 Morocco
-
 Mozambique
-
 Myanmar
-
 Namibia
-
 Nepal
Nepal
-
 Netherlands
-
 New Zealand
-
 Nigeria
-
 North Macedonia
-
 Norway
-
 Oman
Oman
-
 Pakistan
-
 Palestine
-
 Panama
-
 Papua New Guinea
-
 Paraguay
-
 Peru
Peru
-
 Philippines
-
 Poland
-
 Portugal
-
 Puerto Rico
-
 Qatar
Qatar
-
 Reunion
-
 Romania
-
 Rwanda
-
 Saudi Arabia
-
 Serbia
-
 Singapore
-
 Slovakia
-
 Slovenia
-
 Somalia
-
 South Africa
-
 Spain
Spain
-
 Sri Lanka
-
 Sweden
-
 Switzerland
-
 Syria
Syria
-
 Taiwan
-
 Tajikistan
-
 Tanzania
-
 Thailand
-
 Trinidad and Tobago
-
 Tunisia
-
 Turkey
-
 UAE
UAE
-
 Uganda
-
 Ukraine
-
 United Kingdom
-
United States
-
 Uruguay
-
 Uzbekistan
-
 Venezuela
-
 Vietnam
-
 Yemen
Yemen
-
 Zambia
-
 Zimbabwe
- Forex
- Crypto
