11 Steps to Analyze Forex Charts
Analyzing Forex charts is crucial to make proper decisions in trading. There are different technical and fundamental tools that help in chart analysis. Reviewing the past market can help predict the future price.
In the foreign exchange market, analyzing Forex charts is essential. If you're starting, it can be an exhaustive task, but the right skills and knowledge will help you in the process. The analysis lets you review past market prices and predict future investment movements.
Several ways go into the process: identifying the time frame, the kind of chart and technical indicators. Precisely, analyzing Forex charts requires you to use a mix of fundamental and technical methods that we will discuss in the blog.
Do you want to start trading Forex? Open an account on RoboForex!What is a Forex Chart?
A Forex chart is a graphical expression of price movements in the foreign exchange market. It displays the exchange rate of one currency against another over a particular time span. Forex charts are essential for analyzing historical price data, identifying trends, and making certain decisions about buying or selling currencies.
The different kinds of Forex Charts are:
-
Line Charts
-
Bar Charts
-
Candlestick Charts
-
Japanese Candlestick Patterns
Forex charts are customizable regarding timeframes, and you can use them with technical indicators and analysis tools to make trading decisions.
Past chart prices help predict future costs in the foreign exchange market, and here's why:
Historical Price Patterns
Charts display patterns and trends that have happened in the past. These patterns can repeat themselves, providing insights into potential future price movements. For example, if a currency pair has consistently shown an uptrend, that trend could continue.
Market Psychology
Charts reflect market participants' collective actions and emotions. Human psychology often affects patterns like support and resistance levels, head and shoulders, or double tops/bottoms. Traders believe that these patterns indicate potential reversal or continuation of trends.
Technical Indicators
Traders use technical indicators (e.g., moving averages, Relative Strength Index - RSI, Moving Average Convergence Divergence - MACD) alongside price charts. These indicators are mathematical calculations based on historical price data and can help you identify overbought or oversold conditions, trend strength, and potential entry or exit points.
Trend Analysis
Examining past price trends helps you identify whether a currency pair is in an uptrend, downtrend, or range. Trends often persist until there is a clear reversal pattern, which guides traders in determining their positions.
Sentiment Analysis
Another indicator is the sentiment analysis. Charts can reflect market sentiment. For example, a long span of indecision might indicate uncertainty, while a strong trend may signify confidence in a particular direction.
Basic Concepts
Support and resistance are critical concepts in Forex chart analysis. They represent the price levels at which a currency pair tends to stop or reverse its direction. Traders use these levels to make informed decisions about entering or exiting trades. Here's a breakdown of both concepts:
Support
Support is a price level where a currency pair tends to find buying interest, preventing it from falling further. Traders believe that when the price approaches a support level, there's a higher chance that it may bounce back upwards.
Support levels are often linked with historical price lows or areas where buying pressure has previously been strong. It acts as the floor.
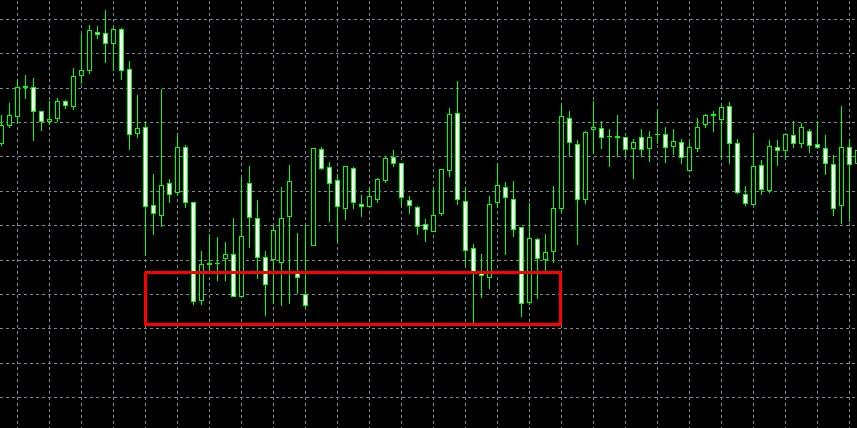
Support zone
Resistance
Resistance is a price level where a currency pair tends to encounter selling interest, preventing it from going up further. It acts as a ceiling for the price.Traders expect that when the price nears a resistance level, it may struggle to break through and might go back downward.
Resistance levels are usually associated with historical price highs or areas with significant selling pressure. In Forex trading, "risk" and "reward" refer to a trade's potential gains and losses. These concepts are crucial for managing your positions effectively and making informed decisions.
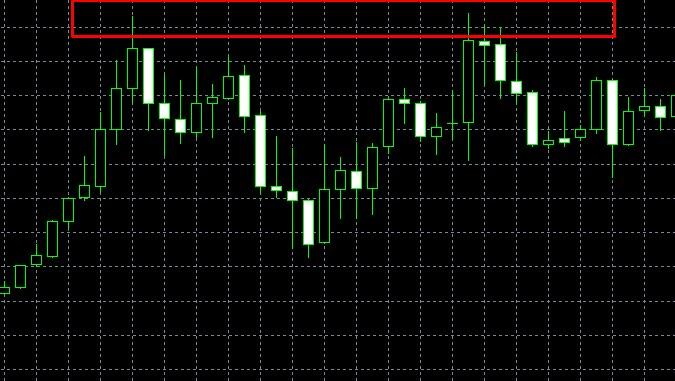
Resistance zone
Risk
Risk refers to the potential loss that you may incur if a trade goes against your expectations. It is usually presented as a percentage of the trading account balance. Risk is determined by factors like the position size (lot size), the distance between the entry point and the stop-loss level (stop-loss distance), and the volatility of the currency pair that is traded.
You can use stop-loss orders to reduce potential losses. A stop-loss order can be placed at a predetermined price level where the trade will be automatically closed to prevent any more losses.
Reward
Reward refers to the potential profit you can earn if a trade moves in the expected direction. It is also expressed as a percentage of the trading account balance. The distance between the entry point and the take-profit level determines the reward.
You can use take-profit orders to lock in profits. A take-profit order is placed at a predetermined price level where the trade will be automatically closed to secure gains. The relationship between risk and reward is a critical aspect of Forex trading and is often noted as the risk-to-reward ratio. It measures how much money a trader can earn by risking on a particular investment. It helps you understand the size of risk you are taking and the return you will get. It will let you decide whether you should put your money in that particular investment or not. Ideally, the ratio would be decided by the investors according to the risk appetite. However, as per the professionals, the risk-to-reward ratio might be 1:3.
How to use Patterns?
Using patterns when analyzing Forex charts is a common technique in technical analysis. Patterns are visual examples of historical price movements and can provide insights into potential future price directions. Here are steps on how to use patterns in your Forex chart analysis:
Identify Common Patterns
Each pattern has specific characteristics that you can look for in price charts. Familiarize yourself with common chart patterns, including:
-
Candlestick Patterns: Examples include Doji, Hammer, Engulfing patterns, and more
-
Chart Patterns: Head and shoulders, double tops and bottoms, triangles, flags, and pennants
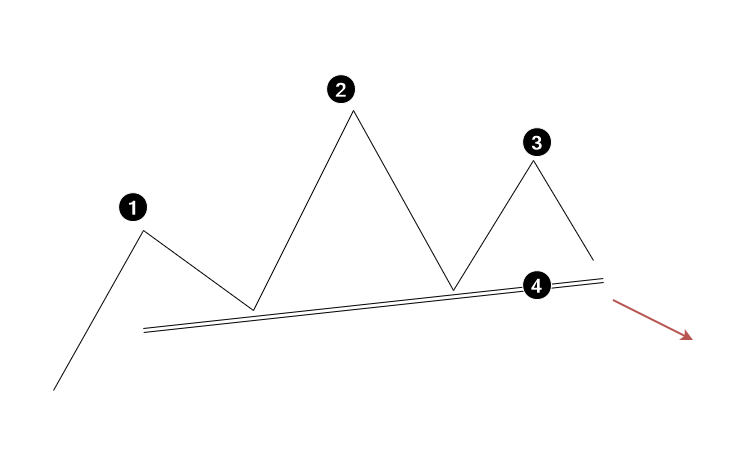
Head and shoulders chart pattern
Set Entry and Exit Points
Once you've identified a pattern and are confident in its validity, determine entry and exit points for your trade. You have to set your own entry and exit point as per your experiences. But make sure that you plan in advance so that you don’t have to panic during the market hours. Exit points can be set using take-profit and stop-loss orders.
Risk Management
It would be best if you consistently implemented proper risk management techniques. Set stop-loss orders to decrease potential losses if the pattern fails to play out as you expected it.
How to Use Indicators When Analyzing Charts?
Using indicators when analyzing charts in trading is a must practice to gain insights into price movements. Here are the basic steps to follow:
-
Select the Right Indicator
-
Apply the Indicators to Your Chart
-
Understand Indicator Signals
-
Combine Indicators and Price Analysis
-
Avoid Overloading Your Chart
-
Backtest Your Strategy
-
Set Entry and Exit Criteria
-
Implement Risk Management
-
Stay Informed
-
Practice and Monitor
You must remember that indicators are tools to assist your analysis but are not infallible. No single indicator guarantees success in trading. Combining technical analysis with risk management and a foolproof trading plan is critical to effective trading using indicators.
11 Steps on how to analyze charts
Here's a detailed guide for you to analyze Аorex charts:
1 Choose a Forex Pair and Timeframe
Choose the currency pair you want to analyze, such as EUR/USD or GBP/JPY.
Select a timeframe that matches your trading strategy, such as daily, hourly, or even shorter timeframes for scalping.
2 Understand Chart Types
You need an understanding of chart types to be able to analyze them. Familiarize yourself with different charts, including line, bar, and candlestick charts. Candlestick charts are the most popular for their detailed information. Chart is a true representation of information in the market based on which you can decide on your trading strategy.
3 Determine the trend, or lack thereof
In both uptrends and downtrends, there can be temporary price movements that go against the overall trend, potentially causing confusion among traders. In an uptrend, these are temporary price drops, and in a downtrend, these are temporary price increases. Determining the overall trend of the currency pair will always help in crafting a trading strategy.
Trends can be:
Uptrend: Higher highs and higher lows.
Downtrend: Lower highs and lower lows.
4 Identify Support and Resistance Levels
Identify the chart's critical support (price floors) and resistance (price ceilings) levels. These levels can help you spot potential reversal points or areas where the price may stall.
5 Apply Technical Indicators
Now, it's time to overlay the chart's technical indicators for additional insights. You must use indicators to confirm or contradict your trend analysis and identify potential entry and exit points.
6 Check out Chart Patterns
Identify chart patterns like head and shoulders, double tops and bottoms, triangles, flags, and pennants.
These patterns can provide signals for potential reversals or continuations in price movements.
7 Analyze Candlestick Patterns
Pay attention to candlestick patterns, such as Doji, Hammer, and Engulfing patterns. These patterns can indicate shifts in market sentiment.
8 Use Multiple Timeframes
Check multiple timeframes to get a broader perspective. For instance, if trading on a daily chart, look at the weekly and hourly charts to confirm your analysis.
9 Correlate Fundamental Analysis
Consider fundamental factors like economic data, geopolitical events, and central bank policies that can impact currency prices. Fundamental analysis complements technical analysis.
10 Set Entry and Exit Points
Based on your analysis, determine specific entry points for trades. This might involve waiting for a particular level of price or a confirmation from technical indicators.
Set stop-loss and take-profit orders to balance risk and secure profits. These levels should be based on your analysis and risk tolerance.
11 Practice and Continuously Learn
Practice analyzing Forex charts regularly, both on historical data and in real-time on demo accounts. Always be updated on market news and events that can influence currency prices.
You must not forget that Forex trading carries risks, and no analysis method can guarantee success. Risk management is crucial.
Best Forex brokers 2024


FAQs
What is the best time frame to analyze a Forex chart?
The time frame you select to analyze a Forex chart depends on your trading style, goals, and the strategies you use. Forex charts are available in various timeframes, each with advantages and disadvantages. A new candle appears every 4 hours a day where signals appear very rarely, meanwhile you can track other different markets to get an idea of trends.
How long does it take to learn how to analyze Forex charts?
It all depends on how much time you spend in learning and demo practicing. There are various online courses available for training purposes and making you understand the basic concepts. You can learn Forex exchange basics within 2-3 months. To become a successful trader, you need to practice for a longer period of time.
What are the different types of Forex charts?
The main types of Forex charts are line, bar, and candlestick. Traders widely use candlestick charts due to their ability to convey more information.
What is technical analysis in Forex chart analysis?
Technical analysis analyzes Forex charts using various technical indicators and patterns to tell future price movements. It focuses on historical price and volume data.
Glossary for novice traders
-
1
Index
Index in trading is the measure of the performance of a group of stocks, which can include the assets and securities in it.
-
2
Take-Profit
Take-Profit order is a type of trading order that instructs a broker to close a position once the market reaches a specified profit level.
-
3
Fundamental Analysis
Fundamental analysis is a method or tool that investors use that seeks to determine the intrinsic value of a security by examining economic and financial factors. It considers macroeconomic factors such as the state of the economy and industry conditions.
-
4
Options trading
Options trading is a financial derivative strategy that involves the buying and selling of options contracts, which give traders the right (but not the obligation) to buy or sell an underlying asset at a specified price, known as the strike price, before or on a predetermined expiration date. There are two main types of options: call options, which allow the holder to buy the underlying asset, and put options, which allow the holder to sell the underlying asset.
-
5
Risk Management
Risk management is a risk management model that involves controlling potential losses while maximizing profits. The main risk management tools are stop loss, take profit, calculation of position volume taking into account leverage and pip value.
Related Articles


Team that worked on the article

Upendra Goswami is a full-time digital content creator, marketer, and active investor. As a creator, he loves writing about online trading, blockchain, cryptocurrency, and stock trading.

Dr. BJ Johnson is a PhD in English Language and an editor with over 15 years of experience. He earned his degree in English Language in the U.S and the UK. In 2020, Dr. Johnson joined the Traders Union team. Since then, he has created over 100 exclusive articles and edited over 300 articles of other authors.

Mirjan Hipolito is a journalist and news editor at Traders Union. She is an expert crypto writer with five years of experience in the financial markets. Her specialties are daily market news, price predictions, and Initial Coin Offerings (ICO).
