4 Swing Trading Strategies to Trade on the 4 Hour Timeframe


Editorial Note: While we adhere to strict Editorial Integrity, this post may contain references to products from our partners. Here's an explanation for How We Make Money. None of the data and information on this webpage constitutes investment advice according to our Disclaimer.
Pros of 4-hour trading:
- Smoothes out the noise of lower timeframes
- Requires only a few daily check-ins for managing swing positions
- Trades held from days to weeks allow for bigger profit targets
- Less emotional stress
Cons of 4-hour trading:
- Lower frequency of trading opportunities
- Requires wider stops due to the larger timeframe, leading to a potentially bigger loss per trade
- Trades held from days to weeks allow for bigger profit targets
Trading the financial markets involves decisions on which timeframes to analyze and execute trades. While day traders concentrate on minutes and hourly charts, swing traders favor larger timeframes like 4 hours or daily. This article specifically explores the pros and cons of trading in the 4-hour timeframe.
The 4-hour timeframe, as the name suggests, organizes price data into 4-hour blocks. Strategies designed for the 4-hour charts aim to capture moves lasting from a few days to several weeks, making it ideal for swing trading.
Forex 4 hour time frame
The 4-hour time frame in Forex trading stands out with unique features that distinguish it from other time frames:
Six 4-hour Candles in a Day:
Each day in the 4-hour time frame is represented by the formation of six individual 4-hour candles
These candles capture price movements and fluctuations within four hours throughout the day
Divining a day into six candles gives traders a more granular view of price changes, allowing for a detailed analysis of market dynamics
4 Hours as Half a Working Day:
The 4-hour time frame is significant as it encapsulates half of a typical working day
For traders who follow this time frame, it offers a balanced and manageable approach to monitoring market conditions
This division aligns with breaking down the trading day into smaller, more digestible segments, making it well-suited for those with other professional or personal commitments
The 4-hour time frame provides traders with a comprehensive snapshot of market movements throughout the day. Please refer to this article, What Is The Best Time Frame To Trade Forex For Beginners? to know more about the time frame.
4 hour candle close times
The structure of a 4-hour candlestick incorporates data from various trading sessions, providing insights into market activity during distinct time intervals.
UTC Close Times:
02:00
06:00
10:00
14:00
18:00
22:00
The 4-hour candlestick is unique in that it encapsulates data from multiple trading sessions, reflecting the dynamic nature of the forex market. The breakdown typically follows the progression of major global trading sessions: Asia, Europe, North America, and back to Asia.
 4-hour timeframe specifically covers different trading sessions: Asia, Europe, America
Thus, 6 candles are formed on the 4-hour chart per day:
Candle 1: Asian markets are starting to open, including Japan and Australia. This period is often characterized by low volatility due to the closure of major markets. Trading may be less active at this time, but important news or economic events from the previous trading day may influence price movements
Candle 2: The major Asian markets are in full swing. Activity begins to increase as markets open in countries such as China and Singapore. This time often brings the first significant price movements of the day, especially if economic data has been released in Asia
Candle 3: European markets are open and Asian markets are starting to close. Volatility may increase during this period due to the overlap between Asian and European trading sessions. The opening of European markets brings new entrants and possible changes in trends
Candle 4: European markets are still open, US markets are starting to work. Period of high volatility due to joint activity of European and American markets. Important news and economic reports from Europe and the US may cause significant price fluctuations
Candle 5: The US market is at the peak of activity, European markets are closing. The US session continues to be active in the markets. US Federal Reserve decisions, corporate earnings reports and other key news from the US could have a significant impact on the markets
Candle 6: The U.S. market is beginning to slow down, preparing for the close of the day. A period of calm before the US session closes. Volatility may decrease, however, U.S. economic news released later in the day may cause price movement
Understanding the character profile for each 4-hour candle allows traders to contextualize price movements within specific timeframes and global trading sessions.
What are the best Forex brokers for swing trading?
When selecting the best Forex brokers for swing trading, it's essential to consider factors such as low overnight swap rates, access to advanced charting tools like TradingView, and the availability of a wide range of currency pairs. After comparing the conditions of three regulated brokers, we have identified the top options that offer favorable conditions for swing traders.
| Plus500 | OANDA | Trading.com USA | |
|---|---|---|---|
|
TradingView advanced charting |
Yes | Yes | Yes |
|
EUR/USD spread |
No | 0.15 | No |
|
Regulation |
CySEC, FCA, ASIC, FMA, FSCA, FSA Seychelles, EFSA, MAS, DFSA, SCB | FSC (BVI), ASIC, IIROC, FCA, CFTC, NFA | CFTC, NFA |
|
Supported urrency pairs |
60 | 68 | 69 |
|
Low swap rates |
Yes | Yes | Yes |
|
Open account |
Go to broker 80% of retail CFD accounts lose money. |
Go to broker Your capital is at risk. |
Go to broker Your capital is at risk. |
What are 4 hour Forex trading strategies?
The 4-hour chart is well-suited for implementing effective swing trading strategies. Below are four strategies tailored for this timeframe:
False Breakout of a Psychological Level
Using Fundamentals
Bounce from Parallel Channel Line
Correction to Fibonacci Level
False Breakout of a Psychological Level
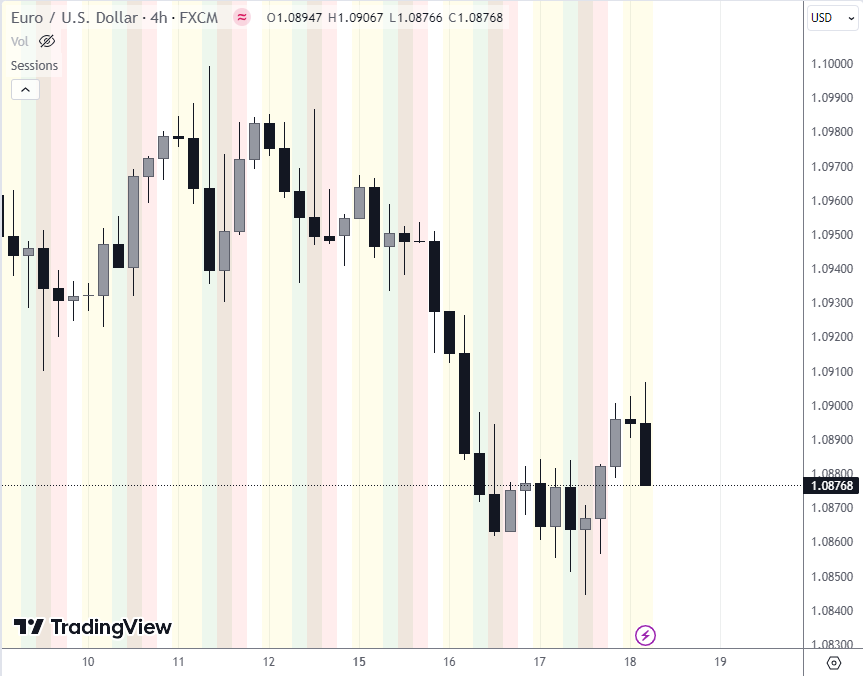
Enter a position when a 4-hour candle punctures a round level but closes on the other side. This approach capitalizes on false breakouts, where initial price movements breach a psychological level but fail to sustain the momentum.
- Pros
- Cons
- Exploits market inefficiencies during false breakouts
- Maybe just for beginner traders
- Based on psychology
- It requires precise timing and analysis to distinguish false breakouts from genuine market shifts
 False Breakout of a Psychological Level
The chart above shows 3 false breakouts: 2 for short entries, and 1 for long entries. The 4-hour chart can help to identify that the trend is weakening as we approach these levels to open a position after a false breakout.
A strategies based on fundamentals
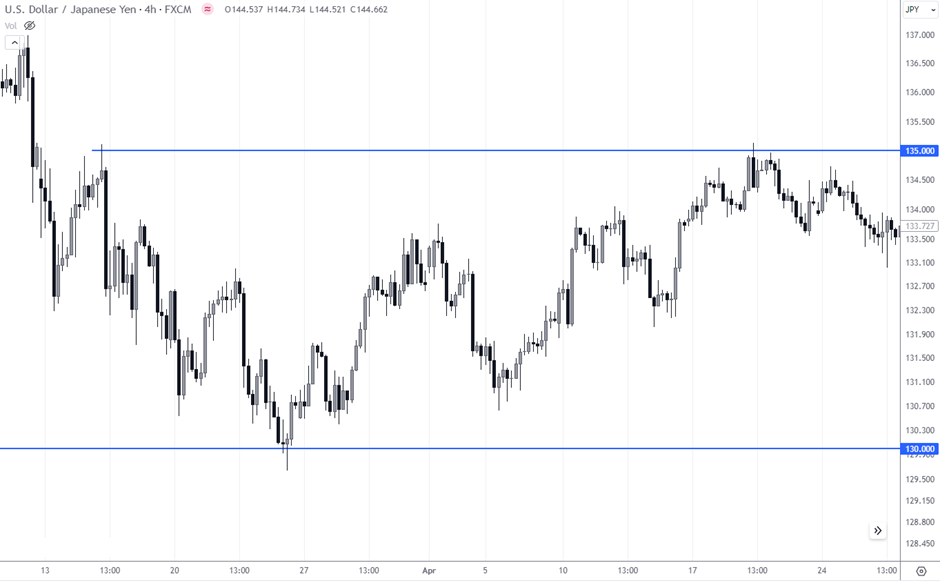
Base trading decisions on fundamental factors, such as interest rate differentials between major currencies. For instance, if the Federal Reserve maintains high-interest rates while the Bank of Japan keeps rates low, it could drive the USD/JPY market.
- Pros
- Cons
- Serves as a foundation for identifying sustainable trends
- Aligns with long-term market drivers influenced by economic indicators and central bank policies
- It requires a strong understanding of fundamental analysis, which may be challenging for some traders
Bounce from Parallel Channel Line
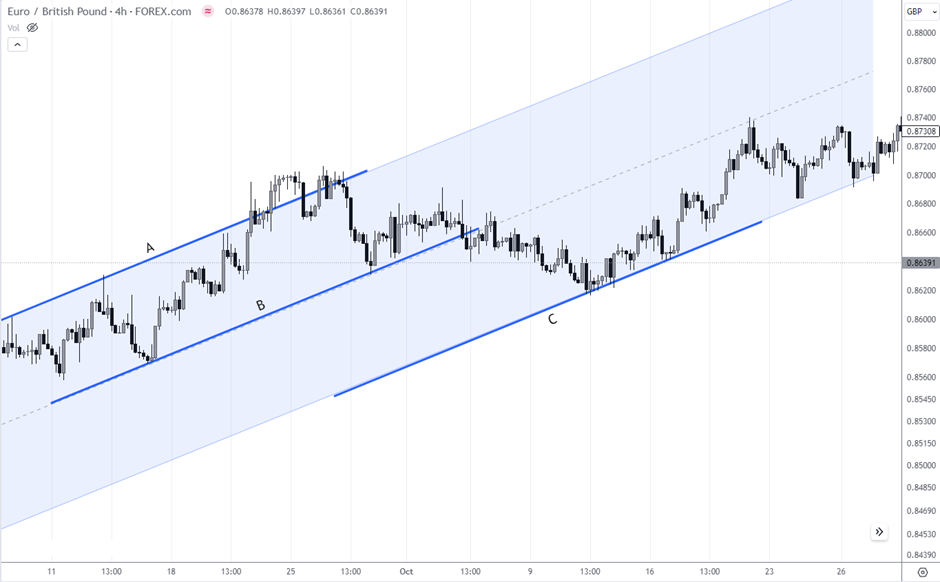
Construct parallel channels (A-B) on the 4-hour chart and enter the direction of the main trend after a correction to the C line. This strategy identifies potential reversal points within an established trend.
- Pros
- Cons
- Utilizes technical analysis to identify entry points based on channel patterns
- Offers a systematic approach to capturing trend reversals
- Relies on accurate trendline construction and interpretation
 Bounce from Parallel Channel Line
The picture above shows how on the 4 hour chart with the help of a parallel channel it was possible to find a long entry in the expectation of resumption of the uptrend.
Correction to Fibonacci Level
Use Fibonacci retracement levels on the 4-hour chart to identify potential reversal points after a correction. This strategy aims to capitalize on price movements that align with Fibonacci ratios.
- Pros
- Cons
- Integrates Fibonacci retracement, a widely used technical analysis tool
- Provides a systematic approach to identifying retracement levels for potential entries
- Requires a good understanding of Fibonacci retracement and its application
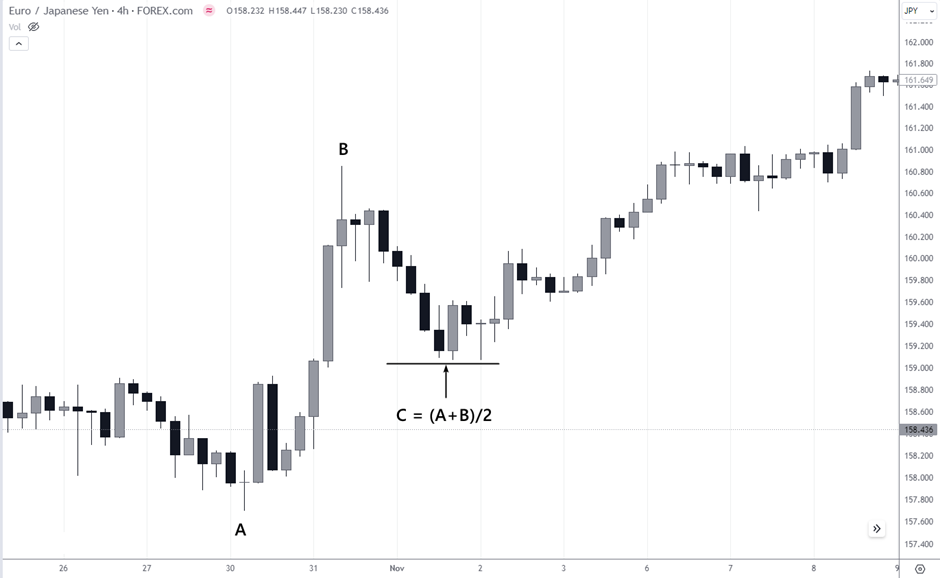 Correction to Fibonacci Level
These four swing trading strategies tailored for the 4-hour timeframe offer a diverse set of approaches, combining technical and fundamental analysis to capture opportunities within the dynamic forex market. Traders can read this article - Best strategies to swing trade in Forex to choose strategies based on their risk tolerance, expertise, and market outlook.
Why trade the 4-hour Forex chart?
- Pros
- Cons
- Smoothes out the noise of lower timeframes, facilitating more precise identification of trends and ranges
- Requires only a few daily check-ins for managing swing positions, making it less time-intensive than shorter timeframes
- Trades held from days to weeks allow for bigger profit targets
- Characterized by a low psychological burden. Low risk of overtrading
- Lower frequency of trading opportunities compared to smaller timeframes
- Requires wider stops due to the larger timeframe, leading to a potentially bigger loss per trade
- It is easy to miss entry points if you monitor the opening of each 4-hour candle
You can read this article to know Most Relevant Forex Time Frames And Chart Settings for better timeframe insights.
Tips for trading on the 4-hour timeframe
Basic tip - combine the main 4-hour chart with other timeframes. By evaluating the market from different perspectives, you can better understand its state, stages and the strength of current trends.
Additional tips:
Set Stop-Loss Orders: Protect your capital by placing strategic stop-loss orders
Adjust Position Sizes: Tailor your investments to your risk tolerance for better control
Stick to Your Plan: Follow your trading strategy diligently to avoid impulsive decisions
Practice Patience: Wait for quality setups; don't chase every market move
Follow the News: Stay updated on relevant news for well-informed decisions
4-hour timeframe requires a different mindset

In my trading practice, the 4-hour timeframe has proven to be a solid middle ground between constant screen-watching and being too detached from the market. I moved to it after years of working with lower timeframes and realizing that many losses were not caused by poor analysis, but by noise, overreaction, and unnecessary trade frequency.
What I value most about the 4-hour chart is the quality of signals. I don’t need to second-guess every minor fluctuation or react emotionally to short-term volatility. When a setup forms on this timeframe, it usually reflects a broader market intention rather than random price movement. This has helped me become more selective and patient, which in turn improved my consistency.
That said, the 4-hour timeframe requires a different mindset. Trades often remain open for days or even weeks, and that can be psychologically challenging at first. Wider stop-losses are part of the game, so position sizing becomes critical. Early on, I underestimated this and learned quickly that risk management matters more here than precise entries.
From a lifestyle perspective, the 4-hour approach suits traders who can’t or don’t want to monitor the market constantly. I typically review charts a few times a day, often around candle closes, rather than being glued to the screen. This structure brings clarity and discipline, especially for traders balancing trading with other professional commitments.
My recommendation is simple: if you find lower timeframes stressful, inconsistent, or overly demanding, the 4-hour timeframe is worth serious consideration. It’s not about trading more – it’s about trading better. When combined with proper risk control and patience, this timeframe can support a more sustainable and methodical trading approach over the long run.
Conclusion
Trading the 4-hour timeframe strikes a compelling balance between the noise of short-term charts and the slow signals of daily ones, making it a prime choice for swing traders aiming to capture meaningful trend shifts. As detailed in the article, this timeframe allows for actionable yet manageable trade setups—like identifying bullish reversals at support or riding breakouts with minimal stress. Beginners can employ straightforward strategies with clearly defined entries and stop-losses, effectively managing risk while learning the rhythms of market trends. Ultimately, the 4-hour chart empowers traders to seize bigger opportunities without being glued to their screens, proving that success comes not from constant action but from smart, timely decisions.
FAQs
What makes the 4-hour trading timeframe suitable for traders with full-time jobs or other commitments?
How do different global trading sessions impact price movement on the 4-hour chart?
Which key strategies are considered effective for trading on the 4-hour timeframe?
What are the primary psychological adjustments required when switching to 4-hour trading?
Editors' Top Picks and Insights

Lindsey Graham death: U.S. senator’s crypto legacy

Tether under pressure: USDT in Europe, audit questions, and the fight for trust

Lean Ethereum: Why Buterin wants to rebuild the network

SK Hynix debuts on Nasdaq: Largest U.S. offering by foreign company

SpaceX falls out of orbit: Does anyone still want Musk’s stock?

The crypto IPO problem: How high-profile listings became investor traps
Related Articles
Team that worked on the article
Upendra Goswami is a full-time digital content creator, marketer, and active investor. As a creator, he loves writing about online trading, blockchain, cryptocurrency, and stock trading.
Dan Blystone began his trading career in 1998 as an arbitrage clerk on the floor of the Chicago Mercantile Exchange (CME). He later traded bond and Eurex futures at proprietary firms such as Altea Trading, gaining valuable experience in high-frequency trading and risk management.
Chinmay Soni is a financial analyst with more than 5 years of experience in working with stocks, Forex, derivatives, and other assets. As a founder of a boutique research firm and an active researcher, he covers various industries and fields, providing insights backed by statistical data.
Index in trading is the measure of the performance of a group of stocks, which can include the assets and securities in it.
Cryptocurrency is a type of digital or virtual currency that relies on cryptography for security. Unlike traditional currencies issued by governments (fiat currencies), cryptocurrencies operate on decentralized networks, typically based on blockchain technology.
Volatility refers to the degree of variation or fluctuation in the price or value of a financial asset, such as stocks, bonds, or cryptocurrencies, over a period of time. Higher volatility indicates that an asset's price is experiencing more significant and rapid price swings, while lower volatility suggests relatively stable and gradual price movements.
Ethereum is a decentralized blockchain platform and cryptocurrency that was proposed by Vitalik Buterin in late 2013 and development began in early 2014. It was designed as a versatile platform for creating decentralized applications (DApps) and smart contracts.
An investor is an individual, who invests money in an asset with the expectation that its value would appreciate in the future. The asset can be anything, including a bond, debenture, mutual fund, equity, gold, silver, exchange-traded funds (ETFs), and real-estate property.

-
 Afghanistan
-
 Albania
-
 Algeria
-
 Angola
-
 Argentina
-
 Armenia
-
 Australia
-
 Austria
-
 Azerbaijan
-
 Bahamas
-
 Bahrain
-
 Bangladesh
-
 Belarus
-
 Belgium
-
 Bolivia
-
 Botswana
-
 Brazil
-
 Brunei
-
 Bulgaria
-
 Cambodia
-
 Cameroon
-
 Canada
-
 Chile
Chile
-
 China
China
-
 Colombia
-
 Congo
Congo
-
 Costa Rica
-
 Cote d'Ivoire
-
 Croatia
-
 Cuba
Cuba
-
 Cyprus
-
 Czechia
-
 DR Congo
-
 Denmark
-
 Dominican Republic
-
 Ecuador
-
 Egypt
Egypt
-
 El Salvador
-
 Estonia
-
 Eswatini
-
 Ethiopia
-
 Finland
-
 France
-
 Georgia
-
 Germany
-
 Ghana
Ghana
-
 Greece
-
 Haiti
Haiti
-
 Hong Kong
-
 Hungary
-
 India
India
-
 Indonesia
-
 Iran, Islamic republic
-
 Iraq
Iraq
-
 Ireland
-
 Israel
-
 Italy
Italy
-
 Jamaica
-
 Japan
Japan
-
 Jordan
-
 Kazakhstan
-
 Kenya
Kenya
-
 Korea
Korea
-
 Kuwait
-
 Kyrgyzstan
-
 Laos
Laos
-
 Latvia
-
 Lebanon
-
 Lesotho
-
 Libya
Libya
-
 Lithuania
-
 Luxembourg
-
 Madagascar
-
 Malaysia
-
 Malta
Malta
-
 Mauritius
-
 Mexico
-
 Moldova
-
 Mongolia
-
 Montenegro
-
 Morocco
-
 Mozambique
-
 Myanmar
-
 Namibia
-
 Nepal
Nepal
-
 Netherlands
-
 New Zealand
-
 Nigeria
-
 North Macedonia
-
 Norway
-
 Oman
Oman
-
 Pakistan
-
 Palestine
-
 Panama
-
 Papua New Guinea
-
 Paraguay
-
 Peru
Peru
-
 Philippines
-
 Poland
-
 Portugal
-
 Puerto Rico
-
 Qatar
Qatar
-
 Reunion
-
 Romania
-
 Rwanda
-
 Saudi Arabia
-
 Serbia
-
 Singapore
-
 Slovakia
-
 Slovenia
-
 Somalia
-
 South Africa
-
 Spain
Spain
-
 Sri Lanka
-
 Sweden
-
 Switzerland
-
 Syria
Syria
-
 Taiwan
-
 Tajikistan
-
 Tanzania
-
 Thailand
-
 Trinidad and Tobago
-
 Tunisia
-
 Turkey
-
 UAE
UAE
-
 Uganda
-
 Ukraine
-
 United Kingdom
-
United States
-
 Uruguay
-
 Uzbekistan
-
 Venezuela
-
 Vietnam
-
 Yemen
Yemen
-
 Zambia
-
 Zimbabwe
- Forex
- Crypto
