Top Swing Trading Indicators You Should Know


Editorial Note: While we adhere to strict Editorial Integrity, this post may contain references to products from our partners. Here's an explanation for How We Make Money. None of the data and information on this webpage constitutes investment advice according to our Disclaimer.
Best swing trading indicators:
Moving average (MA) — helps spot market trends by smoothing out price data.
Relative strength index (RSI) — measures price momentum to find overbought or oversold conditions.
MACD (Moving average convergence divergence) — identifies trend changes using moving averages.
Bollinger bands — shows price volatility by plotting standard deviations from a moving average.
Stochastic oscillator — detects potential reversals by comparing closing prices to historical price ranges.
Volume — tracks how often an asset is traded, indicating market activity.
Fibonacci retracement — highlights key support and resistance levels using Fibonacci ratios.
Swing trading indicators primarily act as confirmation tools for the overall trade setup. The choice of indicators used for a trading strategy can make or break your trading game. This is why the decision of which indicators to rely on is crucial.
In this review, the experts at TU discuss the key things to consider when selecting a technical indicator, seven of the best swing trading indicators, how to use those indicators, how to combine several indicators, and a lot more.
Best technical analysis indicators for swing trading
Swing trading involves capturing short- to medium-term price movements in the market. Successful traders rely on technical indicators to identify profitable entry and exit points. Here are essential technical analysis indicators for swing trading explained in detail:
Moving averages (MA)
Moving averages smooth out price data, helping traders identify the prevailing trend. Common types include simple moving averages (SMA) and exponential moving averages (EMA). A popular strategy is the golden cross (when the 50-day MA crosses above the 200-day MA) for bullish signals, and the death cross for bearish signals. Traders use moving averages to spot trend reversals and confirm trends before making trades.

Relative strength index (RSI)
The RSI measures the speed and magnitude of recent price changes to identify overbought or oversold conditions. It ranges from 0 to 100. Readings above 70 indicate an overbought market (potential sell signal), while readings below 30 suggest an oversold market (potential buy signal). Swing traders often use RSI divergences to anticipate market reversals.

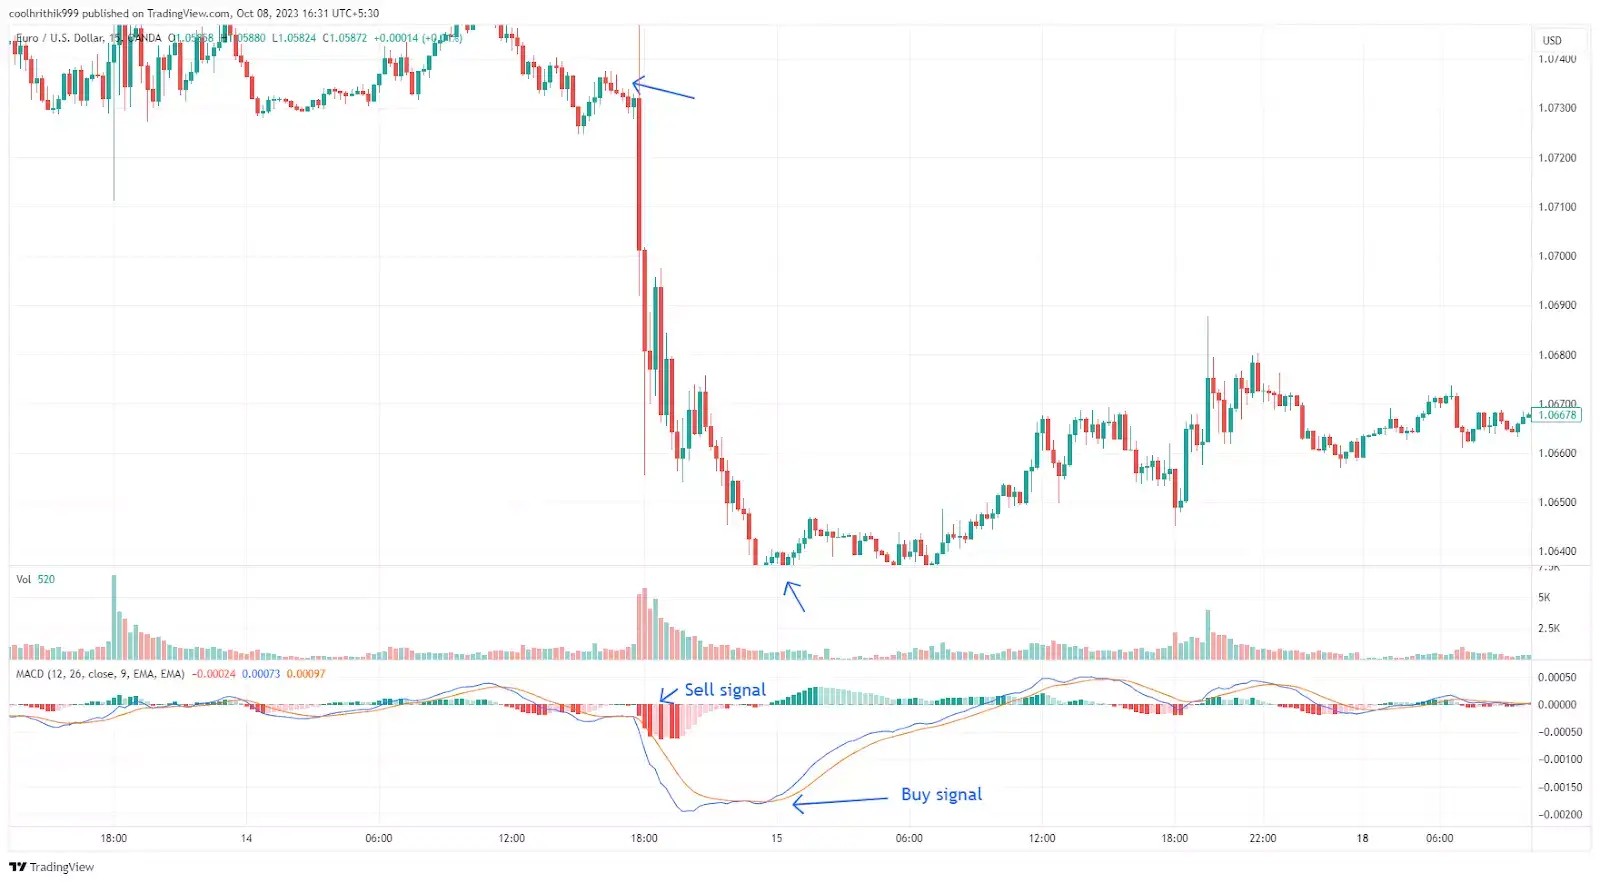
Moving average convergence divergence (MACD)
The MACD indicator reveals momentum changes by comparing two moving averages: the 12-day EMA and the 26-day EMA. The MACD line crossing above the signal line generates a buy signal, while crossing below triggers a sell signal. Traders also watch for MACD histogram peaks and troughs, which indicate strengthening or weakening trends.
Bollinger bands
Bollinger Bands consist of a middle band (typically a 20-day SMA) and two standard deviation bands above and below it. When prices touch the upper band, the asset is considered overbought; when they touch the lower band, it’s oversold. Traders use this indicator to spot potential reversals during volatile periods.

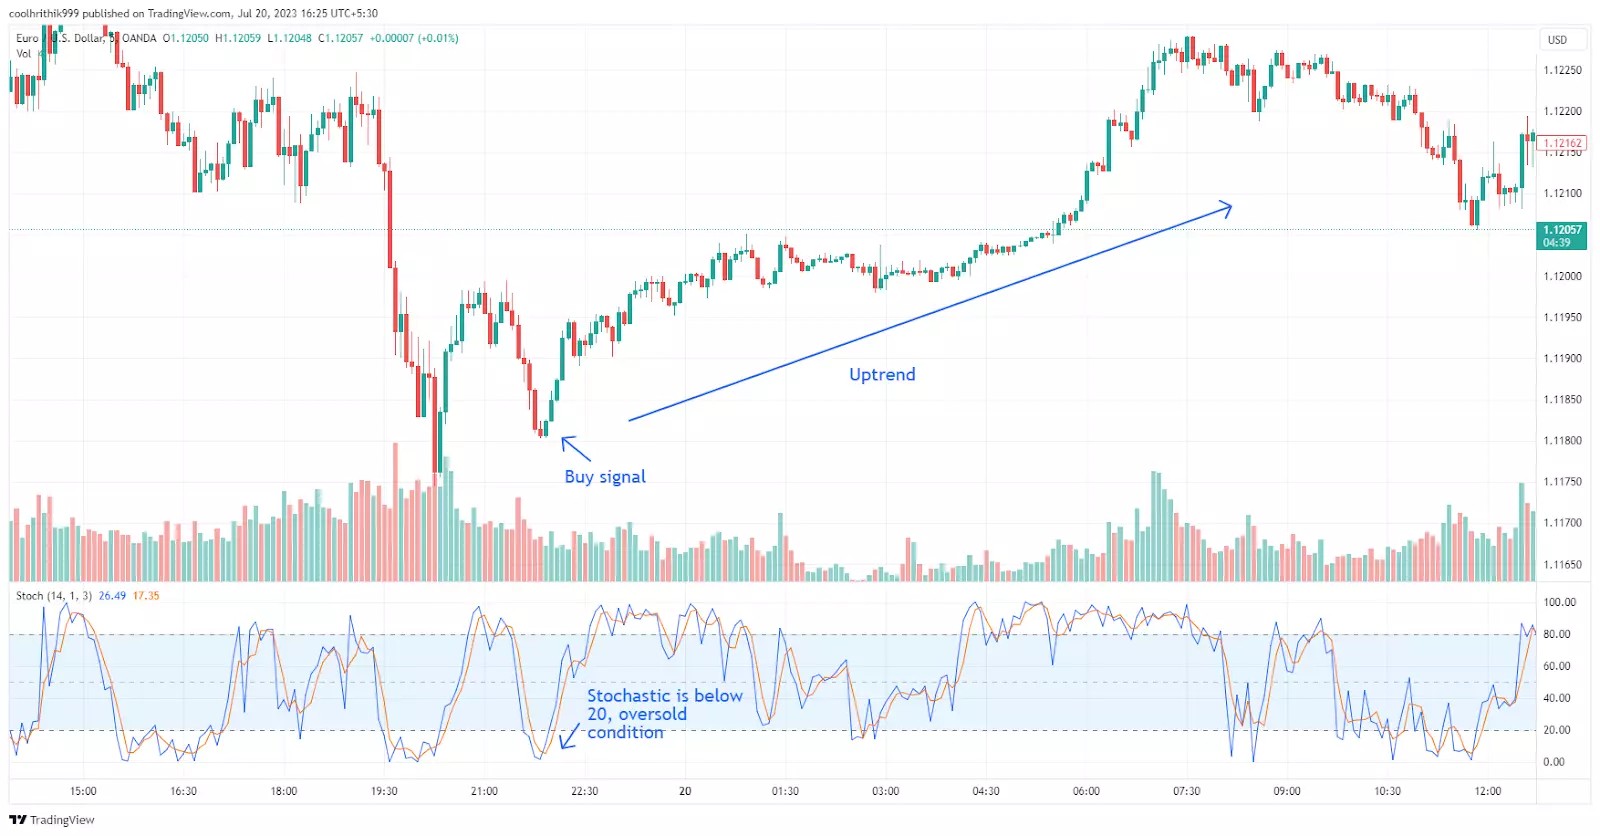
Stochastic oscillator
The stochastic oscillator measures price momentum by comparing a closing price to its price range over a specific period. It ranges from 0 to 100, with readings above 80 indicating overbought conditions and below 20 signaling oversold levels. Crossovers between the %K and %D lines offer buy and sell signals, making it valuable for timing entries and exits.
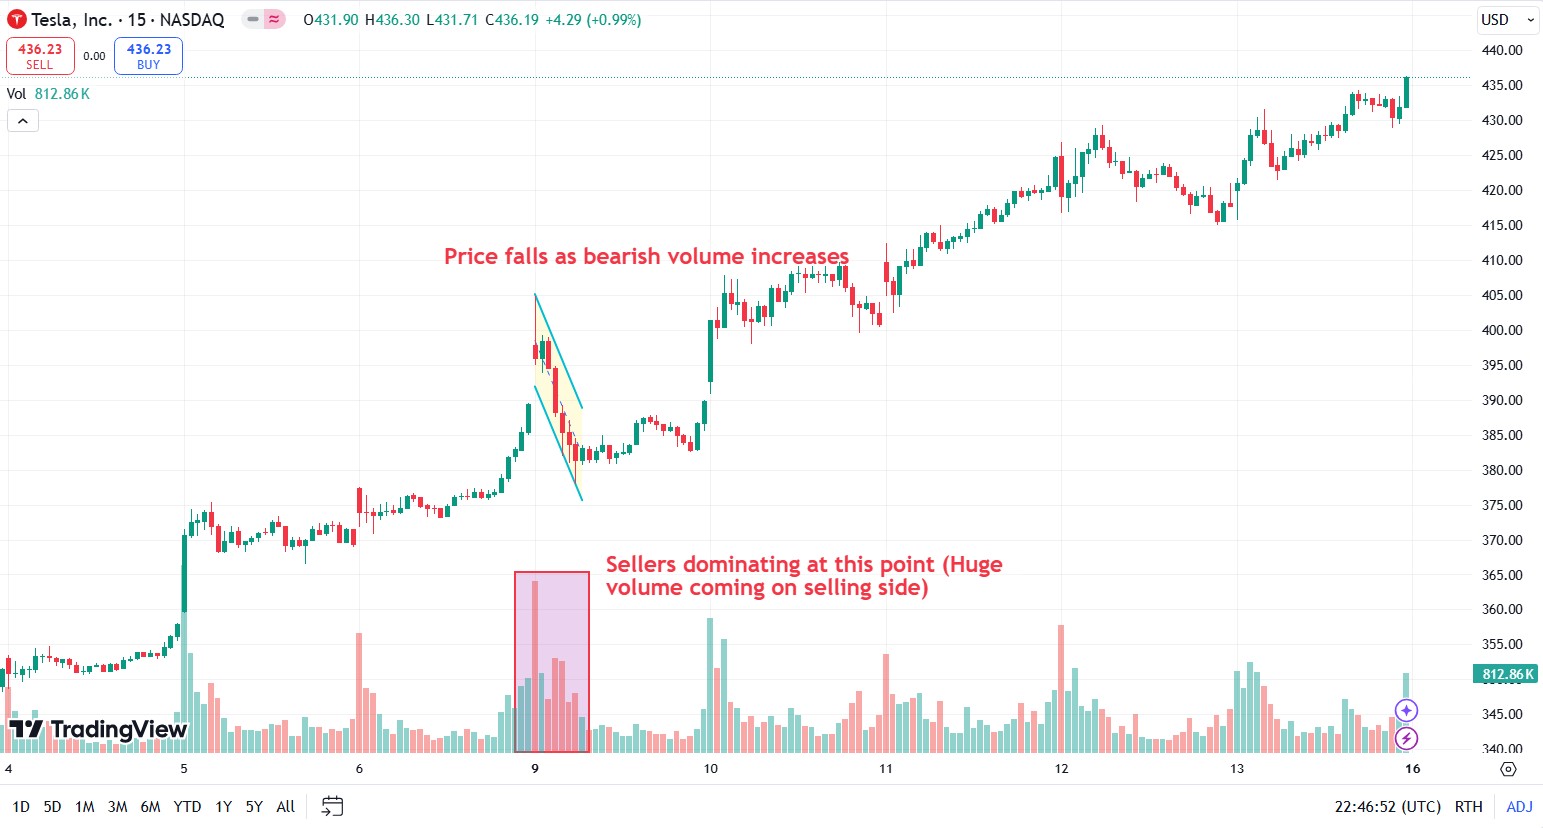
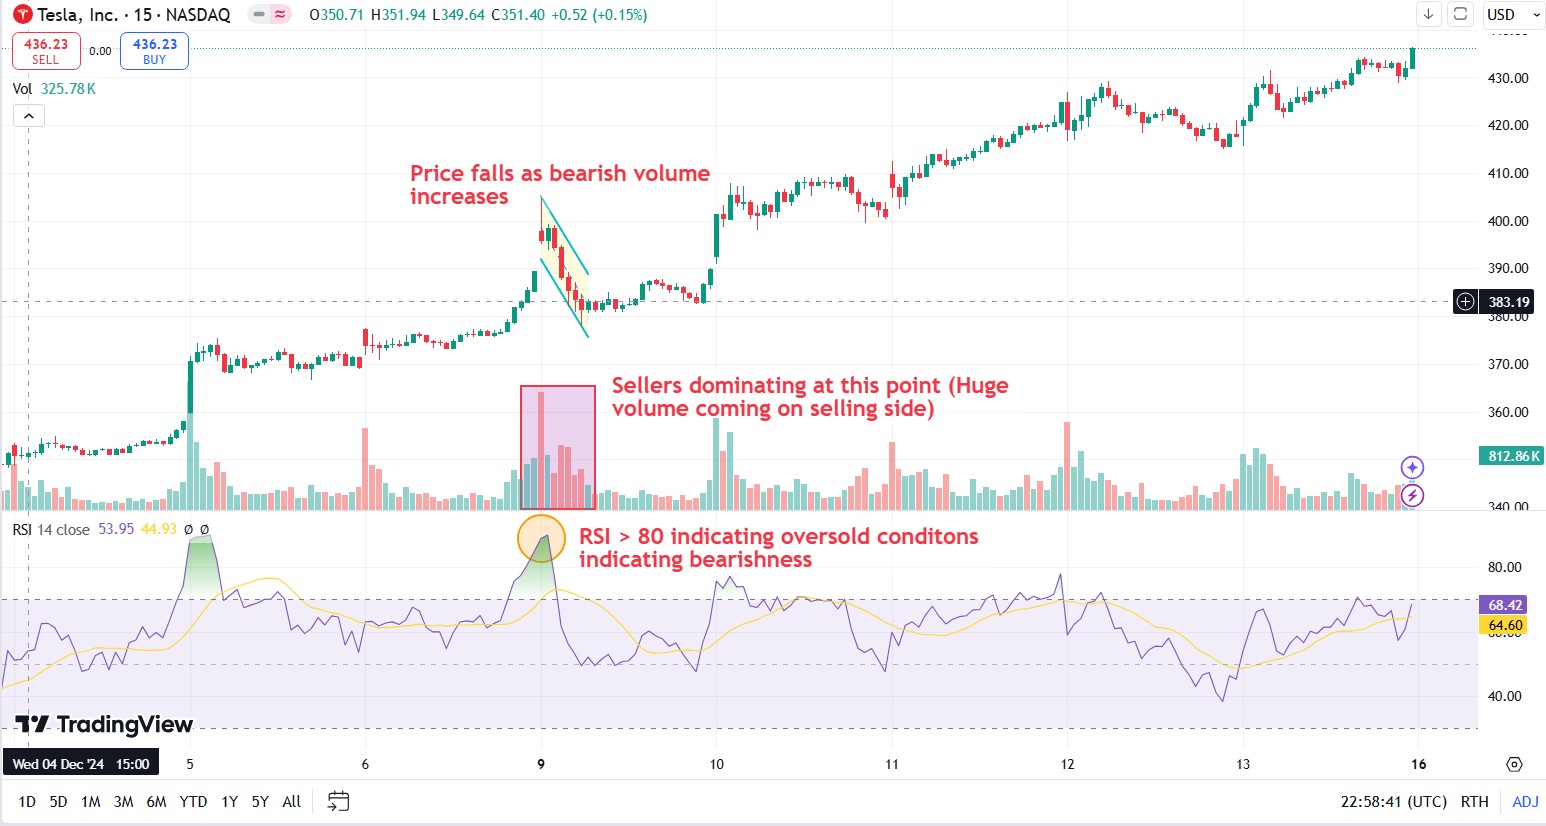
Volume
Trading volume reflects the number of shares or contracts traded within a specific timeframe. Higher volume during price increases suggests strong buying interest, while high volume during declines indicates intense selling pressure. Volume spikes often signal the beginning or end of major price moves. Analyzing volume patterns helps traders validate trends and avoid false signals.
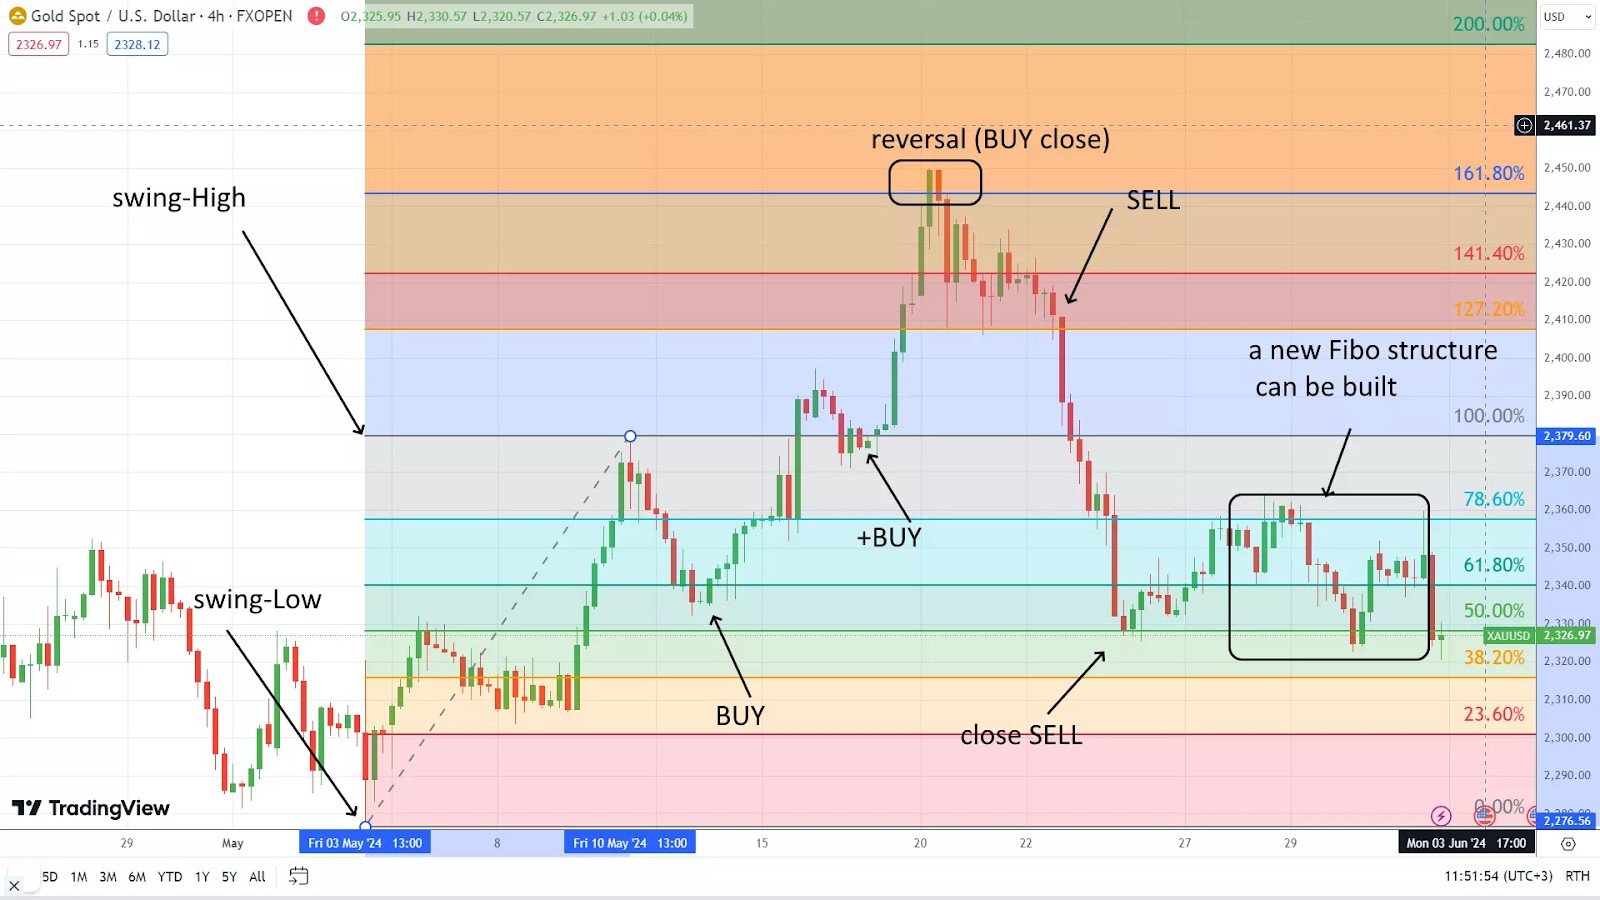
Fibonacci retracement
Fibonacci retracement uses key levels (such as 23.6%, 38.2%, 50%, 61.8%, and 78.6%) based on the Fibonacci sequence. Traders draw retracement lines between high and low points on a price chart to identify potential support and resistance zones. When prices retrace to these levels, traders watch for reversal signals to make well-timed trades.
To effectively use these indicators, having the right broker is essential. The brokers listed below provide advanced tools, competitive spreads, and robust platforms that can support swing trading strategies. Review their features to find the one that fits your trading needs best.
| Demo | Min. deposit, $ | Max. leverage | ECN | ECN Commission | Investor protection | Open an account | |
|---|---|---|---|---|---|---|---|
| Yes | 10 | 1:1000 | Yes | 7 | No | Go to broker Your capital is at risk.
|
|
| Yes | No | 1:200 | Yes | 3.5 | £85,000 SGD 75,000 $500,000 | Go to broker Your capital is at risk. |
|
| Yes | 100 | 1:50 | Yes | 5 | £85,000 | Study review | |
| Yes | 5000 | 1:4 | Yes | 1.5 | $500,000 | Study review | |
| Yes | 1 | 1:200 | Yes | 2.3 | £85,000 €100,000 SGD 75,000 | Study review |
How to choose indicators for swing trading
There are dozens of technical indicators to choose from and none of them is a panacea for all trading conditions. The choice of indicators to be used depends highly on the trader’s strategy and style. According to experts, the following are the key things to consider when choosing indicators for your trading strategy:
The optimal number of indicators
Just as too many cooks spoil the broth, too many indicators spoil the trade signal. For every strategy, there is a sweet spot for the number and type of technical indicators to be used. As a general rule of thumb, experts suggest using anywhere between 1-4 technical indicators when looking for a trade signal. Any number beyond that can lead to confusing signals.
Time horizon
Some indicators are more suitable for shorter time horizons while others function better for medium-term horizons. It is essential to identify those indicators that fit best into your trade horizon. This can effectively improve the overall conviction of a trader.
Complexity
Indicators are based on some permutation and combination of mathematical equations using price and volume data. They can get as easy as a simple moving average and as complex as compound mathematical formulae.
It depends upon the trader to decide the level of complexity with which he is comfortable because the essence of using an indicator lies in understanding the logic behind the signals generated by it.
How to use the best swing trading indicators

Swing trading thrives on accurately predicting short- to medium-term price movements. To excel, traders rely on technical indicators that signal trends, momentum shifts, and potential reversals. Volume is a foundational indicator that reveals the intensity behind price moves. A surge in volume accompanying a price increase suggests strong buying interest, while high volume during a decline signals intense selling pressure.
Momentum-based indicators like the Relative Strength Index (RSI) and Moving Average Convergence Divergence (MACD) provide essential insights. RSI helps traders spot overbought or oversold conditions, offering cues on when to enter or exit trades. MACD highlights momentum changes through crossovers between the MACD and signal lines, signaling potential buy or sell points.
Advanced tools such as Bollinger Bands, the Stochastic Oscillator, and Fibonacci Retracement further refine trading strategies. Bollinger Bands indicate price volatility, with prices nearing the upper or lower bands hinting at possible reversals. The Stochastic Oscillator reveals shifts in momentum by comparing closing prices to historical ranges. Fibonacci Retracement identifies key support and resistance levels, helping traders set precise entry and exit targets. Combining these indicators empowers swing traders to navigate market dynamics with greater confidence and precision.
Can I match different indicators for swing trading?
Combining different technical indicators can enhance the effectiveness of swing trading strategies by providing a more comprehensive market analysis. Each indicator offers unique insights, and their combined use can help confirm trends and reduce the likelihood of false signals.
For instance, pairing a trend indicator like the Moving Average (MA) with a momentum indicator such as the Relative Strength Index (RSI) can be beneficial. The MA helps identify the overall market direction by smoothing out price data, while the RSI measures the speed and change of price movements to detect overbought or oversold conditions. When both indicators align — for example, an uptrend indicated by the MA and an RSI below 70 — it suggests a stronger potential for a successful trade.
Another effective combination involves using Bollinger Bands alongside the Stochastic Oscillator. Bollinger Bands assess price volatility and potential reversal points by plotting standard deviations around a moving average. The Stochastic Oscillator compares a security's closing price to its price range over a specific period, helping to identify potential reversals. When prices touch the lower Bollinger Band and the Stochastic Oscillator indicates oversold conditions, it may signal a buying opportunity.
It's crucial to avoid redundancy by not combining indicators that provide similar information, as this can lead to confusion and misinterpretation. Instead, select indicators from different categories — such as trend, momentum, and volatility — to gain a well-rounded view of the market. This approach enables traders to make more informed decisions and enhances the reliability of trading signals.
Choose indicators that align with your trading goals and style

In my experience, the key to successful swing trading lies in finding the right balance between simplicity and depth. Many traders, especially beginners, fall into the trap of using too many indicators, hoping that more data will lead to better decisions. Instead, focus on understanding a few key indicators thoroughly. For instance, pairing MACD with RSI offers insights into both momentum and strength, without overwhelming you with information.
Another often overlooked aspect is the importance of time horizon. If you’re trading in a volatile market, shorter-term indicators like stochastic oscillators might be more effective. For longer-term trends, tools like moving averages or Fibonacci retracements are indispensable. Match your indicator selection with how long you intend to hold your trades — this alignment can make all the difference.
Don’t underestimate the power of backtesting. Before committing to a trading setup, test your strategy using historical data. I’ve seen traders rush into live markets without fully testing their approach, only to incur losses that could’ve been avoided. Backtesting not only builds confidence but also helps refine your use of indicators for real-world scenarios.
Conclusion
Swing trading is a dynamic strategy that relies on the accurate interpretation of technical indicators. By using a balanced combination of tools like Moving Averages, RSI, MACD, Bollinger Bands, and Fibonacci Retracement, traders can improve their decision-making process. Remember to align indicators with your trading goals, test strategies before live trading, and adapt to changing market conditions. A well-rounded approach increases the probability of profitable trades and reduces market risks.
FAQs
What is the time horizon for swing trading?
Swing trades typically last from a few days to a few weeks, allowing traders to capture medium-term market movements.
What is riskier: swing trading, or day trading?
In relative terms, swing trading is less risky compared to day trading because volatility is smoothened out over a longer time horizon under swing trading.
What is the biggest risk in swing trading?
Swing trading positions are highly vulnerable to abrupt market movements. Moreover, holding positions overnight and through weekends is an additional risk that comes with this strategy.
Can I trade using only a single indicator?
Trading based on only a single indicator is possible but not advisable. The more confirmations you have, the better the chances of the trade being successful.
Editors' Top Picks and Insights

SK Hynix debuts on Nasdaq: Largest U.S. offering by foreign company

SpaceX falls out of orbit: Does anyone still want Musk’s stock?

The crypto IPO problem: How high-profile listings became investor traps

U.S. Bitcoin reserve: Trump’s unrealized crypto promise

Aiming for leadership: Payment giants prepare a new stablecoin

Proof of Reserves: the new standard for cryptocurrency exchanges
Related Articles
Team that worked on the article
Alamin Morshed is a contributor at Traders Union. He specializes in writing articles for businesses that want to improve their Google search rankings to compete with their competition.
Chinmay Soni is a financial analyst with more than 5 years of experience in working with stocks, Forex, derivatives, and other assets. As a founder of a boutique research firm and an active researcher, he covers various industries and fields, providing insights backed by statistical data.
Mirjan Hipolito is a journalist and news editor at Traders Union. She is an expert crypto writer with five years of experience in the financial markets.
Backtesting is the process of testing a trading strategy on historical data. It allows you to evaluate the strategy's performance in the past and identify its potential risks and benefits.
Forex indicators are tools used by traders to analyze market data, often based on technical and/or fundamental factors, to make informed trading decisions.
Day trading involves buying and selling financial assets within the same trading day, with the goal of profiting from short-term price fluctuations, and positions are typically not held overnight.
The Stochastic Oscillator is a technical indicator used in financial analysis to gauge the momentum of a security's price and identify overbought or oversold conditions by comparing the closing price to a specified price range over a defined period.
Index in trading is the measure of the performance of a group of stocks, which can include the assets and securities in it.

-
 Afghanistan
-
 Albania
-
 Algeria
-
 Angola
-
 Argentina
-
 Armenia
-
 Australia
-
 Austria
-
 Azerbaijan
-
 Bahamas
-
 Bahrain
-
 Bangladesh
-
 Belarus
-
 Belgium
-
 Bolivia
-
 Botswana
-
 Brazil
-
 Brunei
-
 Bulgaria
-
 Cambodia
-
 Cameroon
-
 Canada
-
 Chile
Chile
-
 China
China
-
 Colombia
-
 Congo
Congo
-
 Costa Rica
-
 Cote d'Ivoire
-
 Croatia
-
 Cuba
Cuba
-
 Cyprus
-
 Czechia
-
 DR Congo
-
 Denmark
-
 Dominican Republic
-
 Ecuador
-
 Egypt
Egypt
-
 El Salvador
-
 Estonia
-
 Eswatini
-
 Ethiopia
-
 Finland
-
 France
-
 Georgia
-
 Germany
-
 Ghana
Ghana
-
 Greece
-
 Haiti
Haiti
-
 Hong Kong
-
 Hungary
-
 India
India
-
 Indonesia
-
 Iran, Islamic republic
-
 Iraq
Iraq
-
 Ireland
-
 Israel
-
 Italy
Italy
-
 Jamaica
-
 Japan
Japan
-
 Jordan
-
 Kazakhstan
-
 Kenya
Kenya
-
 Korea
Korea
-
 Kuwait
-
 Kyrgyzstan
-
 Laos
Laos
-
 Latvia
-
 Lebanon
-
 Lesotho
-
 Libya
Libya
-
 Lithuania
-
 Luxembourg
-
 Madagascar
-
 Malaysia
-
 Malta
Malta
-
 Mauritius
-
 Mexico
-
 Moldova
-
 Mongolia
-
 Montenegro
-
 Morocco
-
 Mozambique
-
 Myanmar
-
 Namibia
-
 Nepal
Nepal
-
 Netherlands
-
 New Zealand
-
 Nigeria
-
 North Macedonia
-
 Norway
-
 Oman
Oman
-
 Pakistan
-
 Palestine
-
 Panama
-
 Papua New Guinea
-
 Paraguay
-
 Peru
Peru
-
 Philippines
-
 Poland
-
 Portugal
-
 Puerto Rico
-
 Qatar
Qatar
-
 Reunion
-
 Romania
-
 Rwanda
-
 Saudi Arabia
-
 Serbia
-
 Singapore
-
 Slovakia
-
 Slovenia
-
 Somalia
-
 South Africa
-
 Spain
Spain
-
 Sri Lanka
-
 Sweden
-
 Switzerland
-
 Syria
Syria
-
 Taiwan
-
 Tajikistan
-
 Tanzania
-
 Thailand
-
 Trinidad and Tobago
-
 Tunisia
-
 Turkey
-
 UAE
UAE
-
 Uganda
-
 Ukraine
-
 United Kingdom
-
United States
-
 Uruguay
-
 Uzbekistan
-
 Venezuela
-
 Vietnam
-
 Yemen
Yemen
-
 Zambia
-
 Zimbabwe
- Forex
- Crypto
