Which is the Most Effective Indicator?

To determine the most effective indicator, you can use the ISR (Indicator Success Rate) calculator. Simply select the trading pair, indicator, candle interval, and number of candles to analyze to compare the available options and judge their success rate.
From the widely recognized Relative Strength Index (RSI) to the trend-following Exponential Moving Average (EMA), traders constantly grapple with the question: Which indicator reigns supreme? The truth is, there's no single "holy grail" indicator. Each offers unique strengths and weaknesses, and the most effective choice hinges on factors like your trading style, market conditions, and risk tolerance. Let's delve into the functionalities of some popular indicators and explore how to strategically leverage them to enhance your trading decisions.
-
How to determine the effectiveness of indicators?
The effectiveness of indicators can be determined by analyzing their ability to accurately predict price movements, confirm trends, and generate profitable trading signals.
-
What is the success rate, and why does it matter?
The success rate refers to the proportion of profitable trades relative to the total number of trades executed. It matters because it provides insight into the reliability and profitability of a trading strategy or indicator.
-
What is an ISR Calculator?
An ISR Calculator is a specialized tool used by traders to evaluate the performance and success rates of technical indicators for various trading pairs and timeframes. It helps traders analyze the effectiveness of indicators and identify the most suitable ones for their trading strategies.
-
What are the main mistakes when using indicators?
The main mistakes when using indicators include over-reliance on a single indicator, ignoring market context, failing to adjust parameters for different market conditions, and neglecting to backtest trading strategies for validation.
How to determine the most effective indicator?
Determining the most effective indicator can be facilitated through the use of a specialized tool known as the ISR Calculator. This tool is specifically crafted to aid traders in assessing the performance and success rates of technical indicators across various trading pairs and timeframes. By entering relevant data into the ISR Calculator, traders can scrutinize the effectiveness of different Forex indicators in guiding their trading decisions. This tool streamlines the process of evaluating indicators, enabling traders to pinpoint the most suitable ones for their trading strategies.
To determine the most effective indicator:
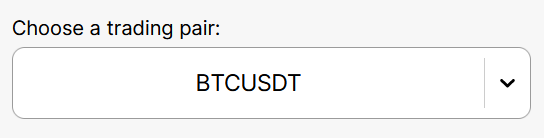
Selecting a trading pair is the first step in utilizing the ISR Calculator. Traders have the option to choose from a diverse range of cryptocurrency markets and Forex trading charts available for analysis. Currently, market data is sourced from the Binance API, with plans to incorporate data from additional exchanges in the future.
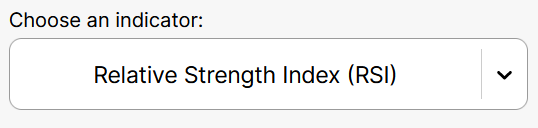
Next, traders need to pick the specific indicator they wish to analyze. The ISR Calculator supports various Forex indicators including the Relative Strength Index (RSI), Simple Moving Average (SMA), Exponential Moving Average (EMA), and On-Balance Volume (OBV).
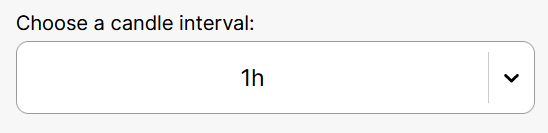
Choosing the candle interval is another crucial aspect of utilizing the ISR Calculator. Traders can select the timeframe for the candle analysis, ranging from as short as 1 minute (1m) to as long as 1 day (1D).
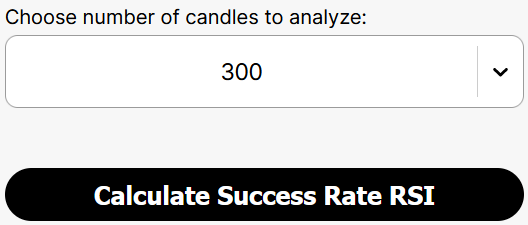
Finally, select the number of candles you wish to analyze and click on the “Calculate Success Rate” button to get your results.
Best Forex brokers


Which is the most effective indicator? Practical experience
Relative Strength Index (RSI)
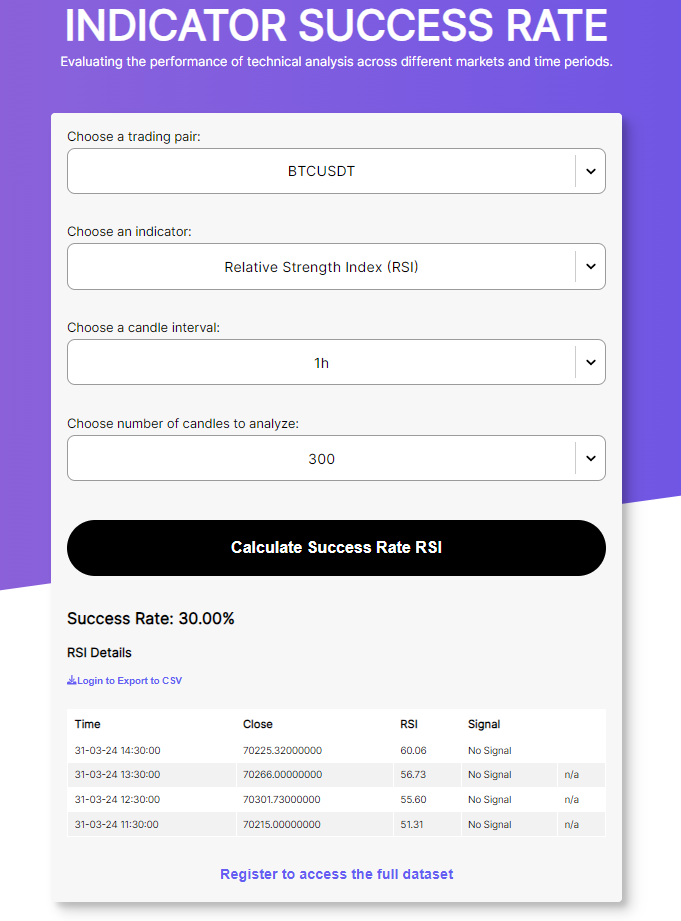
The Relative Strength Index (RSI) is a popular technical momentum indicator utilized by traders to assess the pace and extent of recent price changes in an asset. Developed by J. Welles Wilder Jr., the RSI operates within a scale ranging from zero to 100. Values surpassing 70 signify overbought conditions, while those falling below 30 indicate oversold conditions. Traders use the RSI to pinpoint potential buy and sell signals based on prevailing market trends. Additionally, it aids in predicting price movements, confirming trend reversals, and identifying disparities between the RSI and asset prices. The RSI formula involves averaging gains and losses over a specific period, typically 14 days, enabling traders to interpret RSI values and patterns to make informed decisions on market entry and exit, thus enhancing their trading strategies.
Upon utilizing the ISR calculator on BTC/USD, several notable outcomes were observed. Firstly, a 30% Win Rate was identified, indicating a relatively low performance level. Ideally, traders seek strategies with win rates closer to or exceeding 50% for more favorable outcomes. Moreover, considering other factors, relying solely on RSI might not suffice for BTC/USD trading. It is advisable to explore integrating RSI with other technical indicators such as moving averages or support/resistance levels to generate more robust trading signals.
Furthermore, adjusting RSI parameters could potentially enhance effectiveness amid BTC/USD's volatility. While the standard RSI thresholds are set at 70 for overbought conditions and 30 for oversold conditions, experimenting with different levels might yield better results. Additionally, conducting backtesting is crucial to evaluating strategy performance across various market conditions.
Calculate Success Rate RSI
Simple Moving Average (SMA)
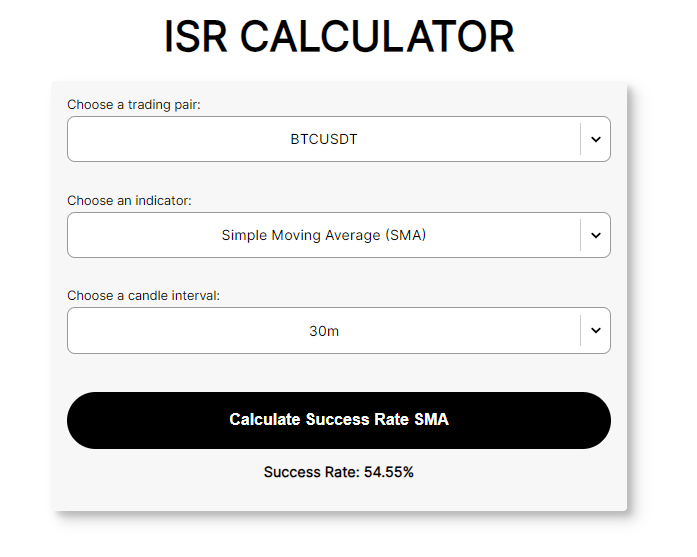
The Simple Moving Average (SMA) stands as a foundational tool in technical analysis, aiding traders in comprehending an asset's price trends over a specified period. Its methodology involves calculating the average price of the asset within a predetermined timeframe, with each data point given equal weight. Traders rely on SMAs to discern market trends, identify potential support and resistance levels, and pinpoint optimal entry and exit points for their trades. With origins tracing back centuries, the concept of SMA has been integral to financial analysis since the early 1900s. The computation of SMA entails summing up prices over a defined period and subsequently dividing by the number of data points. The direction of the moving average serves as a key interpretive factor; a rising SMA signifies a strengthening trend, while a declining SMA suggests a weakening trend.
The analysis by ISR on BTC/USD reveals a win rate of 54.55% on a 30-minute candle interval. To potentially increase the win rate of an SMA strategy, several strategies can be considered. Firstly, adjusting the time frame could be beneficial, as the 30-minute interval might be insufficient for the SMA indicator to yield optimal results. Extending the time frame to 1 hour, 4 hours, or even daily candles allows for a more comprehensive analysis. Additionally, combining the SMA with another indicator presents a viable approach. Given the lagging nature of the SMA, integrating it with a leading indicator such as the Relative Strength Index (RSI) or the Stochastic Oscillator provides a more holistic perspective on price movements. Furthermore, incorporating additional technical analysis factors, such as support and resistance levels, can also enhance the strategy's effectiveness.
Calculate Success Rate SMA
Exponential Moving Average (EMA)
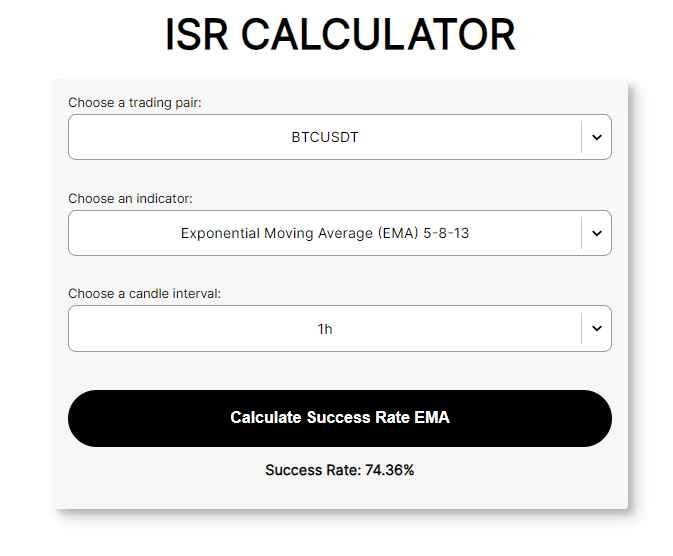
Distinguishing itself from the Simple Moving Average (SMA), the EMA attributes greater importance to recent data points, rendering it more responsive to fluctuations in price. Traders frequently leverage EMAs to identify trends, pinpoint support and resistance levels, and make trading decisions based on the most recent price shifts. Notably advantageous in volatile markets, the EMA swiftly adapts to price changes, making it particularly favored among short-term traders like day traders. By closely monitoring recent price data, the EMA empowers traders to make well-informed decisions regarding trade entry and exit, thereby enhancing their overall trading strategies and heightening their likelihood of success.
In the current scenario, the ISR Calculator is used to evaluate the effectiveness of the Exponential Moving Average (EMA) indicator within the BTC/USD trading pair. The analysis reveals a notable win rate of 74.36% on a 1-hour candle interval.
Several potential factors may account for the EMA indicator's high win rate in this backtest. Firstly, the EMA's nature as a trend-following indicator renders it more profitable in markets characterized by distinct trends. If the BTC/USD market exhibited a strong uptrend during the backtesting period, the EMA indicator would have likely captured numerous winning trades. Additionally, the phenomenon of overfitting could contribute to the high win rate. Overfitting occurs when a trading strategy is excessively tailored to fit the specific dataset on which it was tested, potentially resulting in impressive performance in backtesting but lackluster results in live trading.
Calculate Success Rate EMA
On-Balance Volume (OBV)
The On-Balance Volume (OBV) indicator constitutes a momentum tool employed in technical analysis to gauge the correlation between an asset's price actions and trading volume. Devised by Joseph Granville during the 1960s, OBV AIMS to forecast short-term price fluctuations by monitoring the positive or negative flow of trading volume. Its computation involves tallying a cumulative total, adding volume on days of price increases and deducting volume on days of price declines. Traders use OBV to validate price trends, pinpoint potential reversals, and anticipate shifts in market sentiment. Divergence between OBV and price trends may indicate an impending change in the asset's trajectory.
| Indicator | Relative Strength Index (RSI) | Simple Moving Average (SMA) | Exponential Moving Average (EMA) | On-Balance Volume (OBV) |
|---|---|---|---|---|
Type |
Momentum |
Trend Following |
Trend Following |
Volume/Momentum |
|
Calculation |
Compares gains to losses |
Average of closing prices |
Weighted average of prices |
Cumulative volume flow |
|
Purpose |
Identify overbought/oversold |
Identify trends |
Identify trends |
Predict price changes |
|
Range |
0 to 100 |
Varies |
Varies |
Varies |
|
Interpretation |
Above 70 = overbought |
Rising = uptrend |
Responsive to recent prices |
Divergence signals |
|
Usage |
Buy/sell signals |
Entry/exit points |
Timely responses to price changes |
Confirm trends/reversals |
|
Limitations |
False signals possible |
Lagging indicator |
Prone to false signals |
Leading indicator |
Best indicators: TU Research and traders survey
The responses of the surveyed traders to the question about their use of technical indicators were as follows:
-
27% of the traders use technical indicators as the main signal for opening a trade;
-
14% of the traders use technical indicators as a confirmation signal for opening a trade;
-
26% of the traders prefer to use technical indicators both as the main and as the confirmation signals for opening a trade;
-
33% of the surveyed traders do not use technical indicators.
| Use of indicators for opening trades | Votes | % |
|---|---|---|
|
As the main signal |
594 |
27% |
|
As a confirmation signal |
308 |
14% |
|
As the main and confirmation signals |
572 |
26% |
|
Don’t use |
726 |
33% |
|
Total |
2200 |
100% |
Distribution of traders’ answers on their use of technical indicators for trading in the Forex market
The respondents who replied that they were using technical indicators for making the decision on opening a trade were also asked which group of technical indicators they preferred to use (they could choose several options):
-
37% of the traders use trend indicators;
-
41% of the traders use oscillators;
-
22% of the traders prefer volume indicators.
| Used groups of indicators | Votes | % |
|---|---|---|
Trend indicators |
1929 |
37% |
|
Oscillators |
2138 |
41% |
|
Volume indicators |
1147 |
22% |
|
Total |
5214 |
100% |
Distribution of traders’ answers regarding the groups of technical indicators they use
What do TU experts think?

From my experience, volume indicators and their derivatives, such as DOM Levels, Delta, Volume Profile, are of great interest. Separately, I would like to point out the Order Book indicator for MT4, which shows the activity of forex brokers' clients: the left column represents pending orders (they can be used, for example, to determine stop-loss concentration levels), and the right column shows positions. The indicator confirms that clients always suffer losses, hence the idea of Contrarian Trading.
Order Book Indicator

While there are many useful tools available, I have found the relative strength index (RSI) to be one of the most effective indicators in my practice.
The RSI is valuable because it is not limited to just signaling overbought or oversold levels like many interpret it. Where the RSI really shines is in identifying divergences between the indicator and the price of the underlying asset. Divergences often foreshadow moves that are contrary to the current trend and can be very profitable trading opportunities if acted upon quickly.
Through rigorous backtesting, I have found that looking for divergences between the RSI and price has helped me better time my entries and exits over the long run. Spotting when the RSI forms a new high or low ahead of the market is a reliable way to anticipate potential trend reversals. This allows taking positions that ride the start of market turns. Indicator’s ability to spot hidden supply and demand imbalances make it an invaluable tool, especially when cross-checked with other indicators and chart patterns.
Some other indicators like MACD and stochastic oscillators can also detect divergences, but I find the RSI more reliable in confirming movements and signaling high-confidence trade entries and exits.

I think that it's not possible to label any single indicator as the best compared to others. They all have their unique specifics. Each of them can be more or less accurate depending on the current market situation and the selected settings parameters. Secondly, a strategy is rarely built on just one indicator. It's important to combine them, finding the optimal combination for a particular timeframe and asset.
Among my favorites, I would name RSI. I use RSI in probably more than 50% of my strategies. It combines well with both trend indicators and oscillators. Here are a couple of simple examples:
-
«Triple Confirmation». Stochastic (14,1,3), CCI (14), RSI (14, levels – 35, 65). The first two oscillators, upon entering the overbought or oversold zone, provide a primary signal. However, they have a drawback: stochastic reacts too sharply to any price change regardless of the specified period in the settings, and its signals are ambiguous. CCI smoothens the signals of stochastic but only partially. The confirming and main indicator in the strategy is RSI with expanded zones. It follows the price well, doesn't lag, and provides clear, easily interpretable signals.
-
RSI and EMA. Among trend indicators, EMA is my favorite. It's a simple form of averaging with a greater weight on recent periods, which is more effective than simple averaging. The position of EMA relative to the price gives a leading signal, which RSI confirms literally in 1-2 candles. Such a combination works most effectively on trend movements on timeframes H1-H4.
RSI blends perfectly even with non-standard, proprietary tools, smoothing out the effects of price noise.
Conclusion
In conclusion, selecting the most effective indicator for trading necessitates a comprehensive understanding of various technical tools and their applications. Throughout this article, the experts at TU have explored several prominent indicators, including the Relative Strength Index (RSI), Simple Moving Average (SMA), Exponential Moving Average (EMA), and On-Balance Volume (OBV). Each indicator offers unique insights into market dynamics, enabling traders to make informed decisions regarding entry and exit points, trend identification, and sentiment analysis. The Relative Strength Index (RSI) serves as a valuable tool for assessing overbought and oversold conditions, aiding traders in timing their trades and identifying potential reversals. Meanwhile, the Simple Moving Average (SMA) and Exponential Moving Average (EMA) provide valuable insights into trend direction, with the EMA offering greater responsiveness to recent price movements. Additionally, the On-Balance Volume (OBV) indicator offers a unique perspective by analyzing the relationship between price movements and trading volume, helping traders anticipate shifts in market sentiment.
Glossary for novice traders
-
1
Leverage
Forex leverage is a tool enabling traders to control larger positions with a relatively small amount of capital, amplifying potential profits and losses based on the chosen leverage ratio.
-
2
Index
Index in trading is the measure of the performance of a group of stocks, which can include the assets and securities in it.
-
3
Forex Trading
Forex trading, short for foreign exchange trading, is the practice of buying and selling currencies in the global foreign exchange market with the aim of profiting from fluctuations in exchange rates. Traders speculate on whether one currency will rise or fall in value relative to another currency and make trading decisions accordingly. However, beware that trading carries risks, and you can lose your whole capital.
-
4
Options trading
Options trading is a financial derivative strategy that involves the buying and selling of options contracts, which give traders the right (but not the obligation) to buy or sell an underlying asset at a specified price, known as the strike price, before or on a predetermined expiration date. There are two main types of options: call options, which allow the holder to buy the underlying asset, and put options, which allow the holder to sell the underlying asset.
-
5
Stochastic Oscillator
The Stochastic Oscillator is a technical indicator used in financial analysis to gauge the momentum of a security's price and identify overbought or oversold conditions by comparing the closing price to a specified price range over a defined period.
Related Articles


Team that worked on the article

Chinmay Soni is a financial analyst with more than 5 years of experience in working with stocks, Forex, derivatives, and other assets. As a founder of a boutique research firm and an active researcher, he covers various industries and fields, providing insights backed by statistical data. He is also an educator in the field of finance and technology.
As an author for Traders Union, he contributes his deep analytical insights on various topics, taking into account various aspects.

Dr. BJ Johnson is a PhD in English Language and an editor with over 15 years of experience. He earned his degree in English Language in the U.S and the UK. In 2020, Dr. Johnson joined the Traders Union team. Since then, he has created over 100 exclusive articles and edited over 300 articles of other authors.

Mirjan Hipolito is a journalist and news editor at Traders Union. She is an expert crypto writer with five years of experience in the financial markets. Her specialties are daily market news, price predictions, and Initial Coin Offerings (ICO).
