Three Black Crows Strategy For Profitable Trading


Editorial Note: While we adhere to strict Editorial Integrity, this post may contain references to products from our partners. Here's an explanation for How We Make Money. None of the data and information on this webpage constitutes investment advice according to our Disclaimer.
Main features of the Three Black Crows Candlestick Pattern:
- Formation: Consists of three consecutive long-bodied bearish candles
- Opening price: Each candle opens within the previous candle's real body, but not above the previous candle's close
- Closing price: Each candle closes progressively lower, near its low for the day, indicating strong selling pressure
- Body size: The candles have little to no lower wicks, showing that bears are in control from open to close
- Trend reversal: Typically appears after an uptrend, signaling a potential bearish reversal
- Volume: Higher trading volume on the three candles can confirm the strength of the pattern
- Reliability: More reliable when it forms at or near significant resistance levels
The Three Black Crows pattern is a fundamental tool for identifying a potential trend reversal after a strong bull market. Using a three black crow candlestick can provide a trader with an early warning of a radical change in trend in the market. This will allow you to make the right trading decision on time and make a profit. This article will help you understand the Three Black Crows pattern and learn how to use it for successful trading.
What is the Three Black Crows pattern?
The "Three Black Crows" pattern is a graphical model used in technical analysis, indicating a potential reversal of the price movement following a previous upward trend. The pattern consists of three consecutive bearish (declining) candlesticks, each opening within the body of the previous candle and closing below its low. This pattern signals that the bullish momentum is ending, and the bears are starting to dominate the market.
Pay attention to the length of the candle bodies, as longer bodies indicate significant price changes;
Note how each candle opens inside the previous one, confirming the continuation of bearish momentum;
Look for small or absent shadows, suggesting dominance by sellers and little resistance from buyers.
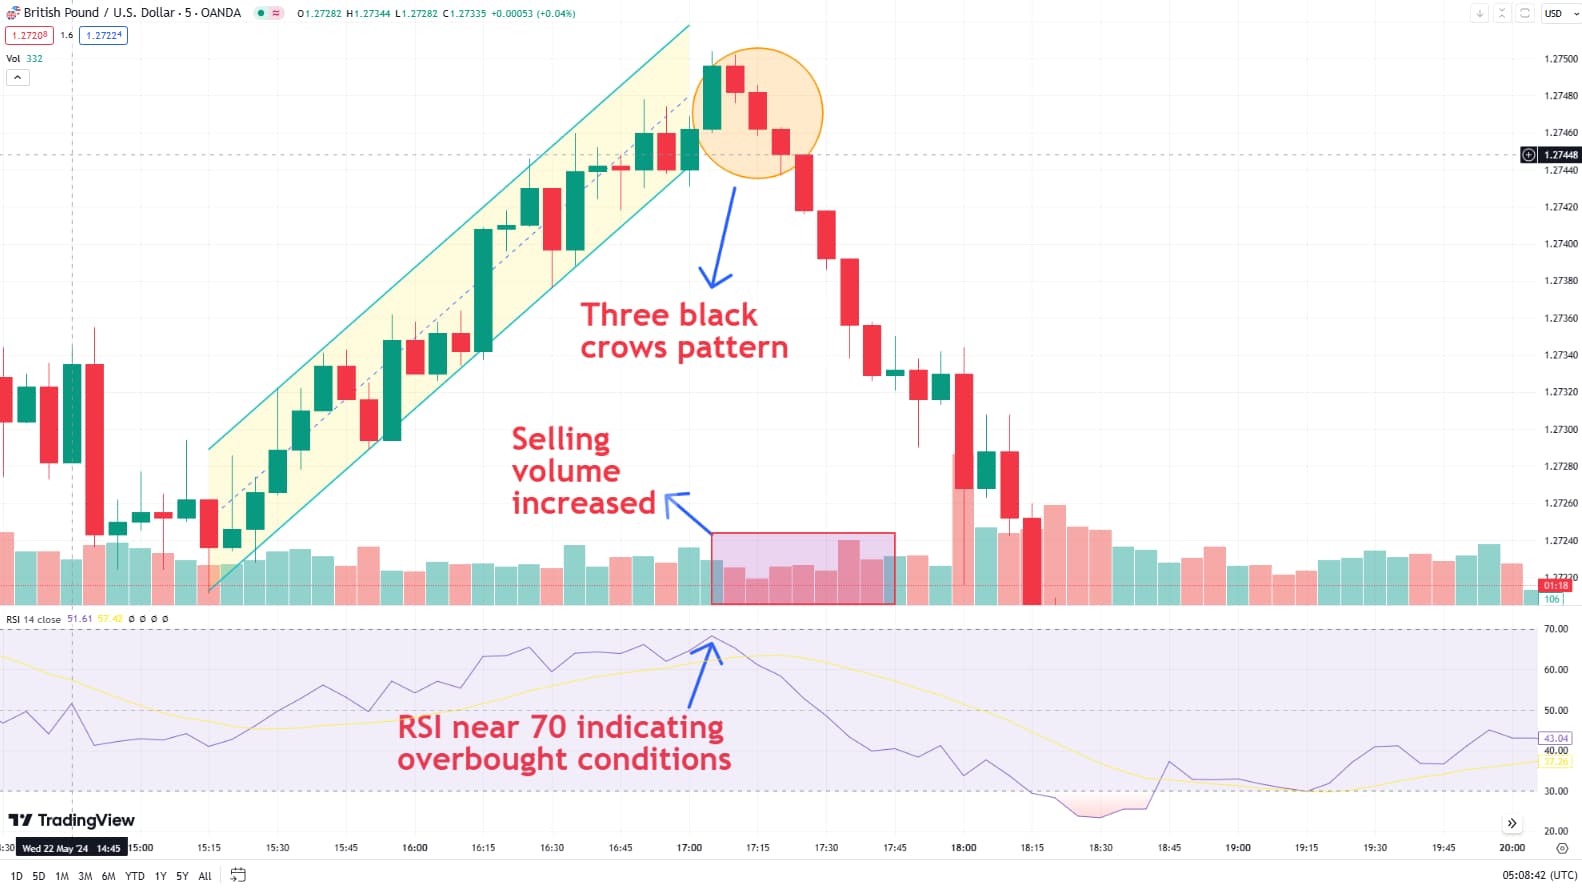
Traders use candlestick charts and technical indicators like moving averages or the relative strength index (RSI) to identify and confirm the formation of this pattern, helping them make informed decisions about market movements.
Examples of charts with a Three Black Crows pattern
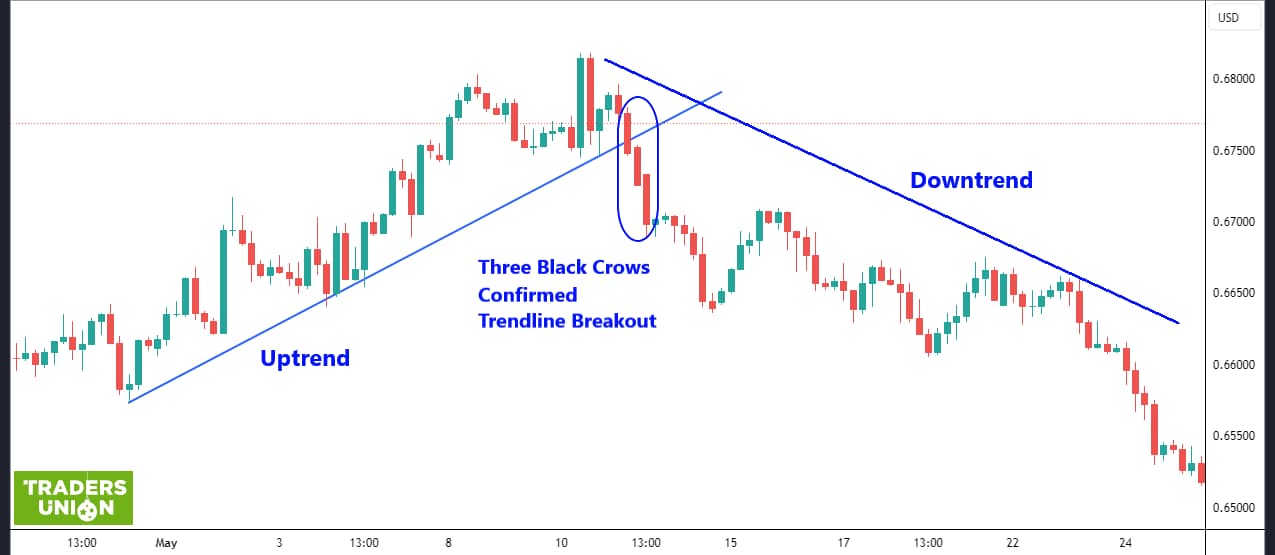
The Three Black Crows pattern in trading
The "Three Black Crows" pattern is highly significant for traders because it provides clear signals of a possible trend change. In an uptrend, this pattern warns traders that the bullish market is ending, and the price of the traded asset is likely to go down. This pattern gives traders a short amount of time to prepare for a potential reversal and adjust their trading strategies accordingly.
Why is the Three Black Crows pattern important for traders?
Trend reversal: The "Three Black Crows" pattern is one of the most reliable indicators of a trend reversal. The appearance of three consecutive bearish candles after a prolonged uptrend indicates that buyers have exhausted their strength, and sellers are beginning to dominate. This could be the start of a significant downtrend.
Warning of price decline: For traders, especially those holding long positions, this pattern serves as an important warning of potential losses. By recognizing the "Three Black Crows" in time, traders can close their long positions, minimizing losses, or start opening short positions to capitalize on the downward movement.
Market sentiment analysis: The "Three Black Crows" pattern also provides information about market sentiment. The appearance of three bearish candles in a row indicates a significant change in market expectations and investor psychology. This helps traders better understand the current market dynamics and make more informed decisions.
What signals does the Three Black Crows pattern give?
End of the bullish trend: The main signal of the "Three Black Crows" pattern is the end of the bullish trend. If you see three consecutive bearish candles, it is a clear sign that the previous uptrend has likely ended.
Start of the bearish trend: After the pattern appears, a downtrend often begins. This is a signal for traders to consider opening short positions or closing long positions.
Strong selling pressure: Three long bearish candles indicate significant selling pressure. This signals that bears are dominating the market, and the price is likely to continue falling.
Confirmation from other indicators: The "Three Black Crows" pattern is often used in combination with other technical indicators to confirm signals. For example, if the pattern coincides with a moving average crossover or RSI with increase in trading volume, it strengthens the sell signal.
How to use the Three Black Crows pattern for profitable trading
When you identify the "Three Black Crows" pattern on a chart, it is essential not to act impulsively. First, confirm the signal using other technical indicators. For example, check the trading volumes: an increase in volume when the pattern appears strengthens the signal. It is also helpful to use indicators such as RSI (Relative Strength Index) to ensure that the market is indeed overbought and ready for a reversal.
What to do when the pattern is identified?
Analyze the Chart: Ensure that the pattern is correctly formed: three consecutive bearish candles, each opening within the body of the previous candle and closing below its low.
Check Volumes: An increase in trading volume confirms the strength of the signal.
Use Additional Indicators: Verify other indicators to confirm the reversal.
When to open sell positions?
Opening short positions when the "Three Black Crows" pattern appears should be a well-considered step. Here are some recommendations for opening positions:
Wait for Signal Confirmation: Wait for confirmation of the signal from additional indicators, such as moving averages or oscillators;
Market Situation: Ensure that the pattern appeared after a sustained uptrend, as this increases the likelihood of a reversal;
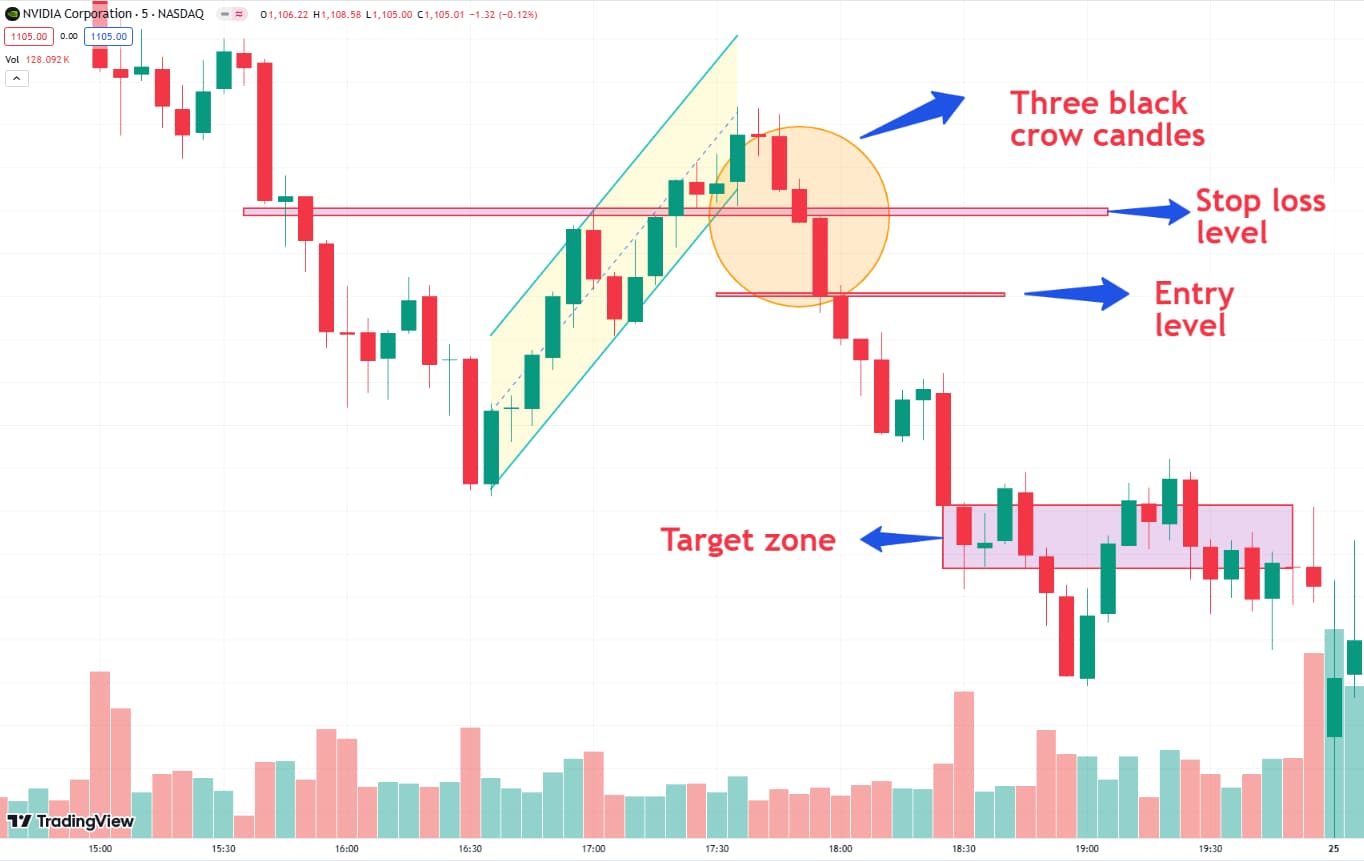
Entry Point: Open a short position immediately after the third bearish candle closes or on the next candle if other indicators confirm the signal.
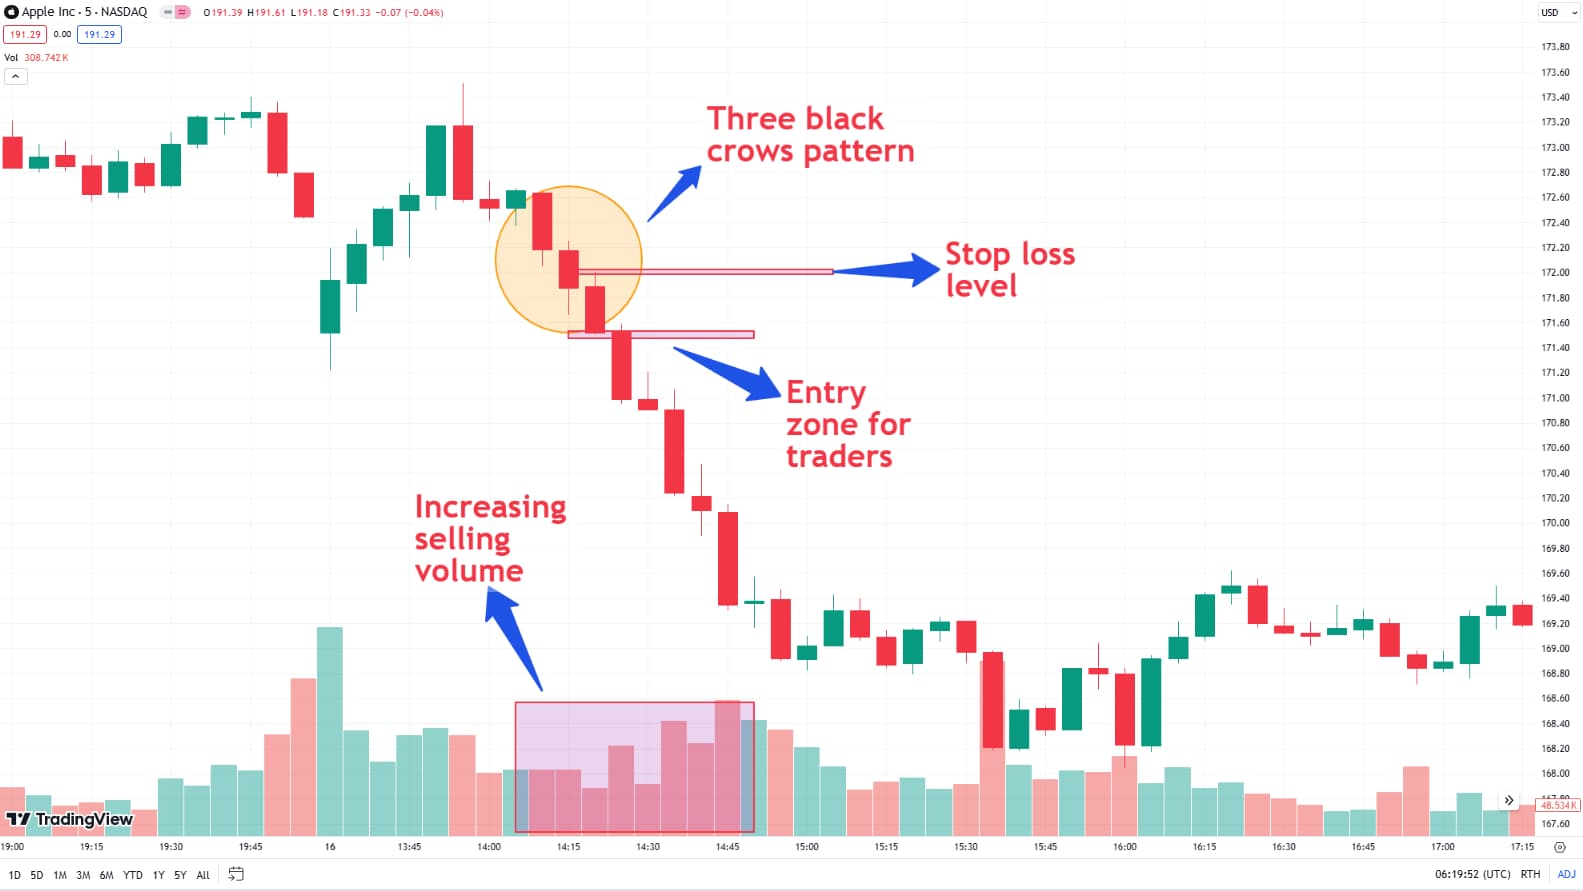
Setting stop-loss and take-profit levels
Properly setting stop-loss and take-profit levels is a crucial element of successful trading using the "Three Black Crows" pattern.
Stop-loss levels
Above the third candle's high: Set the stop-loss slightly above the high of the third bearish candle. This will minimize losses in case of a false signal.
Support and resistance levels: Use support and resistance levels for more precise stop-loss placement.
Take-profit levels
Risk-reward ratio: Calculate the risk-reward ratio (e.g., 1:2 or 1:3) to set the take-profit level. This helps you lock in profits when the price reaches a certain level.
Target levels: Identify potential target levels based on previous support levels or other technical indicators, such as moving averages.
Example strategy:
Entry: Open a short position after the third bearish candle closes.
Stop-loss: Slightly above the high of the third candle.
Take-profit: At a level corresponding to double or triple the risk, or at the nearest support level.
Practical tips for using the Three Black Crows pattern
Recommendations for beginners
Study charts. Before using the Three Black Crows pattern in real markets, practice on historical data. Analyze past charts to better understand how this pattern forms and under what conditions it is most effective.
Use demo accounts. Start with a demo account to master trading with this pattern without the risk of losing real money. This will help you understand how your strategies work and what needs to be adjusted.
Combine with other indicators. Never rely solely on one pattern. Use it in combination with other technical indicators to confirm signals and improve the accuracy of your forecasts.
Mistakes to avoid
Ignoring volumes. An increase in trading volume when the Three Black Crows pattern appears strengthens its signal. Ignoring this aspect can lead to false signals.
Lack of confirmation. Opening positions solely based on the pattern without confirmation from other indicators can lead to losses. Always use additional signals for confirmation.
Neglecting stop-losses. Setting stop-losses is essential for minimizing risks. Neglecting this rule can lead to significant losses.
Trading against the trend. Using the Three Black Crows pattern in the absence of a trend or in an uptrend that has not yet exhausted itself can be ineffective.
To use the Three Black Crows pattern for profitable trading in the financial markets, it is good to find a reliable broker. We have prepared a comparison table of Forex brokers offering a wide range of assets. They have good trading conditions, in particular the choice of currency pairs and trading commissions.
| Min. deposit, $ | Max. leverage | Scalping | Trading bots (EAs) | Open account | |
|---|---|---|---|---|---|
| 10 | 1:1000 | Yes | Yes | Go to broker Your capital is at risk.
|
|
| 100 | 1:300 | No | No | Go to broker 80% of retail CFD accounts lose money. |
|
| No | 1:200 | Yes | Yes | Go to broker Your capital is at risk. |
|
| 50 | 1:50 | Yes | Yes | Go to broker Your capital is at risk. |
|
| 100 | 1:50 | Yes | Yes | Study review |
Confirming the Three Black Crows Pattern with Additional Technical Indicators

As an experienced trader, I can confirm the effectiveness of the "Three Black Crows"pattern in signaling potential market reversals. This pattern, consisting of three consecutive bearish candles, serves as a reliable indicator that an uptrend may be coming to an end. By integrating this pattern into your trading strategy, you can gain valuable insights into market sentiment and make more informed trading decisions.
For beginners, my first piece of advice is to always confirm the Three Black Crows pattern with additional technical indicators. Relying solely on one pattern can lead to false signals (bear trap), so use tools like moving averages or the Relative Strength Index (RSI) to validate the trend reversal.
Secondly, never underestimate the importance of proper risk management. Set clear stop-loss and take-profit levels based on previous support and resistance levels. This approach will help you manage your risks effectively and increase your chances of capturing profitable trades.
By following these tips and continuously learning, you can harness the power of the Three Black Crows pattern to enhance your trading strategy and achieve consistent success in the markets.
Conclusion
Mastering the Three Black Crows Pattern empowers traders to identify strong bearish reversals and act confidently in shifting markets. By recognizing the formation of three consecutive long-bodied red candlesticks, as seen during significant market downturns, investors can anticipate potential declines and adjust their strategies accordingly. For example, spotting this pattern after a prolonged uptrend signals a strategic moment to exit long positions or consider short selling. Ultimately, understanding and applying the Three Black Crows Pattern is not just about recognizing signals—it's about turning market insight into tactical advantage.
FAQs
What are the key characteristics that distinguish a valid Three Black Crows pattern?
How can traders incorporate the Three Black Crows pattern into a risk management strategy?
Why is it important to confirm the Three Black Crows pattern with other technical indicators?
What common mistakes should traders avoid when using the Three Black Crows pattern?
Editors' Top Picks and Insights

Do politicians make the best stock traders?

Crypto test drive: How automakers are exploring digital assets

Lindsey Graham death: U.S. senator’s crypto legacy

Tether under pressure: USDT in Europe, audit questions, and the fight for trust

Lean Ethereum: Why Buterin wants to rebuild the network

SK Hynix debuts on Nasdaq: Largest U.S. offering by foreign company
Related Articles
Team that worked on the article
Anastasiia has 17 years of experience in finance and content marketing. She believes that the support of information and expert opinion is very important for the success of investors and new traders.
Dr. BJ Johnson is a PhD in English Language and an editor with over 15 years of experience. He earned his degree in English Language in the U.S and the UK.
Mirjan Hipolito is a journalist and news editor at Traders Union. She is an expert crypto writer with five years of experience in the financial markets.
Forex leverage is a tool enabling traders to control larger positions with a relatively small amount of capital, amplifying potential profits and losses based on the chosen leverage ratio.
Ethereum is a decentralized blockchain platform and cryptocurrency that was proposed by Vitalik Buterin in late 2013 and development began in early 2014. It was designed as a versatile platform for creating decentralized applications (DApps) and smart contracts.
An investor is an individual, who invests money in an asset with the expectation that its value would appreciate in the future. The asset can be anything, including a bond, debenture, mutual fund, equity, gold, silver, exchange-traded funds (ETFs), and real-estate property.
Scalping in trading is a strategy where traders aim to make quick, small profits by executing numerous short-term trades within seconds or minutes, capitalizing on minor price fluctuations.
Bitcoin is a decentralized digital cryptocurrency that was created in 2009 by an anonymous individual or group using the pseudonym Satoshi Nakamoto. It operates on a technology called blockchain, which is a distributed ledger that records all transactions across a network of computers.

-
 Afghanistan
-
 Albania
-
 Algeria
-
 Angola
-
 Argentina
-
 Armenia
-
 Australia
-
 Austria
-
 Azerbaijan
-
 Bahamas
-
 Bahrain
-
 Bangladesh
-
 Belarus
-
 Belgium
-
 Bolivia
-
 Botswana
-
 Brazil
-
 Brunei
-
 Bulgaria
-
 Cambodia
-
 Cameroon
-
 Canada
-
 Chile
Chile
-
 China
China
-
 Colombia
-
 Congo
Congo
-
 Costa Rica
-
 Cote d'Ivoire
-
 Croatia
-
 Cuba
Cuba
-
 Cyprus
-
 Czechia
-
 DR Congo
-
 Denmark
-
 Dominican Republic
-
 Ecuador
-
 Egypt
Egypt
-
 El Salvador
-
 Estonia
-
 Eswatini
-
 Ethiopia
-
 Finland
-
 France
-
 Georgia
-
 Germany
-
 Ghana
Ghana
-
 Greece
-
 Haiti
Haiti
-
 Hong Kong
-
 Hungary
-
 India
India
-
 Indonesia
-
 Iran, Islamic republic
-
 Iraq
Iraq
-
 Ireland
-
 Israel
-
 Italy
Italy
-
 Jamaica
-
 Japan
Japan
-
 Jordan
-
 Kazakhstan
-
 Kenya
Kenya
-
 Korea
Korea
-
 Kuwait
-
 Kyrgyzstan
-
 Laos
Laos
-
 Latvia
-
 Lebanon
-
 Lesotho
-
 Libya
Libya
-
 Lithuania
-
 Luxembourg
-
 Madagascar
-
 Malaysia
-
 Malta
Malta
-
 Mauritius
-
 Mexico
-
 Moldova
-
 Mongolia
-
 Montenegro
-
 Morocco
-
 Mozambique
-
 Myanmar
-
 Namibia
-
 Nepal
Nepal
-
 Netherlands
-
 New Zealand
-
 Nigeria
-
 North Macedonia
-
 Norway
-
 Oman
Oman
-
 Pakistan
-
 Palestine
-
 Panama
-
 Papua New Guinea
-
 Paraguay
-
 Peru
Peru
-
 Philippines
-
 Poland
-
 Portugal
-
 Puerto Rico
-
 Qatar
Qatar
-
 Reunion
-
 Romania
-
 Rwanda
-
 Saudi Arabia
-
 Serbia
-
 Singapore
-
 Slovakia
-
 Slovenia
-
 Somalia
-
 South Africa
-
 Spain
Spain
-
 Sri Lanka
-
 Sweden
-
 Switzerland
-
 Syria
Syria
-
 Taiwan
-
 Tajikistan
-
 Tanzania
-
 Thailand
-
 Trinidad and Tobago
-
 Tunisia
-
 Turkey
-
 UAE
UAE
-
 Uganda
-
 Ukraine
-
 United Kingdom
-
United States
-
 Uruguay
-
 Uzbekistan
-
 Venezuela
-
 Vietnam
-
 Yemen
Yemen
-
 Zambia
-
 Zimbabwe
- Forex
- Crypto
