Best TradingView Indicators For Day Trading And Scalping


Editorial Note: While we adhere to strict Editorial Integrity, this post may contain references to products from our partners. Here's an explanation for How We Make Money. None of the data and information on this webpage constitutes investment advice according to our Disclaimer.
The best TradingView indicators for day trading and scalping are:
TradingView’s extensive suite of tools has become a go-to resource for traders worldwide. One of its standout features is its vast library of indicators, which cater to a wide range of trading styles, from beginner to advanced. In this article, we’ll explore the top TradingView indicators that can help you make more accurate trading decisions and optimize your strategy for success.
Best TradingView indicators for day trading
TradingView’s indicators are essential tools that help traders analyze price movements, identify trends, and make precise trading decisions. With a vast selection available, from volume-based metrics to momentum oscillators, TradingView provides solutions for every trading style. Here’s a look at the top indicators on TradingView that consistently deliver clear signals and actionable insights, whether you're focused on day trading, swing trading, or long-term investing.
Relative Strength Index (RSI): Gauge momentum like a pro
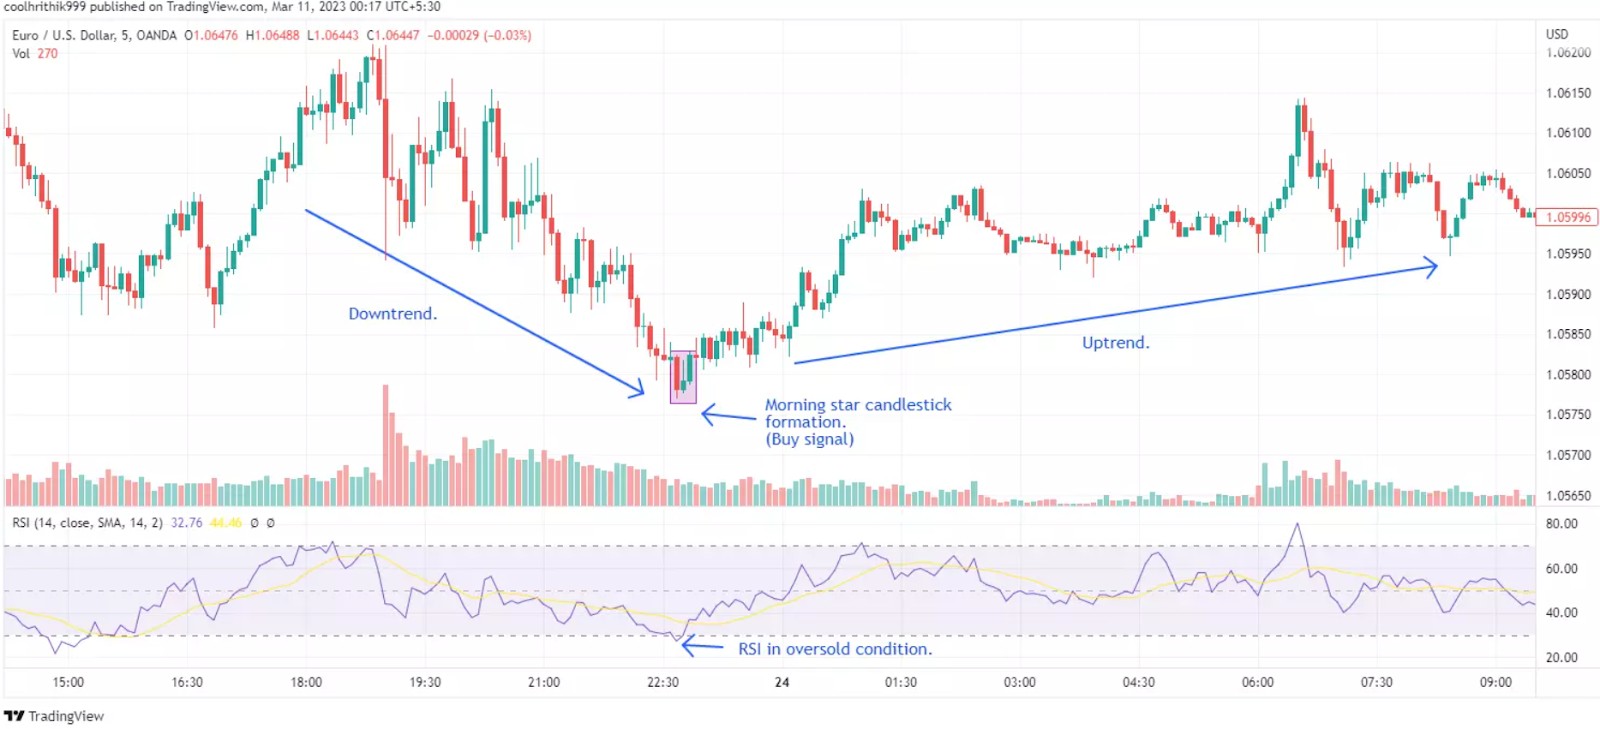
The Relative Strength Index Relative Strength Index (RSI) is a favorite among traders for measuring the speed and change of price movements. It operates on a scale of 0 to 100, with values over 70 signaling overbought conditions and values below 30 indicating oversold territory. This indicator can help you spot potential trend reversals, making it ideal for traders looking to time their entries and exits more effectively.
Example: Buying opportunities emerge when the RSI dips into the oversold zone, crossing below 30, which may signal an upcoming rebound. Conversely, selling opportunities are indicated when the RSI moves into the overbought area, crossing above 70, suggesting a potential trend reversal downward. To improve accuracy, experts recommend combining RSI signals with additional indicators and broader market analysis to reduce false signals and enhance the overall trading strategy.
Moving Average Convergence Divergence (MACD): Identify trends and momentum
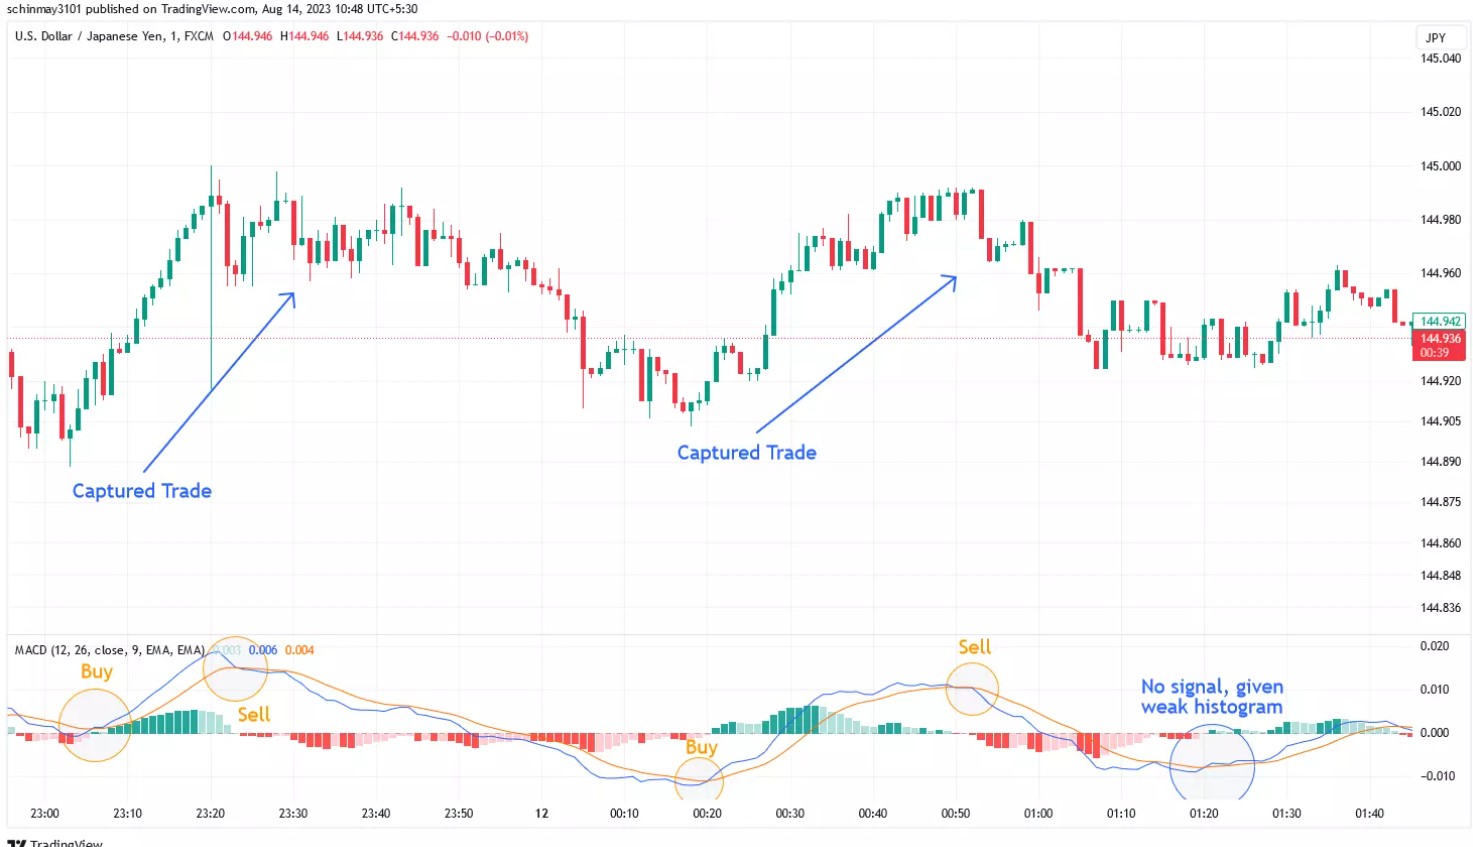
MACD is another powerful tool, designed to reveal changes in the strength, direction, and momentum of a trend. It consists of two moving averages that oscillate above and below a zero line, providing clear buy and sell signals when the MACD line crosses the signal line.
Example: When the MACD line crosses above the signal line, it indicates a “bullish crossover,” signaling that momentum is shifting upward. The trader takes this as a signal to buy, expecting the price to continue rising. As the trade plays out, they monitor the MACD for a bearish crossover (when the MACD line crosses below the signal line), which could indicate a reversal. When this crossover occurs, they exit the trade to protect profits as the upward momentum fades.
Bollinger Bands: Spot volatility with ease
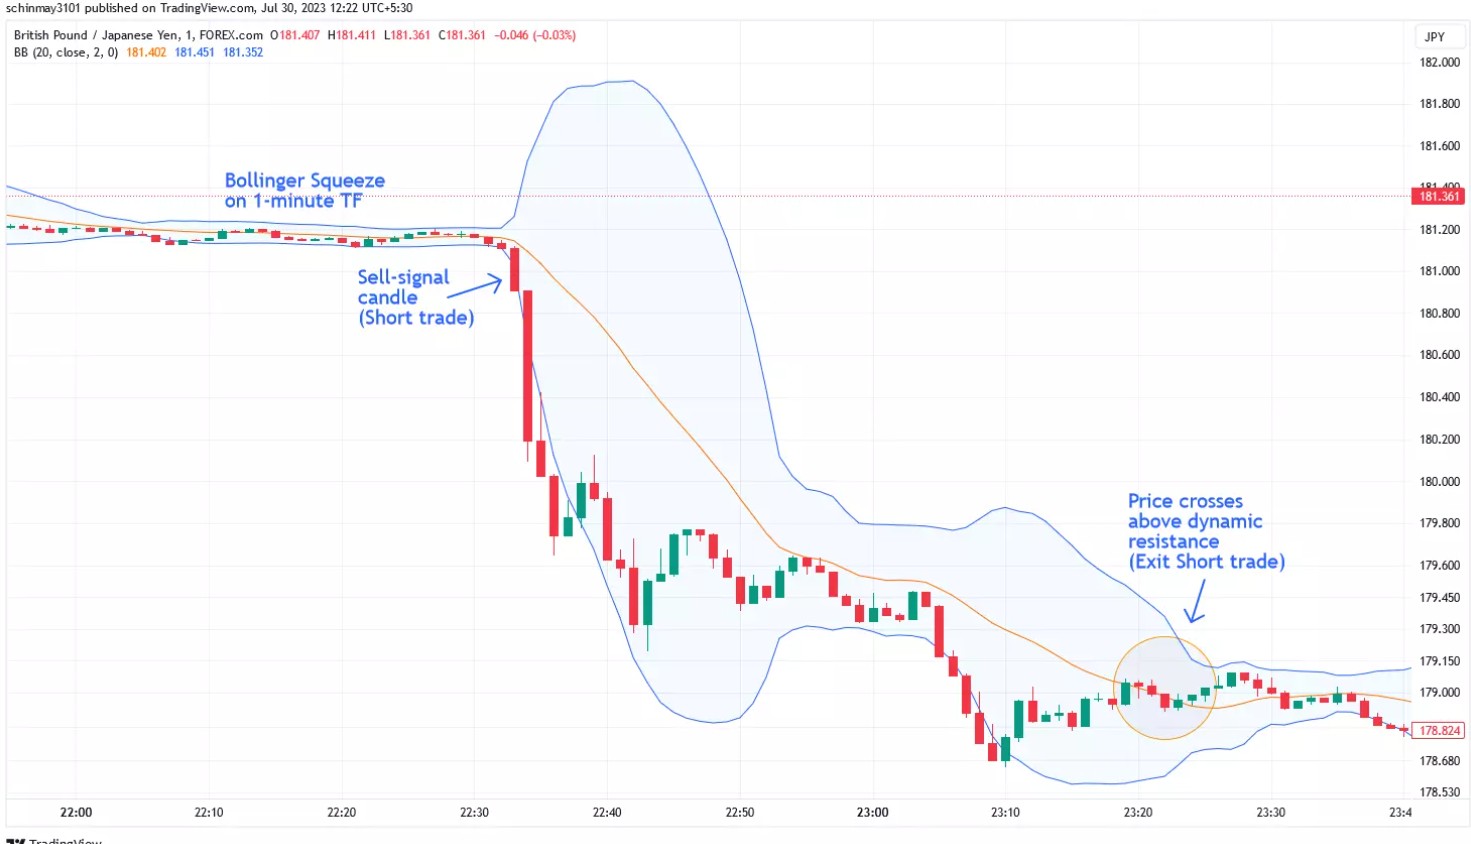
Bollinger Bands consist of three lines — an upper band, a lower band, and a middle moving average line. The bands widen and contract based on market volatility, making them excellent for assessing when a security is overbought or oversold.
Example: While the classic Bollinger Bands strategy views the bands as levels for potential reversals, many day traders use it with a different approach. After a period of low volatility, shown by a tight Bollinger Band range (known as the "Bollinger squeeze"), a sharp move in price in either direction signals a buy or sell in that direction. The exit signal appears when the price pulls back and touches the center line, which acts as a dynamic resistance or support.
SuperTrend: a reliable indicator for trend traders
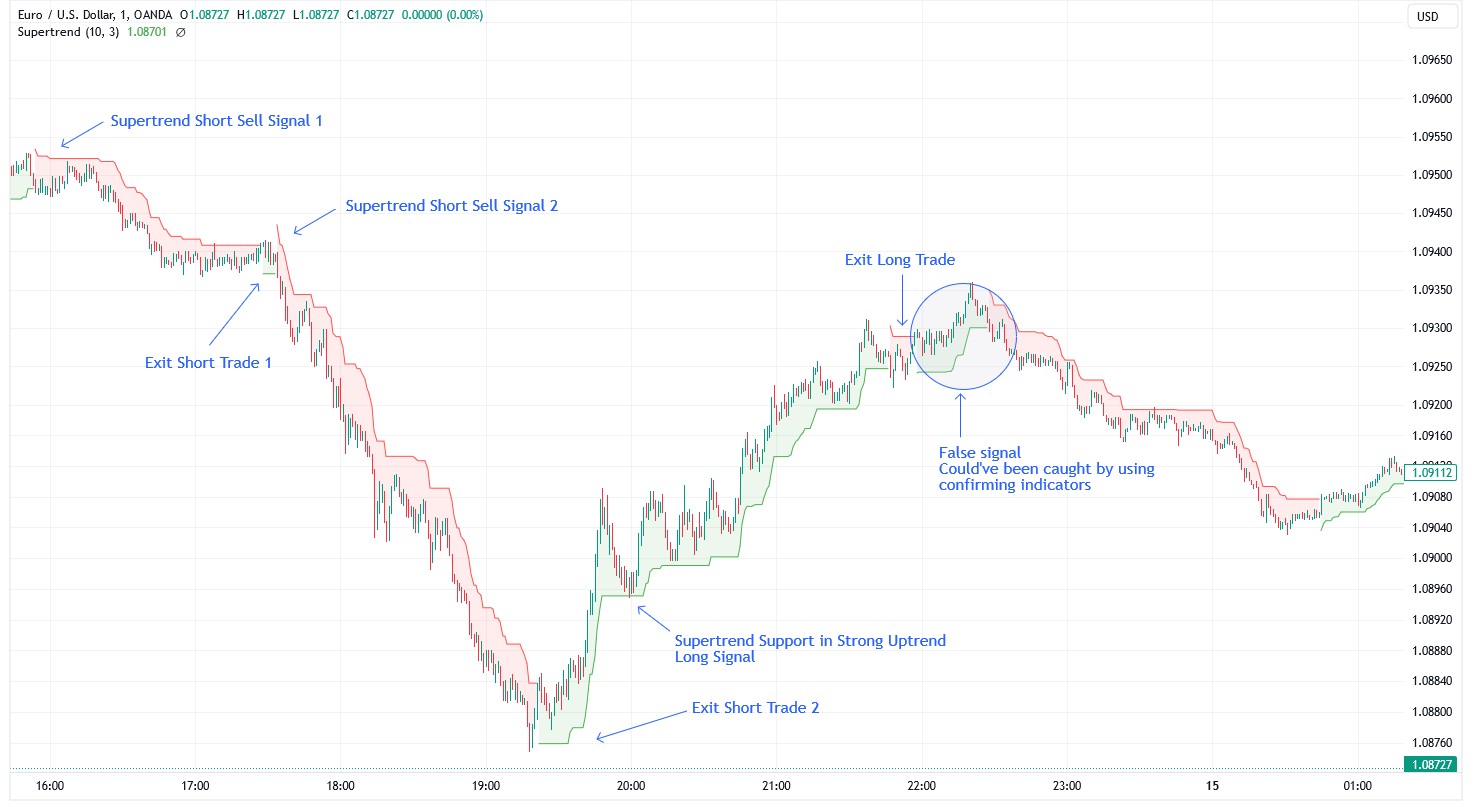
SuperTrend is based on price and average true range (ATR) and is particularly useful for trend-following strategies. It gives a clear buy or sell signal by shifting colors depending on the market trend direction.
Example: When the price moves above the Supertrend line, it may signal a buy opportunity, indicating an upward trend. Conversely, a move below the Supertrend line suggests a sell opportunity, marking a downtrend. Experts recommend using the Supertrend indicator in fast-moving, trending markets rather than in slow, range-bound conditions for optimal effectiveness.
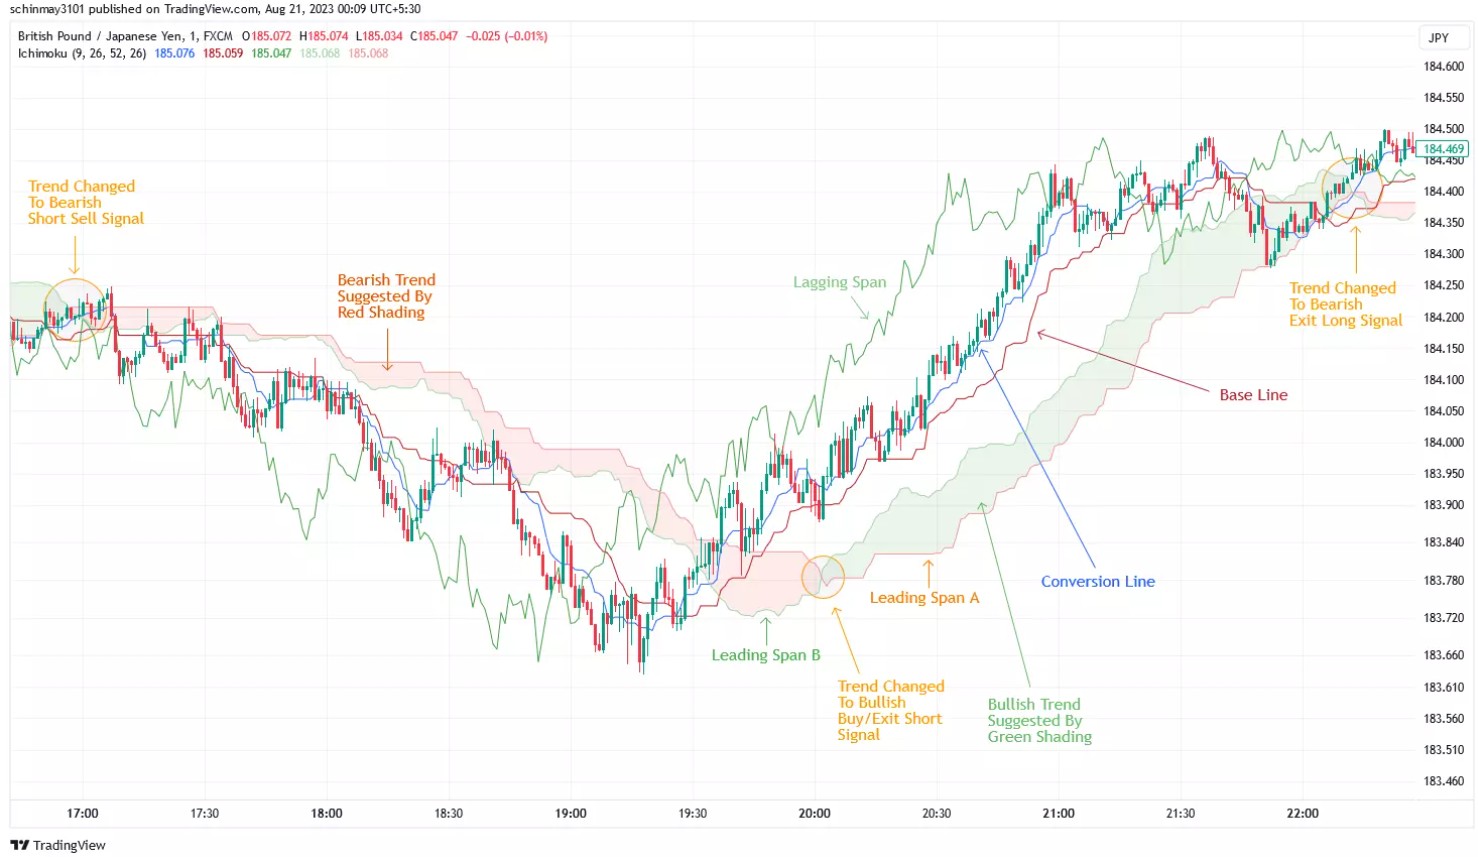
Ichimoku Cloud: Comprehensive indicator for market analysis
The Ichimoku Cloud, or Ichimoku Kinko Hyo, is a comprehensive indicator that includes multiple lines to show support and resistance, trend direction, and momentum. Although it can seem overwhelming, the Ichimoku Cloud is extremely effective in identifying trends and potential breakouts.
Example: In a strong trending market, use the Ichimoku Cloud to identify potential trend reversals. A buy signal appears when the price breaks above a bearish cloud (red) and the trend shifts to bullish. Similarly, a sell signal is triggered when the price drops below a bullish cloud (green), indicating a bearish trend. For added confirmation, check that the Lagging Span is positioned above (or below) past prices. Exit signals are generated with the next trend reversal, again indicated by the cloud colors.
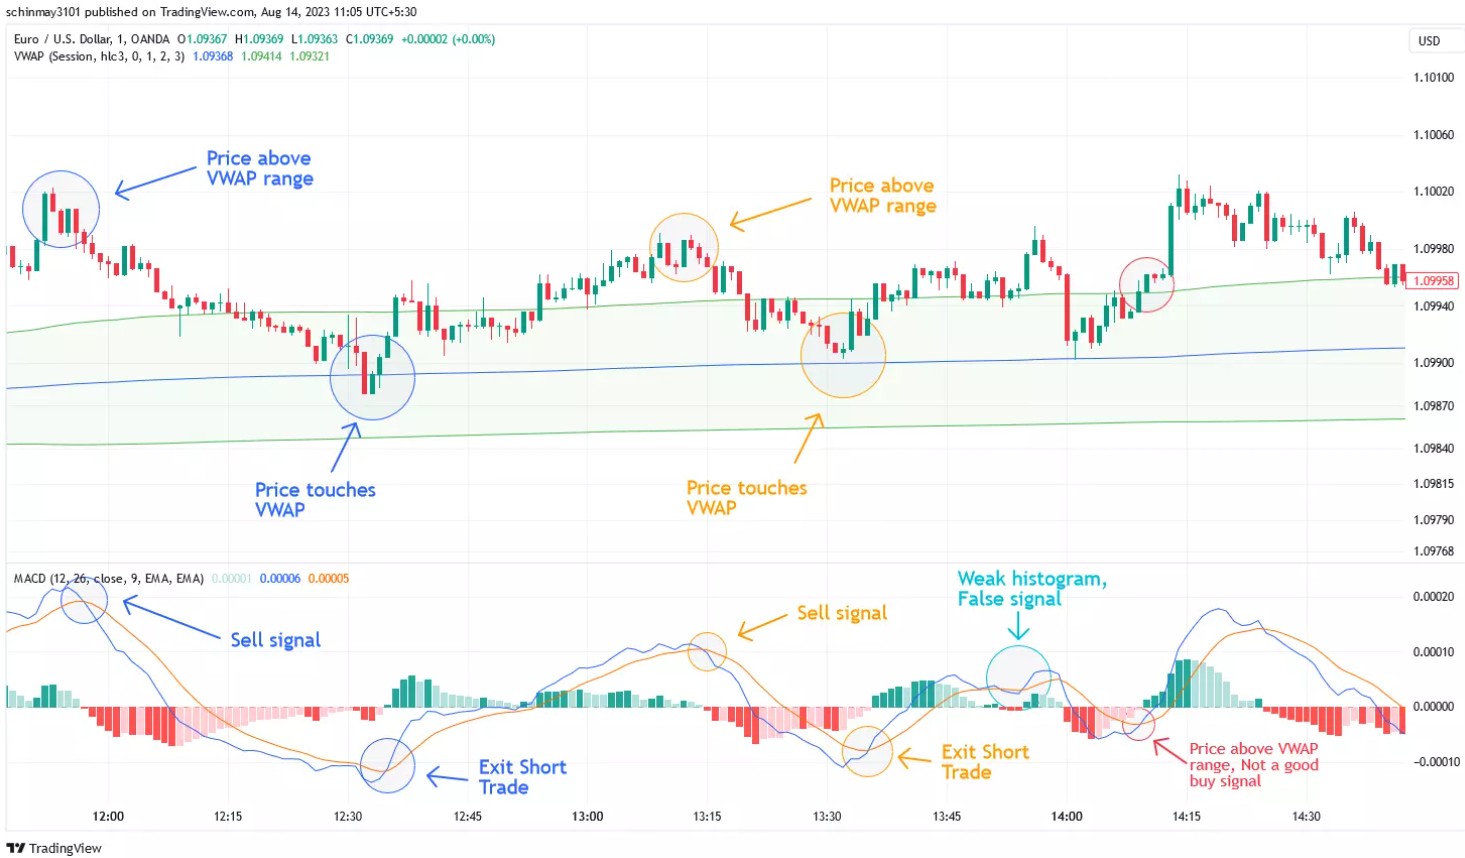
VWAP (Volume Weighted Average Price): Ideal for day traders
VWAP is a volume-weighted indicator that calculates the average price weighted by trading volume. It’s widely used by day traders to gauge a security’s true average price, providing an objective measure of trend direction during the trading day.
Example: Traditionally, if the current price is below the VWAP line, it may signal a buying opportunity, as you’re getting a price lower than the day’s average. Conversely, when the current price is above the VWAP line, it could be a good time to sell, as the price is higher than the average. Essentially, VWAP guides you on when to buy at a discount or sell at a premium relative to the average price. For day traders, combining VWAP with indicators like MACD can improve results, as MACD-generated signals can be confirmed with VWAP to strengthen trade decisions.
Can I trade directly from TradingView charts?
Yes, you can trade directly from TradingView charts, as certain brokers offer seamless integration with this platform. This feature allows you to execute trades and manage positions without leaving TradingView’s interface. To help you select the best option for your trading needs, we’ve compared brokers’ trading conditions, fees, and regulatory status, ensuring you have a secure and efficient experience when trading through TradingView.
| TradingView | API | Demo | Min. deposit, $ | Max. leverage | Min Spread EUR/USD, pips | Max Spread EUR/USD, pips | Max. Regulation Level | Open an account | |
|---|---|---|---|---|---|---|---|---|---|
| Yes | No | Yes | 50 | 1:50 | 0.9 | No | Tier-1 | Go to broker Your capital is at risk. |
|
| Yes | No | Yes | 100 | 1:300 | 0.5 | 0.9 | Tier-1 | Go to broker 80% of retail CFD accounts lose money. |
|
| Yes | Yes | Yes | No | 1:200 | 0.1 | 0.5 | Tier-1 | Go to broker Your capital is at risk. |
|
| Yes | Yes | Yes | 100 | 1:50 | 0.7 | 1.2 | Tier-1 | Study review | |
| Yes | Yes | Yes | 1 | 1:200 | 0.6 | 1.2 | Tier-1 | Study review |
Pros and cons
- Pros
- Cons
Informed decisions. Indicators provide better insights into trends and market momentum, helping traders make data-backed decisions.
Customization and backtesting. TradingView indicators can be customized and backtested, allowing you to fine-tune settings to match your trading style and test their effectiveness.
Quick visual signals. Indicators simplify complex data and highlight potential opportunities, making it easier to spot entries and exits at a glance.
Historical dependence. Indicators are reactive, not predictive, as they rely on past price data. This can lead to delayed or inaccurate signals in rapidly changing markets.
Potential confusion. Using too many indicators can result in conflicting signals, adding complexity to your analysis and potentially causing hesitation.
Not a standalone solution. Indicators are only tools and should not replace a solid trading plan. They work best when used as part of a broader strategy that includes experience-based judgment and market awareness.
Risks and warnings
Lagging signals. Most indicators rely on historical data, so they may lag behind real-time price movements, especially in volatile markets. This can lead to delayed entry or exit points, potentially reducing profitability.
Conflicting signals. Indicators can sometimes produce contradictory signals, leading to confusion and indecision, particularly when using multiple indicators at once.
Analysis paralysis. Overloading charts with too many indicators can result in analysis paralysis, where too much information hampers clear decision-making.
False sense of security. Indicators are guides, not guarantees. Relying solely on them can create overconfidence, making it essential to pair them with a sound trading plan and risk management.
Market conditions. Indicators perform differently across market conditions, and what works in a trending market may fail in a choppy or range-bound market. Testing and adaptation are key.
Using TradingView indicators wisely

It’s easy to get caught up in adding too many indicators, but this often leads to confusion and analysis paralysis. Stick to a few indicators that align with your strategy, and make sure you understand each one thoroughly.
The key to using these indicators effectively is understanding that no single tool guarantees profits. The best approach is to use indicators as supportive data points within your broader trading strategy. Testing your strategy using TradingView’s paper trading feature is a good way to gain confidence without financial risk.
Conclusion
TradingView’s indicators are designed to support traders in making data-driven decisions. By experimenting with these tools and learning how to read their signals effectively, you can boost your trading success. Remember, it’s all about finding the right mix of indicators that complement your trading style and goals.
FAQs
Can I use TradingView indicators for free?
Yes, TradingView offers free access to a limited number of indicators, but a paid plan is needed to unlock advanced indicators and use multiple indicators simultaneously.
How do I know which indicators work best for my trading style?
Experiment with different indicators in TradingView’s paper trading mode to see which ones align with your trading strategy without risking real money.
Can I create custom indicators on TradingView?
Yes, TradingView allows you to build custom indicators using its Pine Script language, so you can design indicators tailored to your specific needs.
Why do some indicators give conflicting signals?
Indicators often measure different aspects (e.g., trend, momentum, volume), so conflicting signals can happen. It’s best to combine indicators that complement each other.
Editors' Top Picks and Insights

Trading thin air: Why Binance is closing its NFT marketplace

Bitcoin without investors: Why IPOs are winning attention

Bitcoin price prediction based on MACD: Bearish momentum gains strength

Ethereum's identity crisis: Between Wall Street and cypherpunk

Europe and U.S. prepare crypto taxes: How their approaches differ

Faucets, testnets and airdrops: Does free cryptocurrency really exist?
Related Articles
Team that worked on the article
Andrey Mastykin is an experienced author, editor, and content strategist who has been with Traders Union since 2020. As an editor, he is meticulous about fact-checking and ensuring the accuracy of all information published on the Traders Union platform.
Chinmay Soni is a financial analyst with more than 5 years of experience in working with stocks, Forex, derivatives, and other assets. As a founder of a boutique research firm and an active researcher, he covers various industries and fields, providing insights backed by statistical data.
Mirjan Hipolito is a journalist and news editor at Traders Union. She is an expert crypto writer with five years of experience in the financial markets.
Swing trading is a trading strategy that involves holding positions in financial assets, such as stocks or forex, for several days to weeks, aiming to profit from short- to medium-term price swings or "swings" in the market. Swing traders typically use technical and fundamental analysis to identify potential entry and exit points.
ATR (Average True Range) is a volatility indicator that helps traders assess the potential price range or volatility of a financial instrument. It calculates the average of true price ranges over a specified period, providing insight into the level of price fluctuations within that timeframe.
Uptrend is a market condition in which prices are generally rising. Uptrends can be identified by using moving averages, trendlines, and support and resistance levels.
Bollinger Bands (BBands) are a technical analysis tool that consists of three lines: a middle moving average and two outer bands that are typically set at a standard deviation away from the moving average. These bands help traders visualize potential price volatility and identify overbought or oversold conditions in the market.
An investor is an individual, who invests money in an asset with the expectation that its value would appreciate in the future. The asset can be anything, including a bond, debenture, mutual fund, equity, gold, silver, exchange-traded funds (ETFs), and real-estate property.

-
 Afghanistan
-
 Albania
-
 Algeria
-
 Angola
-
 Argentina
-
 Armenia
-
 Australia
-
 Austria
-
 Azerbaijan
-
 Bahamas
-
 Bahrain
-
 Bangladesh
-
 Belarus
-
 Belgium
-
 Bolivia
-
 Botswana
-
 Brazil
-
 Brunei
-
 Bulgaria
-
 Cambodia
-
 Cameroon
-
 Canada
-
 Chile
Chile
-
 China
China
-
 Colombia
-
 Congo
Congo
-
 Costa Rica
-
 Cote d'Ivoire
-
 Croatia
-
 Cuba
Cuba
-
 Cyprus
-
 Czechia
-
 DR Congo
-
 Denmark
-
 Dominican Republic
-
 Ecuador
-
 Egypt
Egypt
-
 El Salvador
-
 Estonia
-
 Eswatini
-
 Ethiopia
-
 Finland
-
 France
-
 Georgia
-
 Germany
-
 Ghana
Ghana
-
 Greece
-
 Haiti
Haiti
-
 Hong Kong
-
 Hungary
-
 India
India
-
 Indonesia
-
 Iran, Islamic republic
-
 Iraq
Iraq
-
 Ireland
-
 Israel
-
 Italy
Italy
-
 Jamaica
-
 Japan
Japan
-
 Jordan
-
 Kazakhstan
-
 Kenya
Kenya
-
 Korea
Korea
-
 Kuwait
-
 Kyrgyzstan
-
 Laos
Laos
-
 Latvia
-
 Lebanon
-
 Lesotho
-
 Libya
Libya
-
 Lithuania
-
 Luxembourg
-
 Madagascar
-
 Malaysia
-
 Malta
Malta
-
 Mauritius
-
 Mexico
-
 Moldova
-
 Mongolia
-
 Montenegro
-
 Morocco
-
 Mozambique
-
 Myanmar
-
 Namibia
-
 Nepal
Nepal
-
 Netherlands
-
 New Zealand
-
 Nigeria
-
 North Macedonia
-
 Norway
-
 Oman
Oman
-
 Pakistan
-
 Palestine
-
 Panama
-
 Papua New Guinea
-
 Paraguay
-
 Peru
Peru
-
 Philippines
-
 Poland
-
 Portugal
-
 Puerto Rico
-
 Qatar
Qatar
-
 Reunion
-
 Romania
-
 Rwanda
-
 Saudi Arabia
-
 Serbia
-
 Singapore
-
 Slovakia
-
 Slovenia
-
 Somalia
-
 South Africa
-
 Spain
Spain
-
 Sri Lanka
-
 Sweden
-
 Switzerland
-
 Syria
Syria
-
 Taiwan
-
 Tajikistan
-
 Tanzania
-
 Thailand
-
 Trinidad and Tobago
-
 Tunisia
-
 Turkey
-
 UAE
UAE
-
 Uganda
-
 Ukraine
-
 United Kingdom
-
United States
-
 Uruguay
-
 Uzbekistan
-
 Venezuela
-
 Vietnam
-
 Yemen
Yemen
-
 Zambia
-
 Zimbabwe
- Forex
- Crypto
