Best Indicators For Forex Scalping


Editorial Note: While we adhere to strict Editorial Integrity, this post may contain references to products from our partners. Here's an explanation for How We Make Money. None of the data and information on this webpage constitutes investment advice according to our Disclaimer.
The best indicators for scalping trading are:
Forex scalping requires precise and quick decision making, and choosing the right indicators plays a key role here. These tools help traders quickly find profitable entry and exit points, minimizing risks and increasing the chances of successful trades. Key indicators for Forex scalping are those that allow you to quickly analyze the market and identify short-term price fluctuations. In this article, we will walk through nine of the best indicators that will help traders navigate high volatility conditions and make a profit on price fluctuations.
Best indicators for scalping strategy on Forex
Scalping can be an extremely profitable strategy, but it requires a lot of effort. However, this method is suitable for traders who are willing to spend a lot of time trading and take on increased risks. Successful scalping requires practice, a deep understanding of the market, and the ability to analyze charts and indicators to accurately choose entry and exit points. Success in scalping is the result of a well-thought-out strategy, risk management, and constant learning. And in this business, you cannot do without trading indicators. Study them and apply them in your trades using a scalping strategy.
Bollinger Bands

Bollinger Bands are a popular tool for assessing market volatility and finding entry and exit points. They consist of three lines on a price chart: a central moving average (SMA) and two standard deviation lines above and below it. The width of the bands changes dynamically with volatility: as volatility increases, the bands widen and as volatility decreases, they narrow. This helps traders see possible trend reversal levels and overbought or oversold conditions. When the price touches the upper band, it may signal overbought conditions, while the lower band may signal oversold conditions. Narrowing bands often herald a sharp price move, which traders can watch for entry or exit points.
Relative strength index (RSI)
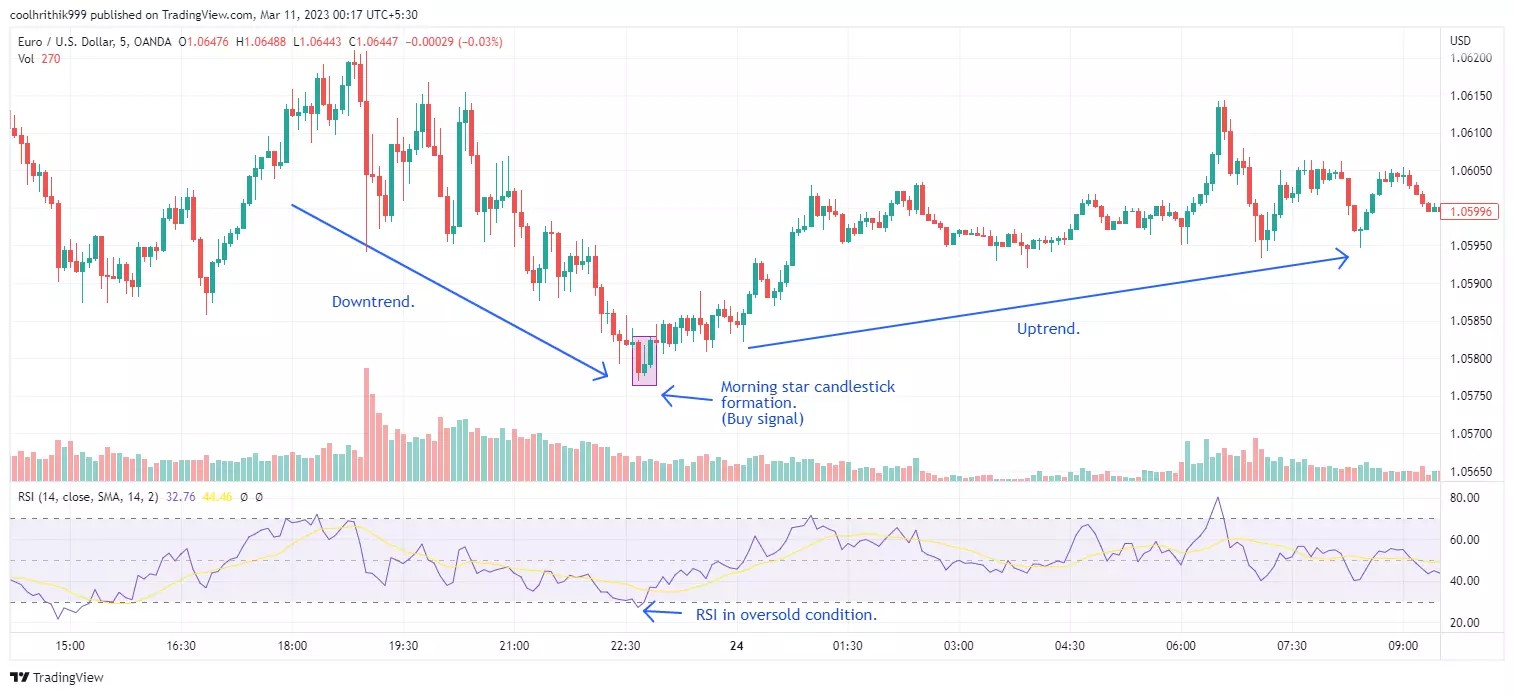
The Relative Strength Index (RSI) is a widely used oscillator that shows the momentum of a price movement and whether an asset is overbought or oversold. The RSI ranges from 0 to 100, with a reading above 50 indicating a bullish trend and below 50 indicating a bearish trend. Above 70, the asset may be considered overbought, while below 30, it may be oversold. RSI can also help detect divergences between price and momentum, which may indicate a trend reversal. RSI analyzes the momentum of an asset based on its past prices, rather than comparing it to other assets.
Example of entry and exit points: An RSI reading above 70 can suggest overbought conditions and signal a sell order, while below 30 may indicate oversold conditions, indicating a buy order. For greater accuracy, traders can wait for the RSI to change direction or use it in conjunction with other indicators.
Simple moving average
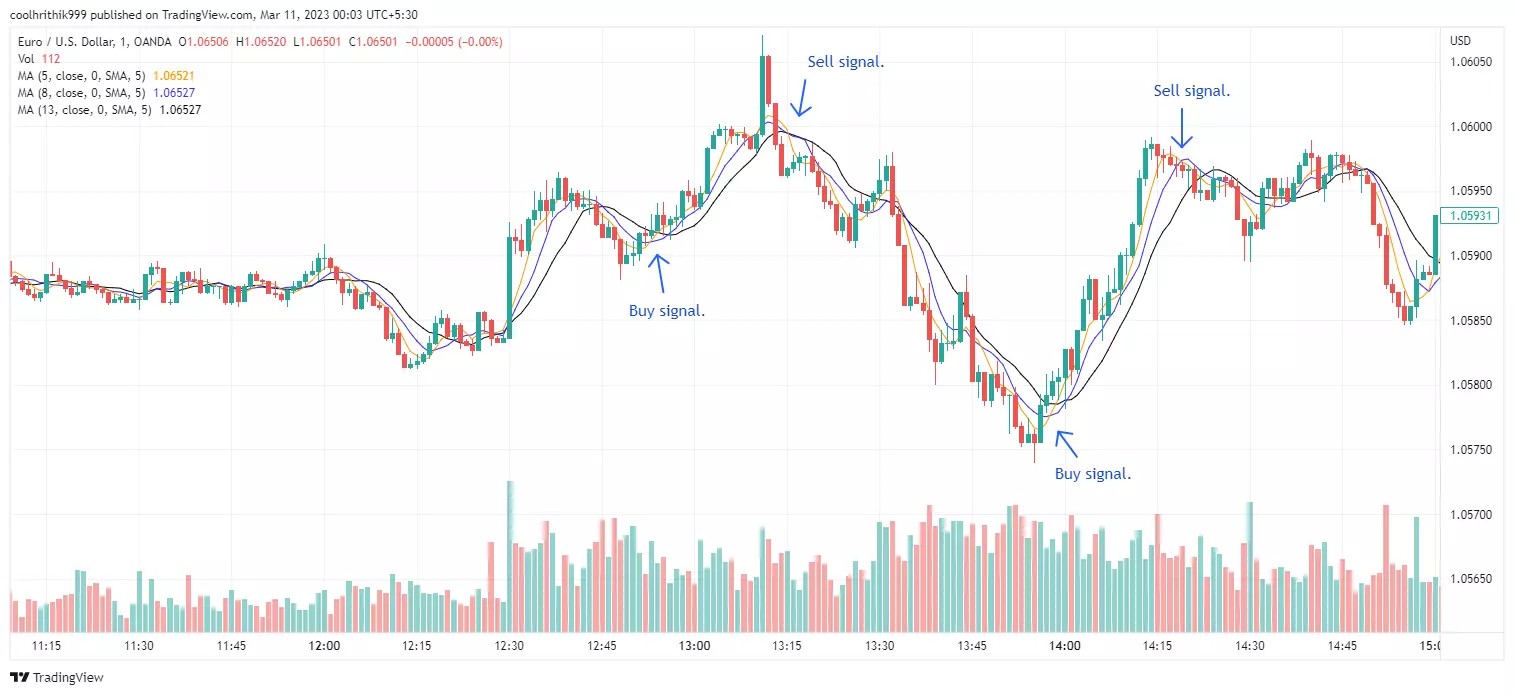
Simple Moving Averages (SMA) help traders determine the direction of a market trend by updating as new data comes in. They show support and resistance zones by analyzing the price movement of an asset, but due to their lagging nature, they only reflect past price dynamics.
Example of entry and exit points: The intersection of moving averages can signal a change in trend. If the short SMA crosses the long one from above, this indicates a possible increase and a buy signal. The opposite intersection indicates a decrease and a sell signal. Traders often combine SMA with other indicators to make their strategies more precise.
Exponential moving average
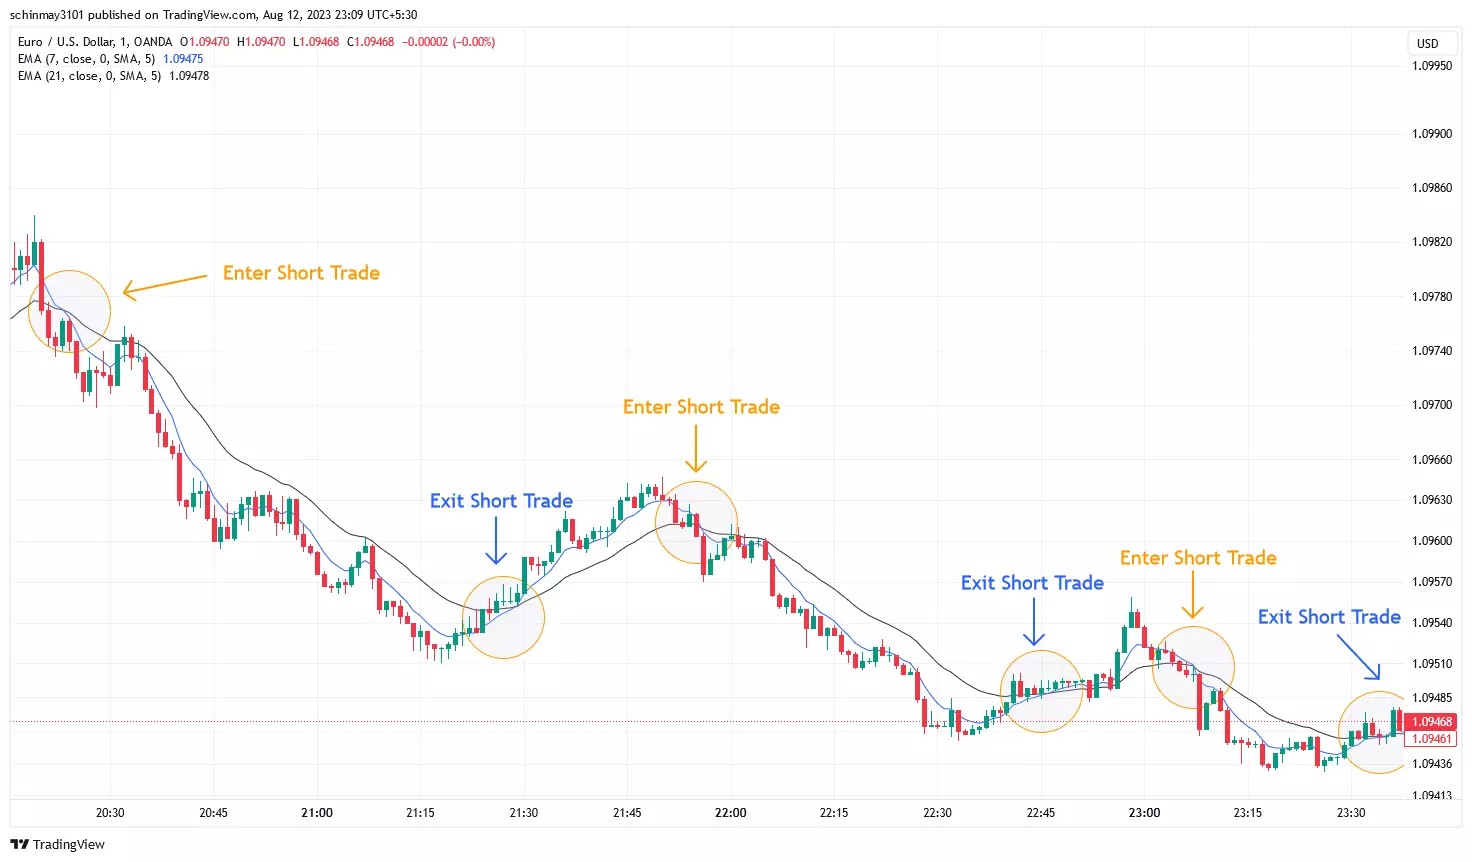
An exponential moving average (EMA) is a moving average that places more weight on recent data points, allowing it to react more quickly to recent price changes. Unlike a simple moving average (SMA), an EMA is more sensitive to recent data, making it popular with traders looking for quick entry and exit signals. This flexibility helps track current trends across different time frames.
Example of entry and exit points: A crossover between the short EMA and the long EMA from above can indicate an uptrend and serve as a buy signal. A reverse crossover signals a downtrend, which is good for exiting a trade or going short. By combining EMA with support and resistance levels, traders can increase the accuracy of their decisions.
Parabolic stop and reverse (SAR)
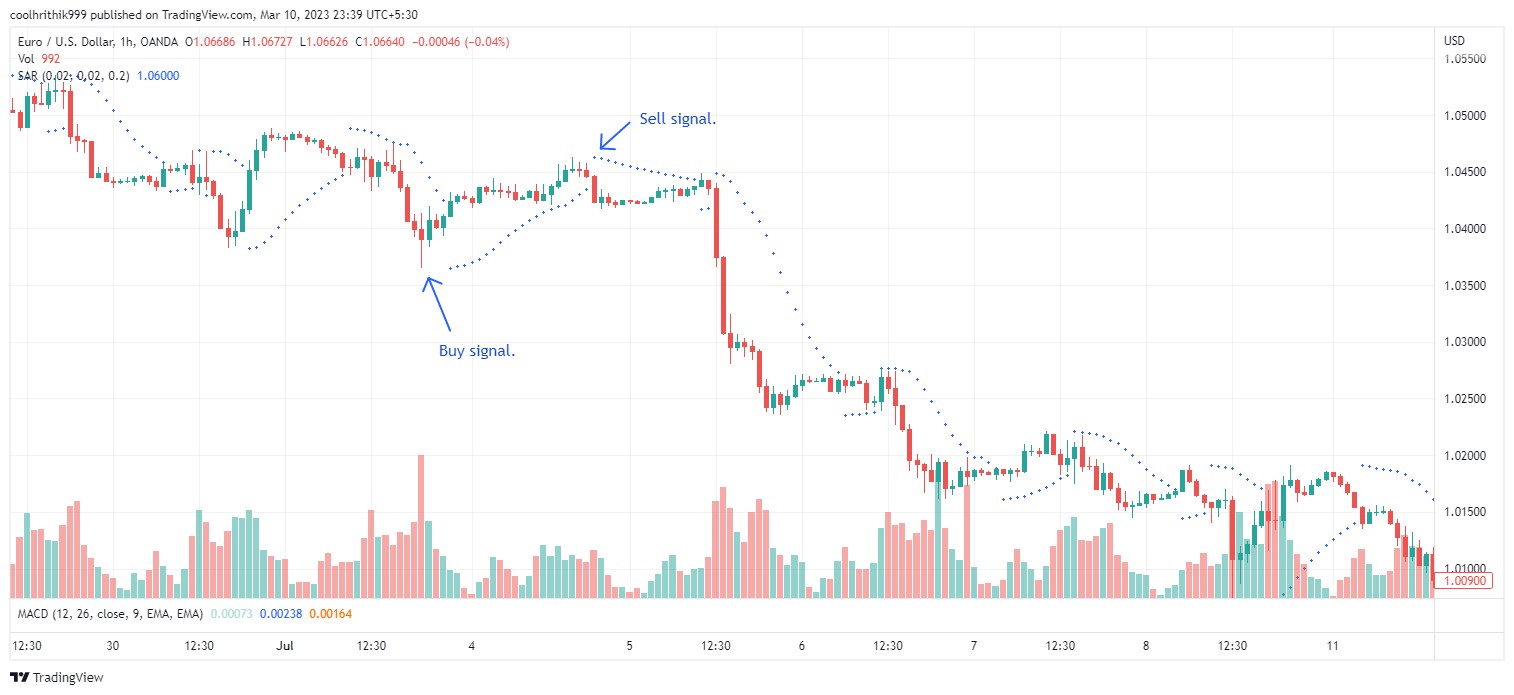
The Parabolic Stop and Reverse (SAR) indicator is a helpful tool for identifying stop-loss levels and potential trend reversals. It places dots on a chart to show the direction of the trend: dots below the price indicate an uptrend, while dots above the price suggest a downtrend. The indicator adjusts to market conditions, with dots moving closer to the price during stable periods and spreading out during more volatile times. This feature helps traders set stop losses that adapt to changing market dynamics and manage risk efficiently.
Example of entry and exit points: In an uptrend, when the price crosses above the SAR dots, it signals a possible buying opportunity. On the flip side, in a downtrend, when the price moves below the SAR dots, it’s seen as a signal to sell. Traders also use the dots as trailing stop-loss levels, securing gains as the trend continues. When the dots switch from above to below the price (or vice versa), it indicates a potential trend change, encouraging traders to reconsider their positions. Pairing Parabolic SAR with other indicators, like moving averages, can improve trade decisions and timing.
Moving average convergence divergence (MACD)
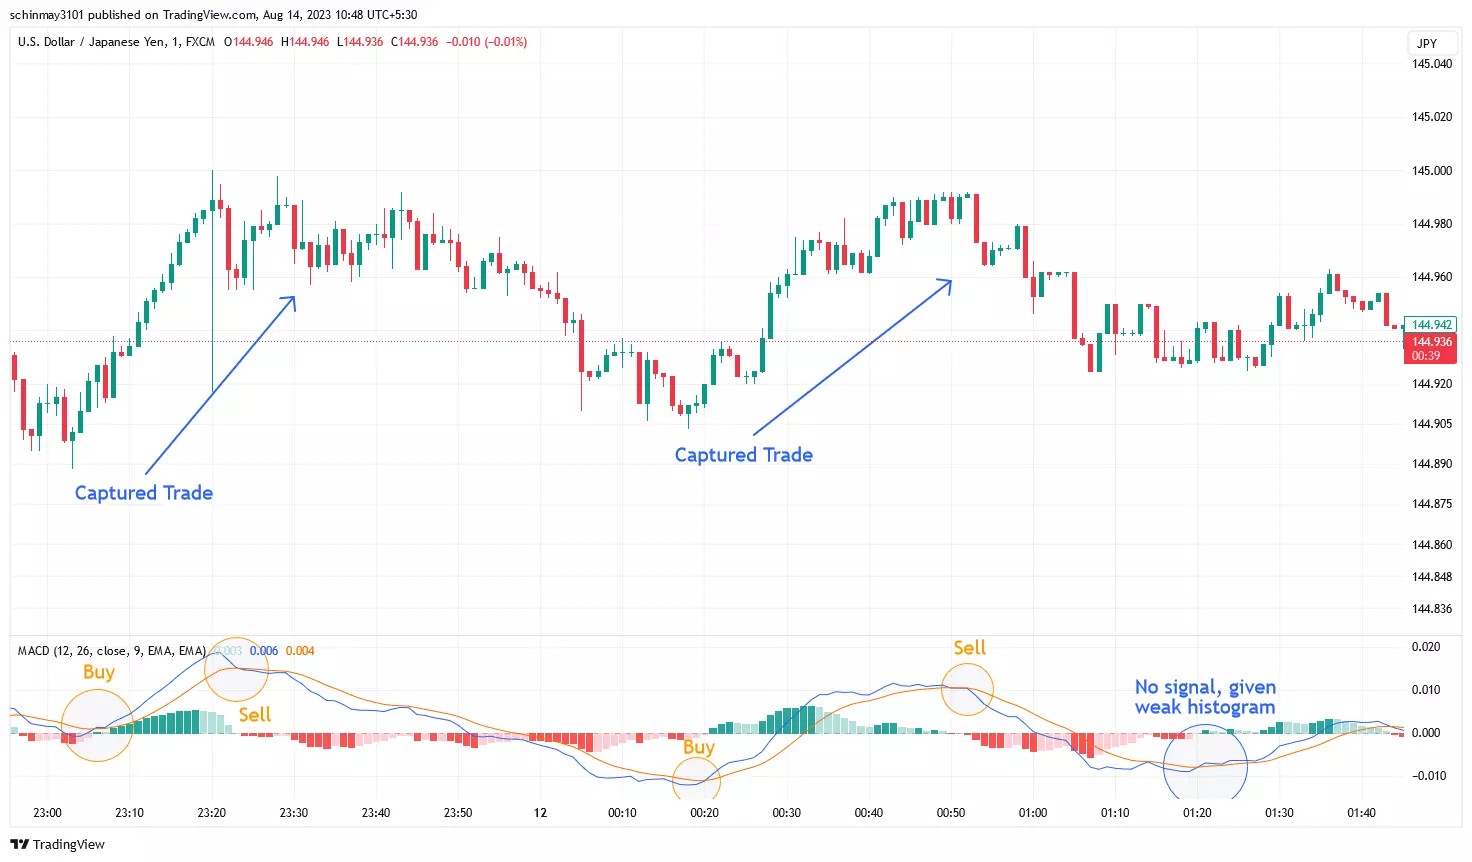
Moving Average Convergence Divergence (MACD) is an indicator that generates signals based on the ratios of exponential moving averages (EMA). It consists of a MACD line, a signal line, and a histogram that reflects the trend. The MACD line is calculated as the difference between the 12- and 26-period EMAs, showing the momentum, and the signal line (9-period EMA MACD) shows the strength of the trend. Crossings of the MACD and signal lines give signals to buy (higher) or sell (lower), and the passage of the MACD line through zero confirms the direction of the trend.
Example of entry and exit points: an uptrend is shown when the MACD crosses the zero line from above, and a downtrend - from below. MACD crossing above the signal line is a buy signal, below - a sell signal. The length of the histogram bars helps to assess the strength of the signal, and using MACD with other indicators increases accuracy.
Stochastic Oscillator
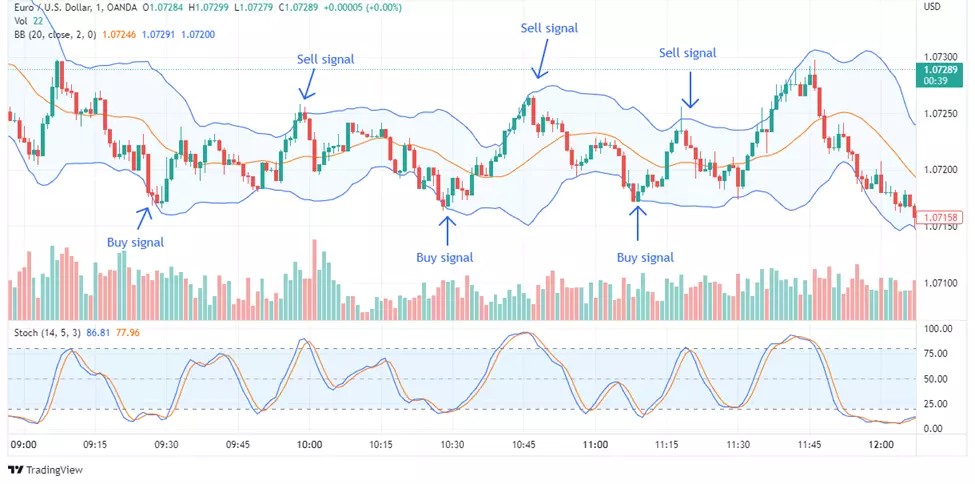
The Stochastic Oscillator is a momentum indicator that compares the closing price of an asset to its range over a given period, helping to identify overbought (above 80) and oversold (below 20) conditions on a range from 0 to 100. It consists of two lines: the current oscillator line and its three-day moving average. Crossovers between these lines indicate potential trend reversals, while divergences between the oscillator and price may signal a change in momentum.
Example of entry and exit points: When %K crosses %D from above, it may be a buy signal, while crossing below may be a sell signal. %K values above 80 and below 20 may indicate potential reversal points. Using Stochastic with other indicators, such as Bollinger Bands, can improve decision accuracy and risk management.
Volume weighted average price (VWAP)
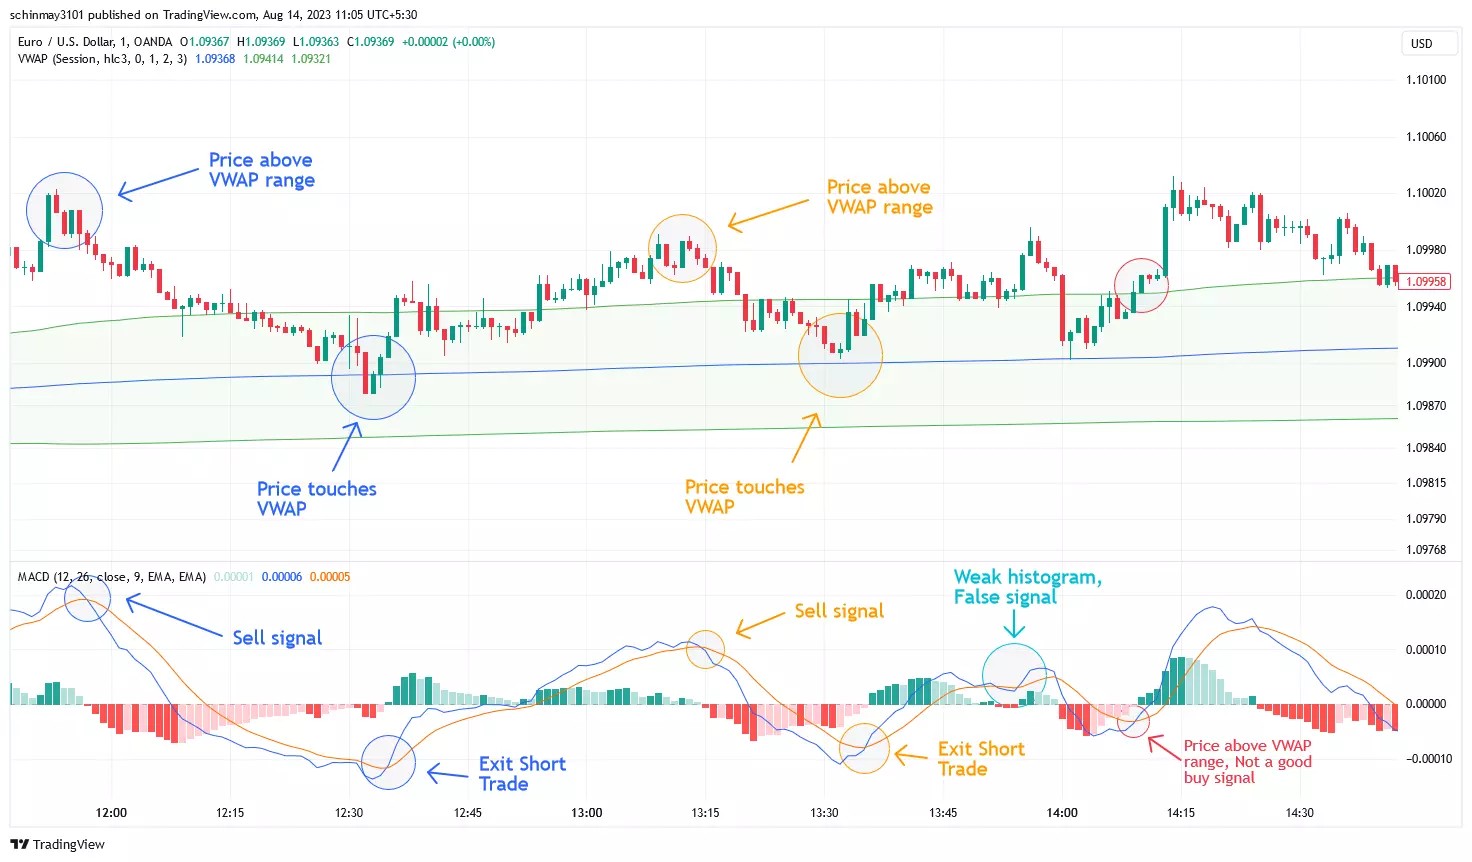
Volume-weighted average price (VWAP) reflects the average price of an asset traded over a given period, taking into account volume. It is calculated as the total dollar value of trades divided by the total number of shares, which gives a more accurate representation of the average price than a simple average. VWAP is actively used in algorithmic trading, helping to optimize large-volume trades and assess market liquidity: high values indicate high trading activity, low values indicate decreased liquidity.
Example of entry and exit points: a price above the VWAP may indicate a sell opportunity, while a price below it may indicate a buy opportunity. Monitoring the price relative to the VWAP helps to assess the strength of a trend, and combining VWAP with other indicators, such as MACD, improves the accuracy of entry and exit decisions.
Fibonacci Retracement
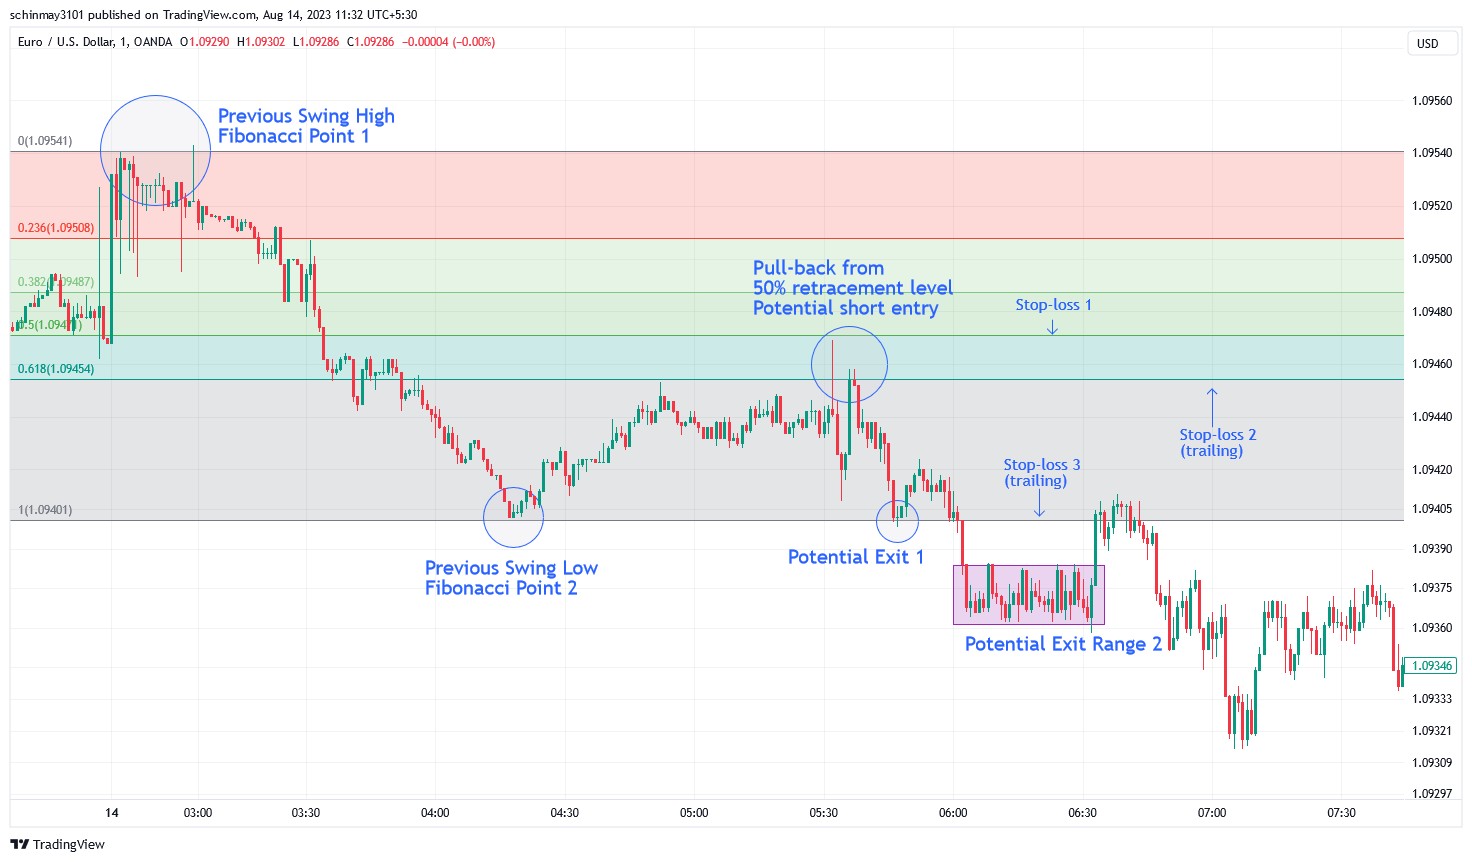
Fibonacci retracements are a popular technical analysis tool that helps identify support and resistance levels based on the Fibonacci sequence. The major levels (23.6%, 38.2%, 50%, 61.8%, and 78.6%) indicate potential reversal points after significant market moves, allowing traders to assess where the price may pull back before continuing the trend. This tool helps in identifying entry points, setting stop losses, and analyzing market dynamics, giving traders more confidence in their decisions.
Example of entry and exit points: Fibonacci levels such as 23.6% and 61.8% often act as support or resistance. Traders can enter positions at these levels, expecting a reversal. Using Fibonacci retracements with other indicators increases accuracy and helps improve trading strategies.
| Scalping | Min. deposit, $ | One click trading | ECN Commission | ECN Spread EUR/USD | MT5 | Trading bots (EAs) | Free VPS | Open account | |
|---|---|---|---|---|---|---|---|---|---|
| Yes | 10 | Yes | 7 | 0.1 | Yes | Yes | Yes | Go to broker Your capital is at risk.
|
|
| No | 100 | No | No | No | No | No | No | Go to broker 80% of retail CFD accounts lose money. |
|
| Yes | No | Yes | 3.5 | 0.15 | Yes | Yes | Yes | Go to broker Your capital is at risk. |
|
| Yes | 50 | Yes | No | No | Yes | Yes | No | Go to broker Your capital is at risk. |
|
| Yes | 100 | Yes | 5 | 0.2 | Yes | Yes | Yes | Study review |
Tips for using a scalping strategy
If you are considering taking up scalping as your trading style, the following expert tips might help you:
Learn the basics - before diving in, understand the basics of scalping, including its strategies, risks, and rewards.
Quick decision making - develop the ability to make rapid decisions based on technical signals and price action.
Minimal exposure - avoid holding positions for extended periods to reduce exposure to market risks.
Tight spreads - trade in markets with low spreads to minimize trading costs, which are critical in scalping.
Limited indicators - focus on a few key indicators that align with your strategy instead of overcrowding your charts.
Profit targets and stop-loss - set clear profit targets and stop-loss levels to secure gains and mitigate losses.
Continuous learning - stay updated with market trends, trading techniques, and refine your skills through continuous learning.
Not all indicators are created equal

When diving into scalping, it's crucial to recognize that not all indicators are created equal. While tools like the Relative Strength Index (RSI) and Moving Averages are popular, integrating the Volume-Weighted Average Price (VWAP) can offer a unique edge. VWAP provides insight into the average price of an asset, weighted by volume, over a specific period. This means it reflects both price and trading activity, helping you identify true market value. By comparing the current price to the VWAP, you can gauge whether an asset is trading at a premium or discount, aiding in more informed entry and exit decisions.
Another often overlooked yet powerful tool is the Stochastic Oscillator. Unlike RSI, which measures the speed and change of price movements, the Stochastic Oscillator compares a particular closing price to a range of its prices over a certain period. This can be particularly useful in choppy markets where traditional trend indicators may falter. By focusing on the relationship between the closing price and its price range, the Stochastic Oscillator can help you spot potential reversals and overbought or oversold conditions with greater precision. Incorporating these indicators into your scalping strategy can provide a more nuanced understanding of market dynamics, enhancing your ability to make swift and informed trading decisions.
Conclusion
Forex scalping is a dynamic strategy that requires a trader to be highly focused, react quickly, and understand the market. Selecting the right indicators plays an important role in the accuracy of trades and allows you to more effectively determine entry and exit points. Although scalping can be profitable, it is also associated with high risks, so proper capital management and strict stop-loss orders are a must. Combining several indicators and thoroughly testing the chosen strategy will help minimize errors. Remember that success in scalping requires constant learning and adaptation to changing market conditions.
FAQs
What are the most common mistakes newbies make in scalping?
Newbies often rush into and out of trades without waiting for confirmation and overuse the number of trades. They also sometimes ignore risk management, which leads to losses in a highly volatile market.
What role does trading volume play in scalping?
Trading volumes help to assess the strength of the current trend - high volumes when the price is rising signal a strong trend, while a decrease in volume when the price is rising may indicate that the trend is fading. Scalpers often use volume indicators to confirm entries and exits.
How to correctly determine the time for entry and exit when scalping?
Answer: The time for entry and exit is often determined not only by indicators, but also by observing market activity. Waiting for strong movements at the opening of sessions and important news can provide better opportunities for scalping, when volatility and volumes are usually higher.
Should you use robots and algorithms for scalping?
Automated algorithms can be useful for quickly responding to signals, but they require careful tuning and testing. The market is changing, and trading robots must be updated regularly and adapted to new conditions to be effective.
Editors' Top Picks and Insights

Three trends that could reshape the crypto market over the next decade

Trump financial disclosure: How the president's crypto income became a U.S. ethics issue

Code red: What's behind Bitcoin’s sharp selloff?

MiCA is live: How EU new rules are changing crypto market

Bitcoin price prediction based on MVRV: Indicator points to BTC undervaluation

Amazon flooded with AI books: Crisis of trust in literature market
Related Articles
Team that worked on the article
Andrey Mastykin is an experienced author, editor, and content strategist who has been with Traders Union since 2020. As an editor, he is meticulous about fact-checking and ensuring the accuracy of all information published on the Traders Union platform.
Chinmay Soni is a financial analyst with more than 5 years of experience in working with stocks, Forex, derivatives, and other assets. As a founder of a boutique research firm and an active researcher, he covers various industries and fields, providing insights backed by statistical data.
Mirjan Hipolito is a journalist and news editor at Traders Union. She is an expert crypto writer with five years of experience in the financial markets.
The Stochastic Oscillator is a technical indicator used in financial analysis to gauge the momentum of a security's price and identify overbought or oversold conditions by comparing the closing price to a specified price range over a defined period.
Forex indicators are tools used by traders to analyze market data, often based on technical and/or fundamental factors, to make informed trading decisions.
Algorithmic trading is an advanced method that relies on advanced coding and formulas based on a mathematical model. However, compared to traditional trading methods, the process differs by being automated.
The deviation is a statistical measure of how much a set of data varies from the mean or average value. In forex trading, this measure is often calculated using standard deviation that helps traders in assessing the degree of variability or volatility in currency price movements.
Price action trading is a trading strategy that relies primarily on the analysis of historical price movements and patterns in financial markets, such as stocks, currencies, or commodities. Traders who use this approach focus on studying price charts, candlestick patterns, support and resistance levels, and other price-related data to make trading decisions.

-
 Afghanistan
-
 Albania
-
 Algeria
-
 Angola
-
 Argentina
-
 Armenia
-
 Australia
-
 Austria
-
 Azerbaijan
-
 Bahamas
-
 Bahrain
-
 Bangladesh
-
 Belarus
-
 Belgium
-
 Bolivia
-
 Botswana
-
 Brazil
-
 Brunei
-
 Bulgaria
-
 Cambodia
-
 Cameroon
-
 Canada
-
 Chile
Chile
-
 China
China
-
 Colombia
-
 Congo
Congo
-
 Costa Rica
-
 Cote d'Ivoire
-
 Croatia
-
 Cuba
Cuba
-
 Cyprus
-
 Czechia
-
 DR Congo
-
 Denmark
-
 Dominican Republic
-
 Ecuador
-
 Egypt
Egypt
-
 El Salvador
-
 Estonia
-
 Eswatini
-
 Ethiopia
-
 Finland
-
 France
-
 Georgia
-
 Germany
-
 Ghana
Ghana
-
 Greece
-
 Haiti
Haiti
-
 Hong Kong
-
 Hungary
-
 India
India
-
 Indonesia
-
 Iran, Islamic republic
-
 Iraq
Iraq
-
 Ireland
-
 Israel
-
 Italy
Italy
-
 Jamaica
-
 Japan
Japan
-
 Jordan
-
 Kazakhstan
-
 Kenya
Kenya
-
 Korea
Korea
-
 Kuwait
-
 Kyrgyzstan
-
 Laos
Laos
-
 Latvia
-
 Lebanon
-
 Lesotho
-
 Libya
Libya
-
 Lithuania
-
 Luxembourg
-
 Madagascar
-
 Malaysia
-
 Malta
Malta
-
 Mauritius
-
 Mexico
-
 Moldova
-
 Mongolia
-
 Montenegro
-
 Morocco
-
 Mozambique
-
 Myanmar
-
 Namibia
-
 Nepal
Nepal
-
 Netherlands
-
 New Zealand
-
 Nigeria
-
 North Macedonia
-
 Norway
-
 Oman
Oman
-
 Pakistan
-
 Palestine
-
 Panama
-
 Papua New Guinea
-
 Paraguay
-
 Peru
Peru
-
 Philippines
-
 Poland
-
 Portugal
-
 Puerto Rico
-
 Qatar
Qatar
-
 Reunion
-
 Romania
-
 Rwanda
-
 Saudi Arabia
-
 Serbia
-
 Singapore
-
 Slovakia
-
 Slovenia
-
 Somalia
-
 South Africa
-
 Spain
Spain
-
 Sri Lanka
-
 Sweden
-
 Switzerland
-
 Syria
Syria
-
 Taiwan
-
 Tajikistan
-
 Tanzania
-
 Thailand
-
 Trinidad and Tobago
-
 Tunisia
-
 Turkey
-
 UAE
UAE
-
 Uganda
-
 Ukraine
-
 United Kingdom
-
United States
-
 Uruguay
-
 Uzbekistan
-
 Venezuela
-
 Vietnam
-
 Yemen
Yemen
-
 Zambia
-
 Zimbabwe
- Forex
- Crypto
