Trading Divergence In Forex | Learn All About


Editorial Note: While we adhere to strict Editorial Integrity, this post may contain references to products from our partners. Here's an explanation for How We Make Money. None of the data and information on this webpage constitutes investment advice according to our Disclaimer.
Trading divergence in Forex involves identifying when the price of a currency pair and an oscillator (such as RSI, MACD, or Stochastic) move in opposite directions, indicating potential trend reversals or continuations. By spotting these divergences, traders can make informed decisions on entry and exit points to optimize their trading strategies.
Divergence occurs when the price of an asset moves in the opposite direction of a technical indicator, such as the Relative Strength Index (RSI) or Moving Average Convergence Divergence (MACD). This discrepancy can signal an impending change in the trend. From this article you will learn what is divergence in Forex, read the step-by-step guide to trading divergence successfully.
What is divergence in Forex?
In Forex trading, divergence occurs when the price of a currency pair moves in the opposite direction to a technical indicator. This discrepancy can signal potential trend reversals or continuations.
Divergence is typically classified into two types: regular divergence, which indicates a possible reversal in the direction of the trend, and hidden divergence, which suggests a potential continuation of the current trend.
Regular divergence
Regular divergence is a powerful technical analysis tool used to identify potential trend reversals. It occurs when the price of an asset and an indicator (such as the Relative Strength Index (RSI), Moving Average Convergence Divergence (MACD), or stochastic oscillator) move in opposite directions. This discrepancy between the price and the indicator suggests that the current trend may be losing momentum and a reversal could be imminent.
Bearish regular divergence
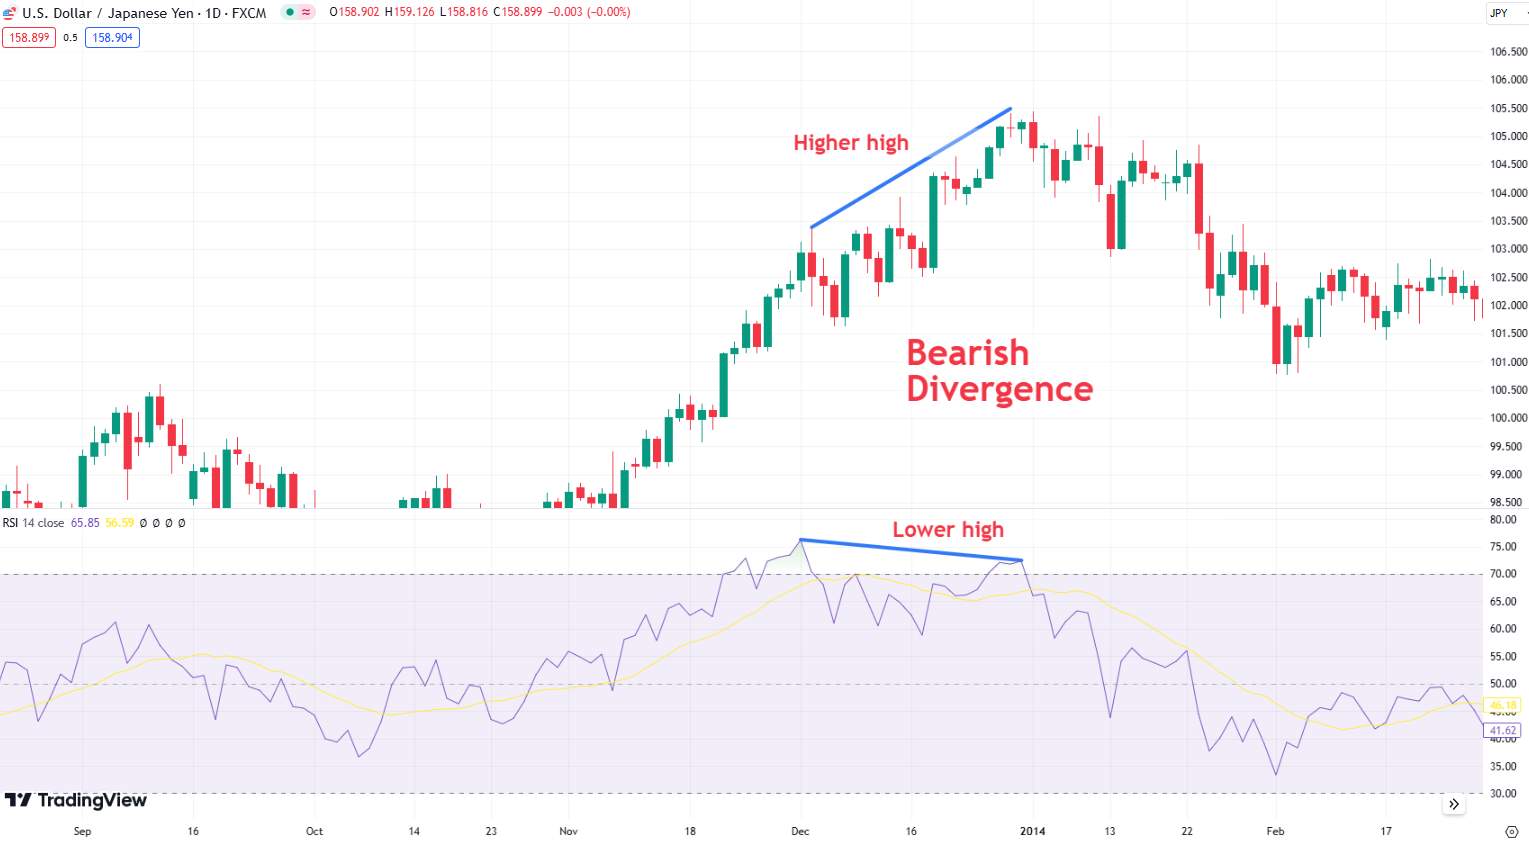
Bearish regular divergence signals a potential reversal from an uptrend to a downtrend. It is identified when the price makes higher highs, but the indicator makes lower highs. This indicates that despite the higher price peaks, the underlying momentum is weakening, and the bullish trend may be about to reverse.
Example of bearish regular divergence:
Price Action: Higher highs.
Indicator Action: Lower highs.
Interpretation: The uptrend is weakening; a reversal to a downtrend may occur.

Bullish Regular Divergence
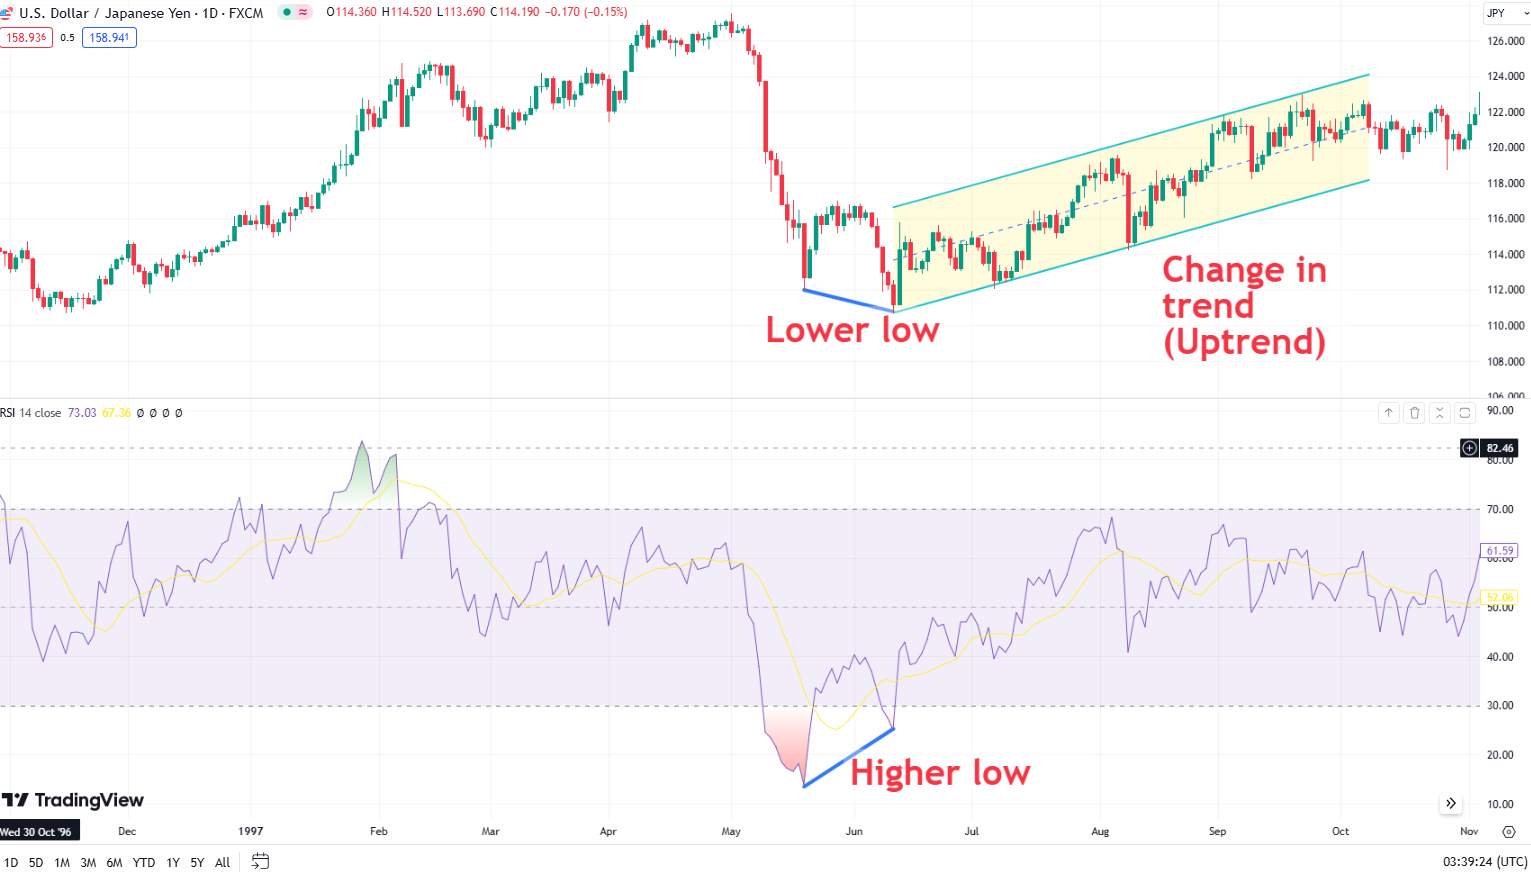
Bullish regular divergence indicates a potential reversal from a downtrend to an uptrend. It is identified when the price makes lower lows, but the indicator makes higher lows. This suggests that even though the price is reaching new lows, the selling momentum is weakening, and the downtrend might be about to reverse.
Example of Bullish Regular Divergence:
Price Action: Lower lows.
Indicator Action: Higher lows.
Interpretation: The downtrend is weakening; a reversal to an uptrend may occur.

Hidden divergence
Hidden divergence suggests a continuation of the current trend. For instance, if the price makes higher lows while the indicator makes lower lows, it indicates that the uptrend is likely to continue. In the provided EUR/USD chart, bearish hidden divergence is identified as the price forms a lower low while the RSI forms a higher low. This indicates that despite a temporary dip in momentum, the overall downtrend is likely to continue, suggesting a potential selling opportunity.

Step-by-step guide to trading divergence
Step 1: Identify the trend
Understanding the prevailing trend is crucial before looking for divergence signals. Use tools like trendlines and moving averages to determine the trend direction. If the price is consistently making higher highs and higher lows, it indicates an uptrend. Conversely, if the price is making lower highs and lower lows, it indicates a downtrend.
Step 2: Spot divergence
Look for higher highs and lower lows in price action and compare these with the oscillator’s peaks and troughs to identify divergence.
Step 3: Confirm divergence
Confirm divergence signals with multiple indicators or other technical analysis tools, such as support and resistance levels or candlestick patterns. Look for patterns like doji, hammer, or engulfing that confirm divergence signals.
Step 4: Enter the trade
Determine entry points based on divergence signals. Place stop-loss orders to manage risk effectively.
Step 5: Manage the trade
Monitor the trade, taking profits and adjusting stop-loss levels as necessary to protect gains.
When trading divergence in Forex, it's crucial to choose a broker that offers reliable charting tools, a variety of technical indicators, and a robust trading platform. Here are some brokers known for their excellent trading platforms and tools suited for divergence trading:
| Trading platform | Demo | Min. deposit, $ | Leverage, 1: | Payment methods | Open account | |
|---|---|---|---|---|---|---|
| MT5 | Yes | 10 | Up to 1:400 | Bank transfer, payment cards | Go to broker Your capital is at risk.
|
|
| WebTrader, Mobile application | Yes | 100 | Up to 1:30 or 1:300 (for professional accounts only; trading with such leverage forfeits ICF rights) | Visa, Mastercard, e-wallets (Skrill, PayPal, and others), bank transfer | Go to broker 80% of retail CFD accounts lose money. |
|
| MT5, WebTrader, Trading.com App | Yes | 50 | Up to 1:200 | Visa, Mastercard, Skrill, Neteller and various Alternate Payment Methods | Go to broker Your capital is at risk. |
|
| MetaTrader4 | Yes | No | Up to 1:50 | Bank transfers, ACH | Go to broker Your capital is at risk. |
|
| FOREX.com, MT4, MT5 | Yes | 100 | Up to 1:1000 | Bank cards Visa/MasterCard, cryptocurrencies, and WebMoney | Study review |
Important considerations when trading divergence
Time frames and market conditions
Divergence can be identified on various time frames, but it is generally more reliable on higher time frames such as the 4-hour or daily charts. These longer periods help filter out noise and provide clearer signals. The best market conditions for divergence setups are trending markets with clear price swings. During strong trends, divergence can indicate weakening momentum and potential reversals.
Choosing the right oscillator
Different oscillators have unique characteristics. The Relative Strength Index (RSI) and Moving Average Convergence Divergence (MACD) are popular choices due to their effectiveness in identifying divergence.
RSI: Measures the speed and change of price movements. It is useful for identifying overbought or oversold conditions.
MACD: Shows the relationship between two moving averages of a security’s price. It helps in identifying changes in the strength, direction, momentum, and duration of a trend.
Choose an oscillator that suits your trading style and strategy. For instance, RSI might be more suitable for short-term traders, while MACD could benefit long-term traders.
Combining divergence with other strategies
Divergence signals can be more powerful when combined with other technical setups such as trendlines, support and resistance levels, and candlestick patterns. This multi-faceted approach enhances the reliability of the signals and reduces the risk of false positives.
Trendlines: Use trendlines to confirm the direction of the primary trend.
Support and Resistance: Look for divergence signals at significant support or resistance levels to increase the likelihood of a successful trade.

Candlestick Patterns: Incorporate candlestick patterns such as doji, hammer, or engulfing patterns to confirm divergence signals.

Tips for beginners
Beginners should focus on mastering the basics of Forex trading and technical analysis. Learn to read price charts and utilize indicators such as trendlines, support and resistance levels, RSI, and MACD.
Common Forex Trading Mistakes to Avoid:
Over-Reliance on a Single Indicator: Avoid depending solely on one indicator, as it can lead to misleading signals. Use multiple indicators for more accurate analysis.
Ignoring Market Context: Always consider the broader market context, including economic news and geopolitical events.
Neglecting Strategy Backtesting: Backtest your trading strategies with historical data to understand their effectiveness before live trading.
Practical Forex Trading Advice:
Use a Demo Account: Start with a demo account to practice trading without risking real money. This helps in understanding market mechanics and testing strategies.
Maintain a Trading Journal: Keep detailed records of all trades, including entry and exit points, reasons for trades, and outcomes. Analyzing your trading journal helps improve your strategy.
All variants of divergence are considered an obvious trading signal, but it is characterized by technical contradictions, which beginner speculators do not take into account when making decisions. According to the theory, the divergence situation means that the current trend is weakening and the market is accumulating interest in a reversal.
Nevertheless, these calculations are performed without taking into account real volumes (or rather, their direction!), and therefore, without confirmation by volumetric sets, such as PinBar or reversal candlestick pattern, the divergence signal may turn out to be fake.
Divergence in Forex to be an invaluable tool for spotting potential trend reversals or continuations

By comparing price movements with indicators like RSI, MACD, and Stochastic Oscillator, divergence provides insights that aren't immediately apparent from price patterns alone. This technique often highlights shifts in market momentum before they become visible in the price action, allowing for more informed trading decisions.
However, it's essential to use divergence alongside other analyses to mitigate the risk of false signals, particularly in volatile markets. Integrating divergence into a broader strategy has significantly enhanced my trading accuracy and confidence.
Conclusion
Divergence in Forex is a pivotal tool for traders seeking to anticipate trend reversals or continuations by observing discrepancies between price action and popular oscillators like RSI or MACD. This technique is most powerful when combined with supporting strategies such as trendlines, support and resistance zones, and candlestick patterns—for example, spotting regular bearish divergence at a major resistance level significantly strengthens a trader’s conviction. However, traders must remain vigilant for false signals, especially when relying solely on technical indicators without considering market context or volumetric confirmation. The real value of divergence lies in its ability to highlight changes in momentum before they become clear in price alone, making it indispensable for refined, proactive decision-making. Ultimately, mastering divergence analysis empowers traders to enter the market with greater precision and confidence, enhancing the effectiveness of their overall strategy.
FAQs
How can different types of divergence affect Forex trading outcomes?
What are common mistakes to avoid when trading divergence in Forex?
Which time frames are most reliable for spotting divergence in Forex?
How can traders confirm divergence signals for better accuracy?
Editors' Top Picks and Insights

Hunting crypto owners: Why criminals have gone offline

BitMEX is shutting down: Why Trump could not save the exchange

Do governments need crypto workers?

Brent nears $100: Why oil prices are rising

Gram Wallet launch: Can Telegram bring crypto to the masses?

AI without limits: How dangerous are neural networks?
Related Articles
Team that worked on the article
Parshwa is a content expert and finance professional possessing deep knowledge of stock and options trading, technical and fundamental analysis, and equity research. As a Chartered Accountant Finalist, Parshwa also has expertise in Forex, crypto trading, and personal taxation.
Chinmay Soni is a financial analyst with more than 5 years of experience in working with stocks, Forex, derivatives, and other assets. As a founder of a boutique research firm and an active researcher, he covers various industries and fields, providing insights backed by statistical data.
Mirjan Hipolito is a journalist and news editor at Traders Union. She is an expert crypto writer with five years of experience in the financial markets.
Copy trading is an investing tactic where traders replicate the trading strategies of more experienced traders, automatically mirroring their trades in their own accounts to potentially achieve similar results.
Backtesting is the process of testing a trading strategy on historical data. It allows you to evaluate the strategy's performance in the past and identify its potential risks and benefits.
Forex indicators are tools used by traders to analyze market data, often based on technical and/or fundamental factors, to make informed trading decisions.
The Stochastic Oscillator is a technical indicator used in financial analysis to gauge the momentum of a security's price and identify overbought or oversold conditions by comparing the closing price to a specified price range over a defined period.
Fundamental analysis is a method or tool that investors use that seeks to determine the intrinsic value of a security by examining economic and financial factors. It considers macroeconomic factors such as the state of the economy and industry conditions.

-
 Afghanistan
-
 Albania
-
 Algeria
-
 Angola
-
 Argentina
-
 Armenia
-
 Australia
-
 Austria
-
 Azerbaijan
-
 Bahamas
-
 Bahrain
-
 Bangladesh
-
 Belarus
-
 Belgium
-
 Bolivia
-
 Botswana
-
 Brazil
-
 Brunei
-
 Bulgaria
-
 Cambodia
-
 Cameroon
-
 Canada
-
 Chile
Chile
-
 China
China
-
 Colombia
-
 Congo
Congo
-
 Costa Rica
-
 Cote d'Ivoire
-
 Croatia
-
 Cuba
Cuba
-
 Cyprus
-
 Czechia
-
 DR Congo
-
 Denmark
-
 Dominican Republic
-
 Ecuador
-
 Egypt
Egypt
-
 El Salvador
-
 Estonia
-
 Eswatini
-
 Ethiopia
-
 Finland
-
 France
-
 Georgia
-
 Germany
-
 Ghana
Ghana
-
 Greece
-
 Haiti
Haiti
-
 Hong Kong
-
 Hungary
-
 India
India
-
 Indonesia
-
 Iran, Islamic republic
-
 Iraq
Iraq
-
 Ireland
-
 Israel
-
 Italy
Italy
-
 Jamaica
-
 Japan
Japan
-
 Jordan
-
 Kazakhstan
-
 Kenya
Kenya
-
 Korea
Korea
-
 Kuwait
-
 Kyrgyzstan
-
 Laos
Laos
-
 Latvia
-
 Lebanon
-
 Lesotho
-
 Libya
Libya
-
 Lithuania
-
 Luxembourg
-
 Madagascar
-
 Malaysia
-
 Malta
Malta
-
 Mauritius
-
 Mexico
-
 Moldova
-
 Mongolia
-
 Montenegro
-
 Morocco
-
 Mozambique
-
 Myanmar
-
 Namibia
-
 Nepal
Nepal
-
 Netherlands
-
 New Zealand
-
 Nigeria
-
 North Macedonia
-
 Norway
-
 Oman
Oman
-
 Pakistan
-
 Palestine
-
 Panama
-
 Papua New Guinea
-
 Paraguay
-
 Peru
Peru
-
 Philippines
-
 Poland
-
 Portugal
-
 Puerto Rico
-
 Qatar
Qatar
-
 Reunion
-
 Romania
-
 Rwanda
-
 Saudi Arabia
-
 Serbia
-
 Singapore
-
 Slovakia
-
 Slovenia
-
 Somalia
-
 South Africa
-
 Spain
Spain
-
 Sri Lanka
-
 Sweden
-
 Switzerland
-
 Syria
Syria
-
 Taiwan
-
 Tajikistan
-
 Tanzania
-
 Thailand
-
 Trinidad and Tobago
-
 Tunisia
-
 Turkey
-
 UAE
UAE
-
 Uganda
-
 Ukraine
-
 United Kingdom
-
United States
-
 Uruguay
-
 Uzbekistan
-
 Venezuela
-
 Vietnam
-
 Yemen
Yemen
-
 Zambia
-
 Zimbabwe
- Forex
- Crypto
