Is there an indicator that draws support and resistance?
The concept of support andresistance is one of the most important elements of technical analysis.It can be used toidentify potential areas of buying or selling pressure in a particular market. But is there anindicator that drawssupport and resistance? In this article, the experts at TU will discuss the possibility of anindicator drawing supportand resistance lines on a chart and how it can be used to aid in trading decisions.
Indicator that draws support and resistance: review
Support and resistance refer to specific price levels at which the price of an asset has historicallystruggled to break through. When the price of an asset is approaching a support level, it is expected tofind buying interest and potentially bounce back up. On the other hand, when the price of an asset isapproaching a resistance level, it is expected to encounter selling pressure and potentially pull back.
Traders can use various techniques and indicators to identify potential support and resistance levels. Thesemay include chartpatterns, technicalindicators, and even fundamentalanalysis. By understanding how toidentify and utilize these levels, traders can better understand market trends and make informed decisionsabout when to enter or exit positions.
In this blog post, the experts at TU will delve into the details of support and resistance and providepractical examples and tips on how to incorporate these concepts into your trading strategy. Whether you area beginner or an experienced trader, this post will give valuable insights and information on the role ofsupport and resistance in financial markets.
The usefulness of support and resistance levels
Based on the opinion of seasoned traders and analysts, the TU experts have compiled the following use casesfor support and resistance levels:
1. Identify trends
Support and resistance levels are price levels on a chart that can act as barriers, preventing the price ofan asset from moving above or below them. They can be visualized as a horizontal or diagonal line. If theprice of an asset is consistently finding support at a certain price interval, it may be considered anupward trend. Conversely, if the price is consistently encountering resistance at a certain price interval,it may be regarded as a downward trend. By identifying these levels, traders can better understand thedirection and strength of a trend.
2. Set stop losses
Stop-loss orders are used toautomatically exit a trade if the price of an asset moves against the trader'sposition beyond a certain level. By using support and resistance levels to set these orders, traders canlimit their potential losses in a trade. For example, if a trader is long on an asset and the price reachesa resistance level, they may set a stop-loss order just below the resistance level to minimize theirpotential loss if the price moves against them.
3. Determine entry points
Support and resistance levels can also be used to determine entry points for trades. If the price of anasset is approaching a support level and the trader believes the trend is likely to continue, they may entera long position at or near the support level. Similarly, if the price is approaching a resistance level andthe trader believes the trend is likely to reverse, they may enter a short position at or near theresistance level.
4. Identify breakouts
A breakout occurs when the price of an asset moves above a resistance level or below a support level. Thesemoves can indicate a change in trend and potentially present trading opportunities. For example, if theprice of an asset breaks above a long-term resistance level, it may signal the start of an uptrend.
5. Confirm trend strength
The ability of a support or resistance level to hold or be broken can indicate the strength of a trend. Forexample, if an asset's price can consistently break through a resistance level, it may be considered astrong uptrend. On the other hand, if the price is consistently unable to break through a resistance level,it may be viewed as a weak uptrend or apotential reversal.
6. Provide targets
Traders can use support and resistance levels to set price targets for their trades. For example, if atrader enters a long position near a support level, they may set their target price at a resistance levelabove the entry point. This can help them plan their trade and manage their risk.
7. Spot reversal patterns
Certain chart patterns, such as double tops and bottoms, can be formed at support and resistance levels andindicate potential trend reversals. A double-top pattern, for example, occurs when the price of an assetreaches a resistance level and then falls back, only to rise again and fail to break through the resistancelevel. This pattern can indicate that the uptrend may be coming to an end and a reversal may be imminent.
Indicator for Support and Resistance: pros and cons
S&R indicator automatically finds the closest support and resistance levels (or zones) for the loaded traffic.
👍 Pros:
•The indicator works on all timeframes (it is advisable to choose at least M15)
•The indicator works on all markets
•Doesn’t redraw
•Flexible settings
👎 Cons:
•There is no guarantee that the levels will work the way you expect them to
•The indicator does not issue warnings / alerts
How To Set Up Support&Resistance Indicators in MT4
The installation of the indicator is usual. Here is a step-by-step guide for the users of Windows:
Launch your Metatrader
Open the folder with the platform data using the File/Data Folder menu
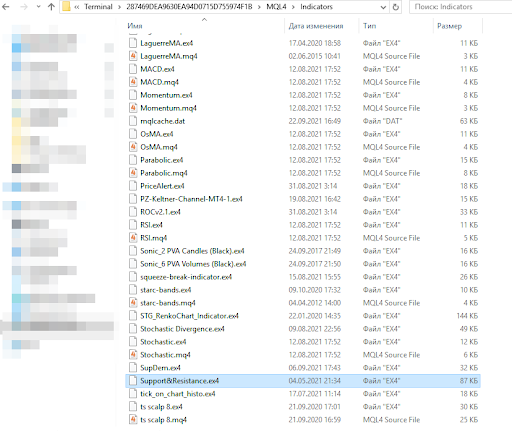
In the folder, open MQL4/Indicators folder
Insert Support&Resistance.ex4 file from the downloaded archive
Restart your MT4 platform (or refresh the Navigator window).
How to Set Up Indicator
That’s it! All is set. You can now open any chart on the MetaTrader 4 platform and add S&R indicator to itthrough themenu Insert / Indicators / Custom / SupportResistance.
Tips on Drawing Support and Resistance Levels
Experts have outlined the following tips for anyone looking to use support and resistance levels as part oftheir trading strategy:
1. Use horizontal lines
One standard method of drawing support and resistance levels is to use horizontal lines to mark the levelson a chart. These lines can be drawn at the price levels where the asset has consistently found support orencountered resistance in the past.
2. Look for round numbers
Experts suggest that prices often exhibit psychological resistance or support at rounded numbers, such as$10, $20, or $100. Therefore, these levels can be good candidates for support and resistance levels.
3. Consider the time frame
Thetime frame of the chart being analyzed can influence the significance of a support or resistancelevel.For example, a support level on a daily chart may be more significant than one on a 1-hour chart.
4. Look for trend lines
Trend lines can also act as support and resistance levels. These are diagonal lines drawn on a chart thatconnect a series of highs or lows. Atrend line that is consistently being touched by the price withoutbeing broken through may be considered a support or resistance level.
5. Use multiple time frames
It can be helpful to analyze the same asset using different time frames to identify potential support andresistance levels. For example, a daily chart may show a significant resistance level that is not apparenton a 4-hour chart.
6. Look for chart patterns
Certain chart patterns, such as head and shoulders or triangles, can also indicate potential support andresistance levels.
7. Consider volume
The volume of trading activity can also be a valuable indicator of support and resistance levels. Forexample, if a significant resistance level is approached and there is a decrease in volume, it may be a signthat the resistance level is not as strong as it appears.
8. Use multiple indicators
Combining multiple indicators, such as movingaverages, oscillators, and trend-following indicators can helpconfirm the strength of a support or resistance level.
9. Be flexible
It is important to remember that support and resistance levels are not exact and can change over time.Therefore, it is important to continually monitor these levels and adjust them as necessary.
FAQs
1. How to identify support/resistance lines?
You can identify the supply-demand zone in three steps:
1. Spot the current price.
2. Find ERCs.
3. Identify the origin of the price movement.
2. Are there any technical indicators that automatically draw support and resistance levels on achart?
Yes, several technical indicators can automatically draw support and resistance levels on achart. These indicators use mathematical calculations based on past price data to identifypotential support and resistance levels.
3. How accurate are automatic support and resistance indicators?
The accuracy of automatic support and resistance indicators can vary depending on thespecific indicator and the market conditions. Some indicators may be more accurate incertain market conditions or for certain assets, while others may be less reliable.
4. Can traders use automatic support and resistance indicators as the sole basis for theirtrading decisions?
It is generally not advisable for traders to rely solely on automatic support and resistanceindicators as the basis for their trading decisions. While these indicators can helpidentify potential levels of support and resistance, they should be used with other analysistools and techniques, such as fundamental analysis and market news, to make more informeddecisions.
5. Are there any drawbacks to using automatic support and resistance indicators?
One potential disadvantage of using automatic support and resistance indicators is that theyare based on past price data, which means they may only sometimes accurately predict futureprice movements. Additionally, different indicators may produce different results, leadingto conflicting signals and making it easier for traders to make informed decisions.
Glossary for novice traders
-
1
Trading
Trading involves the act of buying and selling financial assets like stocks, currencies, or commodities with the intention of profiting from market price fluctuations. Traders employ various strategies, analysis techniques, and risk management practices to make informed decisions and optimize their chances of success in the financial markets.
-
2
Upward Trend
Uptrend is a market condition in which prices are generally rising. Uptrends can be identified by using moving averages, trendlines, and support and resistance levels.
-
3
Fundamental Analysis
Fundamental analysis is a method or tool that investors use that seeks to determine the intrinsic value of a security by examining economic and financial factors. It considers macroeconomic factors such as the state of the economy and industry conditions.
-
4
Long position
A long position in Forex, represents a positive outlook on the future value of a currency pair. When a trader assumes a long position, they are essentially placing a bet that the base currency in the pair will appreciate in value compared to the quote currency.
-
5
Broker
A broker is a legal entity or individual that performs as an intermediary when making trades in the financial markets. Private investors cannot trade without a broker, since only brokers can execute trades on the exchanges.
Related Articles


Team that worked on the article

Chinmay Soni is a financial analyst with more than 5 years of experience in working with stocks, Forex, derivatives, and other assets. As a founder of a boutique research firm and an active researcher, he covers various industries and fields, providing insights backed by statistical data. He is also an educator in the field of finance and technology.
As an author for Traders Union, he contributes his deep analytical insights on various topics, taking into account various aspects.

Dr. BJ Johnson is a PhD in English Language and an editor with over 15 years of experience. He earned his degree in English Language in the U.S and the UK. In 2020, Dr. Johnson joined the Traders Union team. Since then, he has created over 100 exclusive articles and edited over 300 articles of other authors.

Mirjan Hipolito is a journalist and news editor at Traders Union. She is an expert crypto writer with five years of experience in the financial markets. Her specialties are daily market news, price predictions, and Initial Coin Offerings (ICO).
