How To Trade In Flat? Full Guide


Editorial Note: While we adhere to strict Editorial Integrity, this post may contain references to products from our partners. Here's an explanation for How We Make Money. None of the data and information on this webpage constitutes investment advice according to our Disclaimer.

You can use these strategies to trade in flat market conditions:
- Breakout trading - Capture the big movements following.
- No Touch Trading - Binary strategy for a range bound price.
- Scalping - Multiple trades within a short time frame.
- Moving Average Crossover strategy - Technical indicator-based.
- Range trading - Buy at support, sell at resistance.
- Hedging - Reducing risk using an offsetting position.
The financial markets aren't always on a rollercoaster ride of ups and downs. Sometimes, extended periods of sideways movement, known as flat markets, can leave traders feeling unsure of how to proceed. This comprehensive guide will equip you with the knowledge and strategies needed to navigate flat markets effectively. The experts at TU explore various approaches, from identifying potential breakouts to capitalizing on range-bound price action, empowering you to make informed decisions and potentially find success even when the market seems stagnant.
Risk warning: Forex trading carries high risks, with potential losses including your entire deposit. Market fluctuations, economic instability, and geopolitical factors impact outcomes. Studies show that 70-80% of traders lose money. Consult a financial advisor before trading.
What are the best strategies to trade in flat and how to use them?
When the market enters a flat phase – a sideways movement without a defined trend – standard trend-following strategies tend to lose effectiveness and require adjustment. In these conditions, price fluctuates within a narrow range, while buyer and seller activity remains largely balanced, creating specific trading opportunities.
The following section outlines effective strategies for trading in a range-bound market and practical methods for applying them. These approaches help you adapt your trading style to low-volatility conditions and capitalize on opportunities even in the absence of a clear trend.
Breakout Trading
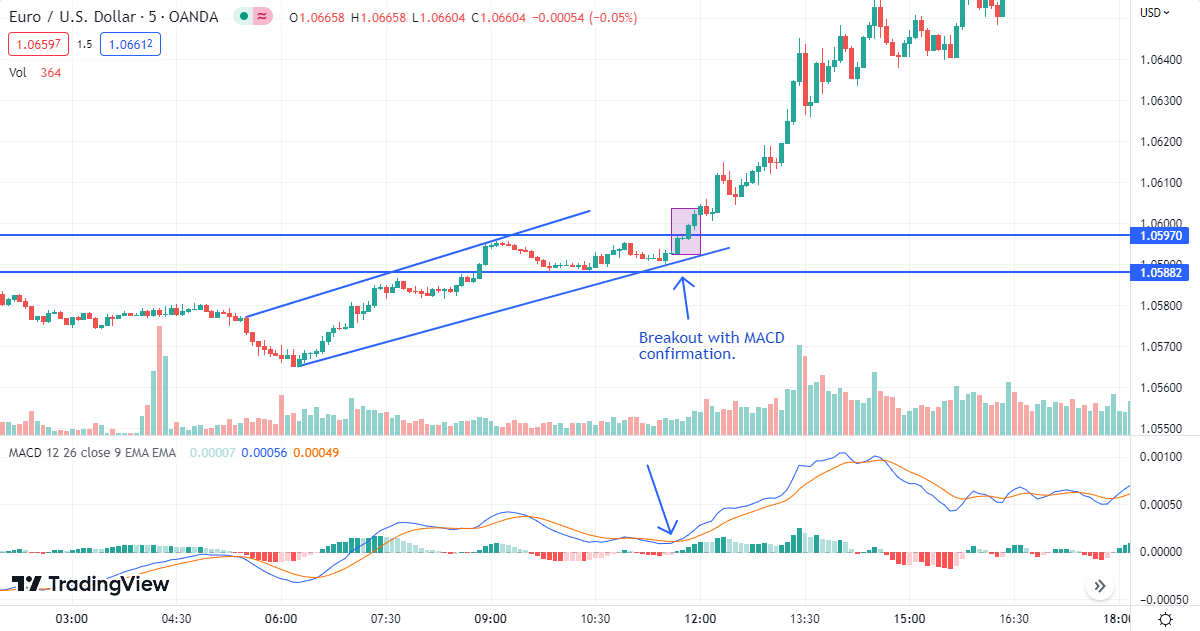 Breakout Trading
In flat market conditions, breakout trading can be an effective strategy. This involves identifying key support and resistance levels and waiting for the price to break through these levels with significant volume. Once a breakout occurs, traders can enter a position in the direction of the breakout, with a stop-loss order placed just below the previous support or resistance level. Breakout trading can be risky, but it can also be rewarding if the breakout leads to a sustained trend. Proper risk management and careful level identification are crucial for success with this strategy.
To manage risk, it is essential to use stop-loss orders to limit potential losses if the breakout fails. Additionally, it is crucial to be patient and not enter the market prematurely, as false breakouts can occur in flat market conditions.That is why it is recommended to wait for confirmation of the breakout by analyzing trading volumes and technical indicators.
No Touch Trading
No touch trading is a relatively low-risk strategy that can be well-suited for flat markets. This involves taking a position that profits if the price of an asset remains within a specified range for a certain period of time. Traders can set up a no-touch option or binary option that pays out if the price does not touch or breach a specific level. This strategy can be effective in range-bound markets where the price is expected to consolidate within a tight range. However, it's important to carefully analyze the market conditions and volatility to determine appropriate strike levels.
For example, a trader might expect the market to bounce off a key support level and place a "no touch" trade below that level. If the market does not touch the specified level, the trader will profit. This strategy can be effective in flat market conditions, as it allows traders to take advantage of the market's consolidation without needing to predict the direction of the breakout.
Scalping
 Scalping
Scalping is a high-frequency trading strategy that involves taking small profits on a regular basis by exploiting small price movements. In flat markets, scalpers may look for minor intraday trends or short-term price swings to capture small gains. This strategy requires constant monitoring of the market, tight stop-loss orders, and the ability to execute trades quickly. For beginners, scalping can be challenging in extremely flat markets, as the lack of volatility may not provide enough price movements to generate consistent profits. However, for experienced traders with the right tools and discipline, scalping can be a viable approach in flat market conditions.
Moving Average Crossover strategy
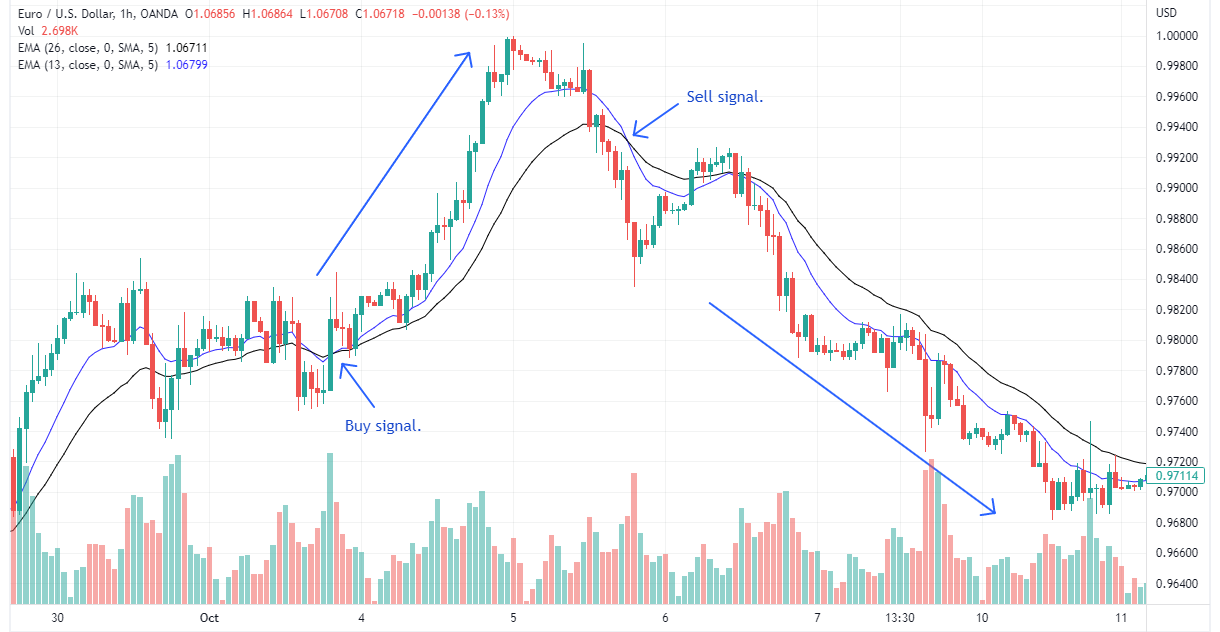 Moving Average Crossover strategy
Moving Average Crossover strategy involves monitoring the relationship between a shorter-term moving average (such as the 13-period moving average) and a longer-term moving average (like the 26-period moving average). When the shorter-term moving average crosses above the longer-term moving average, it is considered a buy signal, indicating that the trend may be turning bullish. Conversely, when the shorter-term moving average crosses below the longer-term moving average, it is considered a sell signal, suggesting a potential bearish trend. This strategy can help identify potential trend changes in range-bound markets, allowing traders to position themselves accordingly.
Range trading
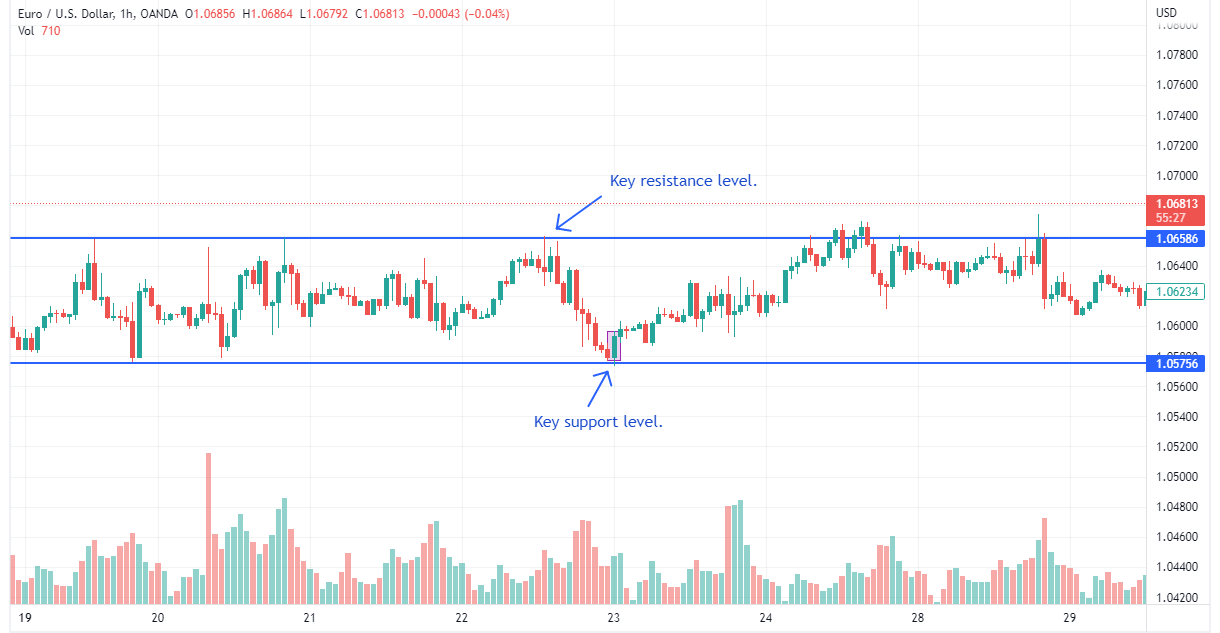 Range trading
Range trading is a popular strategy for flat market conditions. This approach involves identifying a well-defined trading range, with clear support and resistance levels. Traders can then buy near the support level and sell near the resistance level, aiming to capture the price movements within the range. Stop-loss orders can be placed just outside the range to manage risk effectively. Range trading requires patience and discipline, as traders must wait for the price to bounce off the support or resistance levels before executing trades. However, it can be a relatively low-risk strategy in flat markets when the range is well-established.
Please note: for successful trades on such a strategy, a reliable oscillator is needed in the set of technical indicators to determine the moment of reversal.
Hedging
Hedging involves taking opposing positions in different instruments or markets to offset potential losses in one position with gains in another. For example, a trader holding a long position in a stock can hedge by taking a short position in a related futures contract or by purchasing put options. This strategy can help traders protect their portfolios from adverse price movements while still allowing them to participate in potential upside. Hedging can be particularly useful in flat markets, where the direction of the trend is unclear, and the risk of significant losses is higher.
Let’s take an example. Suppose an investor holds 1,000 shares of ABC Company, currently trading at $50 per share. The investor is concerned about the potential for a market downturn and wants to hedge their position. They decide to purchase put options on ABC Company with a strike price of $48 and a premium of $2 per option. Each option contract represents 100 shares, so the investor buys 10 put option contracts (10 x 100 = 1,000 shares) at a total cost of $2,000 (10 x $2 x 100).
If the stock price of ABC Company falls below $48 per share, the investor can exercise the put options and sell their shares at the strike price of $48. For example, if the stock price drops to $45, the investor can exercise the put options and sell their 1,000 shares at $48 each, resulting in a total value of $48,000. After subtracting the initial investment of $50,000 (1,000 shares x $50) and the premium paid for the put options ($2,000), the investor's net loss would be $4,000. However, without the hedge, the investor's loss would have been $5,000 (1,000 shares x ($50 - $45)). Thus, the hedge provided a buffer against potential losses, albeit at the cost of the option premium.
Note: this strategy may have a critical increase in transaction costs due to the use of different types of trading assets.
What are flat market conditions?
Flat market conditions, also known as range-bound or sideways markets, occur when the price of an asset trades within a narrow range without significant upward or downward trends. This phase is marked by low volatility and minimal price movements. During flat markets, prices typically bounce between defined support and resistance levels, forming a trading range.
Main features:
Narrow trading range: Prices stay within a specific range, moving between support and resistance levels.
Low volatility: Price changes are small, and major swings are uncommon.
Lack of directional momentum: Neither buyers or sellers dominate, resulting in a balance between the two.
Consolidation phase: Flat markets often follow extended uptrends or downtrends, serving as a period of consolidation before the next significant price shift.
Risks for Traders:
Limited profit potential: Smaller price movements reduce opportunities for significant gains.
Whipsaws: False breakouts can trigger stop-loss orders, resulting in losses.
Increased commissions: Frequent trades in flat markets can lead to higher commission costs.
Psychological challenges: The lack of clear trends may cause frustration and indecision, affecting trading decisions.
After exploring the core strategies that work well in flat market conditions, the next practical step is choosing a reliable trading platform where these techniques can be applied efficiently. The quality of execution, spreads, and platform tools can significantly influence how well flat-market strategies perform. Below is a comparison of reputable Forex brokers that are commonly used by traders working with range-bound or low-volatility setups.
| zForex | Plus500 | OANDA | Trading.com USA | FOREX.com | |
|---|---|---|---|---|---|
|
Min. deposit, $ |
10 | 100 | No | 50 | 100 |
|
Tradable assets |
80 | 2800 | 129 | 69 | 5500 |
|
Standard EUR/USD spread |
0.3 | 0.7 | 0.3 | 1.1 | 1.0 |
|
Max. leverage |
1:1000 | 1:300 | 1:200 | 1:50 | 1:50 |
|
Max. Regulation Level |
Not regulated | Tier-1 | Tier-1 | Tier-1 | Tier-1 |
|
TU overall score |
8.05 | 7.57 | 6.89 | 6.15 | 6.87 |
|
Open an account |
Go to broker Your capital is at risk.
|
Go to broker 80% of retail CFD accounts lose money. |
Go to broker Your capital is at risk. |
Go to broker Your capital is at risk. |
Study review |
What are the useful market indicators for Flat trading?
The list of useful market indicators for Flat trading includes moving averages, Bollinger Bands, Relative Strength Index (RSI).
Moving Averages
Moving averages are widely used technical indicators that help smooth out price data by calculating the average price over a specified period. In flat markets, moving averages can be particularly useful for identifying potential trend changes and support/resistance levels.
When the price is trading within a narrow range, moving averages tend to flatten out and converge. Traders can watch for the price crossing above or below the moving averages, which may signal a potential breakout from the range. Additionally, the moving averages themselves can act as dynamic support and resistance levels, with the price often bouncing off these levels during consolidation periods.
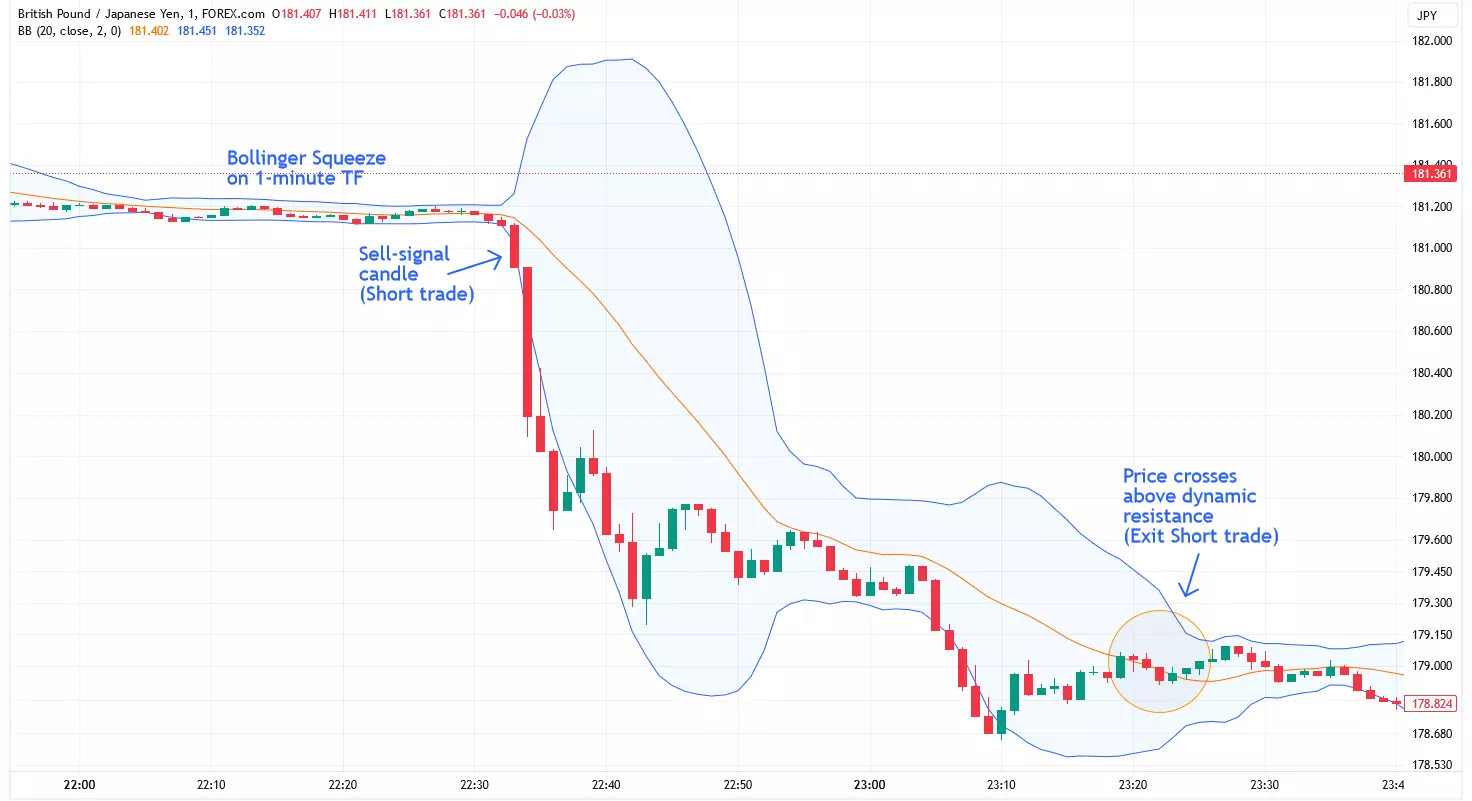
Bollinger Bands
Bollinger Bands are volatility-based indicators that consist of a simple moving average (SMA) and two bands plotted above and below the SMA at a specified number of standard deviations. In flat markets, Bollinger Bands tend to contract and tighten around the price, indicating low volatility.
Traders can use Bollinger Bands to identify potential trading opportunities within the range. TU expert Ivan Andriyenko has observed that when the price touches or bounces off the upper or lower band, it may signal a potential reversal or continuation of the range-bound movement. Additionally, the bands can act as dynamic support and resistance levels, with the price often respecting these levels during consolidation periods.
Relative Strength Index (RSI)
The Relative Strength Index (RSI) is a momentum oscillator that measures the speed and change of price movements. In flat markets, the RSI tends to oscillate between the oversold (below 30) and overbought (above 70) levels, indicating potential buying or selling opportunities within the range.
When the RSI reaches oversold levels (below 30) in a flat market, it may signal an opportunity to buy as the asset is potentially oversold and due for a bounce. Conversely, when the RSI reaches overbought levels (above 70), it may indicate an opportunity to sell as the asset is potentially overbought and due for a pullback.
Traders can also watch for divergences between the RSI and the price action, which may signal potential trend reversals or breakouts from the range.
How to choose the best strategy for flat trading?
Flat market conditions can be challenging for traders, but there are strategies that can be effective in these conditions. Here are some tips for beginners to choose the best strategy for flat trading: understand the market, start with simple strategies, backtesting and paper trading, choose suitable instruments, etc.
Understand the market
Before choosing a strategy, it's essential to understand the market conditions and the factors that contribute to flat markets. This can help traders identify potential opportunities and risks.
Start with simple strategies
As a beginner, it's best to start with simple strategies that are easy to understand and implement. Consider strategies like range trading, moving average crossovers, or basic support and resistance trading.
Backtesting and paper trading
Before committing real capital, backtest your chosen strategy on historical data to evaluate its performance in flat market conditions. Additionally, paper trade your strategy to gain experience and build confidence.
Choose suitable instruments
Not all financial instruments are equally suitable for flat trading. Look for instruments with a higher trading volume and tighter bid-ask spreads, as these characteristics can facilitate smoother entries and exits. Additionally, consider instruments with lower volatility, as excessive volatility can make it challenging to maintain positions within a defined range.
Implement effective entry and exit strategies
Develop a systematic approach to identifying entry and exit points. Consider using technical indicators such as moving averages, Bollinger Bands, or support/resistance levels to determine optimal entry and exit points. Backtesting and forward testing your strategies on historical data can help refine your approach and increase the probability of success.
Utilize appropriate order types
Flat trading often involves scaling in and out of positions multiple times. Understand the different order types available, such as limit orders, stop orders, and trailing stop orders, and how they can be effectively utilized to manage your entries, exits, and risk.
What are the pros and cons of flat trading?
- Pros
- Cons
- Limited risk
Flat trading strategies typically involve taking smaller positions and targeting modest profits within a defined price range. This approach limits the potential risk compared to strategies that aim for larger price movements or swing trading. - Frequent opportunities
In ranging markets, flat trading strategies can potentially generate multiple trading opportunities within a single trading session or day, as the price oscillates between support and resistance levels. - Lower trading costs
Since flat trading involves smaller price movements and shorter holding periods, the associated trading costs, such as swaps and certain types of commissions, are typically lower compared to strategies that involve holding positions for extended periods. - Potential for consistent returns
With proper risk management and a well-defined trading plan, flat trading strategies can potentially generate consistent returns over time, as they aim to capture small but frequent price movements. - Reduced overnight risk
Flat trading strategies often involve closing positions by the end of the trading session, minimizing the risk of adverse price movements during non-trading hours or overnight gaps.
- Limited profit potential
Since flat trading targets smaller price movements, the potential profit per trade is generally lower compared to strategies that aim for larger price swings or trends. - High trading frequency
Flat trading strategies often require a higher trading frequency, which can lead to increased stress and decision fatigue, especially during periods of low volatility or range-bound markets. - Sensitivity to market conditions
Flat trading strategies may perform poorly during periods of strong directional trends or high volatility, as the price may quickly break out of the defined trading range. - Execution risk
Flat trading often involves multiple entries and exits, increasing the potential for slippage and execution risk, especially in fast-moving or illiquid markets.
Sideways movement is not a signal to “wait it out”

When I look back at the years I've spent trading flat markets, the biggest lesson I’ve learned is that sideways movement is not a signal to “wait it out”, but an invitation to shift your mindset. Many traders get frustrated when volatility dries up, but in my experience, a quiet market rewards precision far more than aggression. Flat phases force you to slow down, read the structure more carefully, and rely on discipline rather than excitement – and that’s exactly why I consider them one of the best environments for developing true trading maturity.
What helped me most in such conditions was learning to adjust expectations. A common mistake I see is that traders continue to hunt for trend-like profits in non-trend environments. In a flat market, the goal is different: you’re not trying to “catch a move,” you’re trying to extract value from behavior that repeats. Once you accept this, your decisions become calmer and more rational. I learned to focus on market rhythms, not market direction, and that shift alone dramatically improved my consistency.
Another insight from my own practice: flat markets expose emotional habits you didn’t know you had. They test your patience, your ability to stick to small, systematic gains, and your discipline to avoid forcing trades. Many times early in my career, I entered positions simply because “nothing was happening,” and those trades almost always became unnecessary losses. Once I understood that stillness is part of the opportunity – not the absence of it – I stopped trying to force movement that wasn’t there.
If I were to recommend anything to traders working through sideways markets, it’s to treat flat phases as a training ground. They teach you to read levels precisely, manage entries without hesitation, and stay committed to your plan even when the market doesn’t “reward” you immediately. This is also where your risk management habits become second nature, because every trade is deliberate and measured. With time, you’ll realize that mastering flat markets makes you far more confident when volatility eventually returns – you trade with cleaner logic, a calmer mindset, and much better timing.
Conclusion
Mastering flat market conditions is a crucial skill for any serious trader, as these periods demand patience, discipline, and adaptive strategies. By prioritizing range-bound tactics such as support and resistance trading, and utilizing tight stop-losses, traders can confidently protect their capital while seeking smaller, consistent gains. For example, waiting for clear confirmation at key price levels or employing breakout strategies only when volatility returns can make the difference between frustration and steady progress. Ultimately, thriving in flat markets comes down to respecting market conditions and staying flexible—remember, sometimes the smartest move is to let the market come to you.
FAQs
What risk management techniques are most effective when trading in flat market conditions?
Which types of financial instruments are best suited for flat trading strategies?
How do technical indicators like Bollinger Bands and RSI assist in identifying trade opportunities in flat markets?
What are the main transaction costs to consider when trading flat market strategies?
Editors' Top Picks and Insights

Crypto test drive: How automakers are exploring digital assets

Lindsey Graham death: U.S. senator’s crypto legacy

Tether under pressure: USDT in Europe, audit questions, and the fight for trust

Lean Ethereum: Why Buterin wants to rebuild the network

SK Hynix debuts on Nasdaq: Largest U.S. offering by foreign company

SpaceX falls out of orbit: Does anyone still want Musk’s stock?
Related Articles
Team that worked on the article
Parshwa is a content expert and finance professional possessing deep knowledge of stock and options trading, technical and fundamental analysis, and equity research. As a Chartered Accountant Finalist, Parshwa also has expertise in Forex, crypto trading, and personal taxation.
Dan Blystone began his trading career in 1998 as an arbitrage clerk on the floor of the Chicago Mercantile Exchange (CME). He later traded bond and Eurex futures at proprietary firms such as Altea Trading, gaining valuable experience in high-frequency trading and risk management.
Chinmay Soni is a financial analyst with more than 5 years of experience in working with stocks, Forex, derivatives, and other assets. As a founder of a boutique research firm and an active researcher, he covers various industries and fields, providing insights backed by statistical data.
Fundamental analysis is a method or tool that investors use that seeks to determine the intrinsic value of a security by examining economic and financial factors. It considers macroeconomic factors such as the state of the economy and industry conditions.
HFX trading likely refers to high-frequency forex trading, where automated algorithms execute a large number of trades at extremely high speeds.
Forex leverage is a tool enabling traders to control larger positions with a relatively small amount of capital, amplifying potential profits and losses based on the chosen leverage ratio.
CFD is a contract between an investor/trader and seller that demonstrates that the trader will need to pay the price difference between the current value of the asset and its value at the time of contract to the seller.
Swing trading is a trading strategy that involves holding positions in financial assets, such as stocks or forex, for several days to weeks, aiming to profit from short- to medium-term price swings or "swings" in the market. Swing traders typically use technical and fundamental analysis to identify potential entry and exit points.

-
 Afghanistan
-
 Albania
-
 Algeria
-
 Angola
-
 Argentina
-
 Armenia
-
 Australia
-
 Austria
-
 Azerbaijan
-
 Bahamas
-
 Bahrain
-
 Bangladesh
-
 Belarus
-
 Belgium
-
 Bolivia
-
 Botswana
-
 Brazil
-
 Brunei
-
 Bulgaria
-
 Cambodia
-
 Cameroon
-
 Canada
-
 Chile
Chile
-
 China
China
-
 Colombia
-
 Congo
Congo
-
 Costa Rica
-
 Cote d'Ivoire
-
 Croatia
-
 Cuba
Cuba
-
 Cyprus
-
 Czechia
-
 DR Congo
-
 Denmark
-
 Dominican Republic
-
 Ecuador
-
 Egypt
Egypt
-
 El Salvador
-
 Estonia
-
 Eswatini
-
 Ethiopia
-
 Finland
-
 France
-
 Georgia
-
 Germany
-
 Ghana
Ghana
-
 Greece
-
 Haiti
Haiti
-
 Hong Kong
-
 Hungary
-
 India
India
-
 Indonesia
-
 Iran, Islamic republic
-
 Iraq
Iraq
-
 Ireland
-
 Israel
-
 Italy
Italy
-
 Jamaica
-
 Japan
Japan
-
 Jordan
-
 Kazakhstan
-
 Kenya
Kenya
-
 Korea
Korea
-
 Kuwait
-
 Kyrgyzstan
-
 Laos
Laos
-
 Latvia
-
 Lebanon
-
 Lesotho
-
 Libya
Libya
-
 Lithuania
-
 Luxembourg
-
 Madagascar
-
 Malaysia
-
 Malta
Malta
-
 Mauritius
-
 Mexico
-
 Moldova
-
 Mongolia
-
 Montenegro
-
 Morocco
-
 Mozambique
-
 Myanmar
-
 Namibia
-
 Nepal
Nepal
-
 Netherlands
-
 New Zealand
-
 Nigeria
-
 North Macedonia
-
 Norway
-
 Oman
Oman
-
 Pakistan
-
 Palestine
-
 Panama
-
 Papua New Guinea
-
 Paraguay
-
 Peru
Peru
-
 Philippines
-
 Poland
-
 Portugal
-
 Puerto Rico
-
 Qatar
Qatar
-
 Reunion
-
 Romania
-
 Rwanda
-
 Saudi Arabia
-
 Serbia
-
 Singapore
-
 Slovakia
-
 Slovenia
-
 Somalia
-
 South Africa
-
 Spain
Spain
-
 Sri Lanka
-
 Sweden
-
 Switzerland
-
 Syria
Syria
-
 Taiwan
-
 Tajikistan
-
 Tanzania
-
 Thailand
-
 Trinidad and Tobago
-
 Tunisia
-
 Turkey
-
 UAE
UAE
-
 Uganda
-
 Ukraine
-
 United Kingdom
-
United States
-
 Uruguay
-
 Uzbekistan
-
 Venezuela
-
 Vietnam
-
 Yemen
Yemen
-
 Zambia
-
 Zimbabwe
- Forex
- Crypto
