How To Use Directional Movement Index Indicator For Smarter Trend Detection


Editorial Note: While we adhere to strict Editorial Integrity, this post may contain references to products from our partners. Here's an explanation for How We Make Money. None of the data and information on this webpage constitutes investment advice according to our Disclaimer.
The Directional Movement Index helps traders identify trend strength and direction by using +DI and –DI to show buyer or seller control and ADX to confirm momentum. It is most effective when used to avoid weak markets and confirm breakouts with real strength building behind the move.
Most traders overlook the Directional Movement Index (DMI) or use it as a secondary tool, expecting it to behave like MACD or RSI. But DMI is not designed for pinpointing entries. It works best when identifying times to stay out. When the DI lines are close together and the ADX is flat, it signals that the market lacks strength, and staying on the sidelines is the smarter move.
It helps you avoid getting caught in indecisive price action. However, when the DI lines begin to separate and ADX starts rising, that is your cue. It shows that momentum is building and it's time to stop second-guessing and focus on a potential strong trend.
Introduction to DMI indicator
The Directional Movement Index (DMI) helps traders figure out not just which way the market is moving — but how strong that move really is. It’s a reliable tool when you want to know if a trend is worth trading or if you’re better off waiting it out.

What it tells you
Who’s in control
DMI shows whether buyers or sellers are leading the market.How strong the move is
It doesn’t just point out direction — it tells you how much power is behind the move.Built to work with ADX
DMI is usually shown with ADX, which adds even more detail by showing if the trend has momentum.
The three parts of DMI
+DI
Tells you how strong the upward movement is.–DI
Tells you how strong the downward pressure is.ADX
Shows if the trend has any real strength — without telling you which way it’s going.
Origin and development of DMI indicator
The DMI was created by J. Welles Wilder, a trader who made some of the most widely used tools in technical analysis. He wanted to build something that took the guesswork out of trend detection — and DMI was part of that vision.
Who built it and why
J. Welles Wilder
He introduced DMI in 1978 and also came up with other well-known tools like RSI and ATR. He had a strong focus on giving traders systems they could stick to — not just gut feelings.A big believer in rules
Wilder’s goal was to help traders make decisions based on data, not emotion.
How DMI became popular
Now a default indicator
You’ll find DMI on just about every trading platform — often already paired with ADX.Works on any timeframe
Whether you’re day trading or holding positions for weeks, DMI adapts well.Still useful decades later
Despite being created in the late ’70s, DMI remains a favorite for traders who want a clear picture of trend strength and direction.
Understanding the DMI indicator components
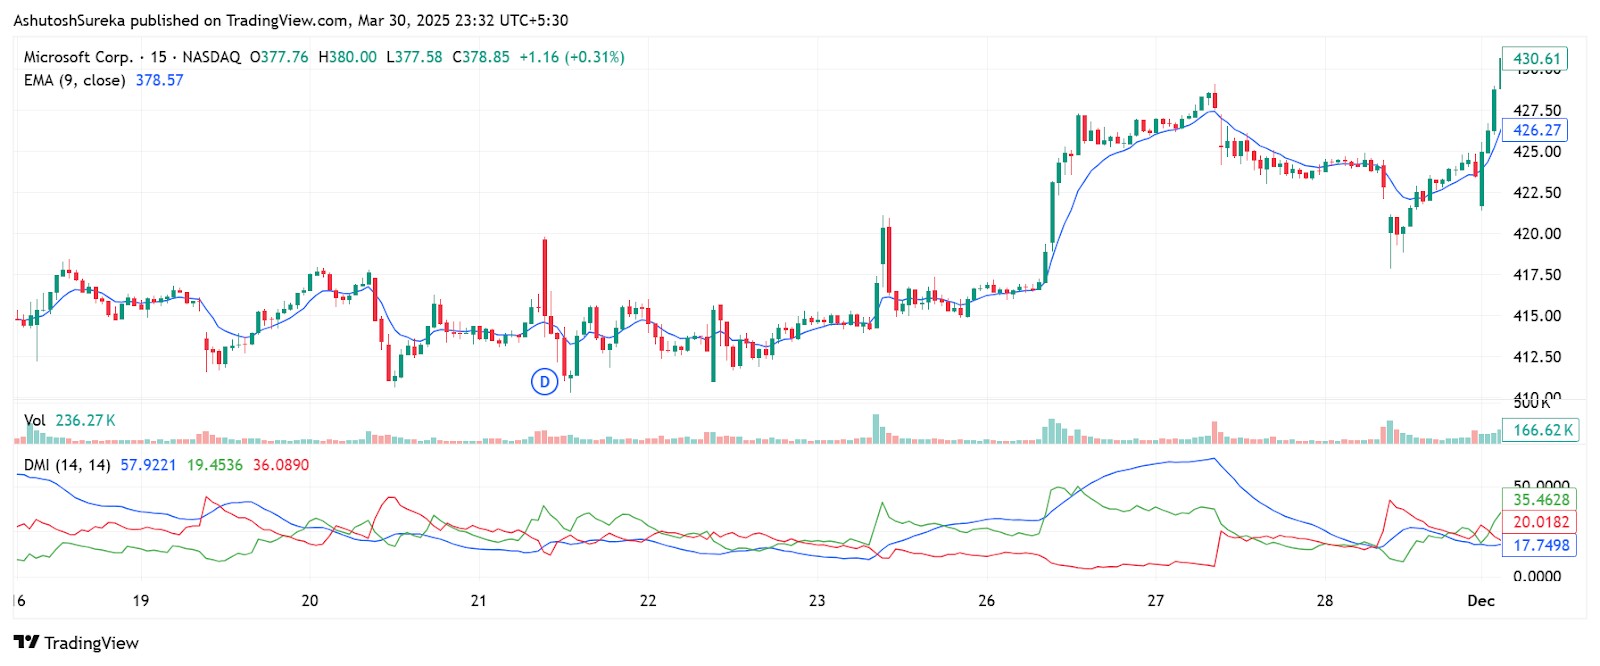
The DMI indicator has three parts that work together to give you a clearer picture of what the market is doing. Each line has a specific role — helping you figure out who’s in control and how strong that control really is.
Positive directional indicator (+DI)
This line shows how strong the buying side is.
What it shows
Tells you if buyers are gaining strength
When +DI is rising, it means prices are climbing with force behind the move.A key uptrend signal
If +DI is above –DI, it usually means bulls are leading.Crossing above –DI
That’s often seen as a signal that an uptrend might be starting.
How it’s figured out
The indicator checks if the current high is higher than the previous high.
If that move is bigger than any downward move, it’s counted.
Then it’s smoothed over several periods (usually 14).
Negative directional indicator (–DI)
This line tracks how strong the selling pressure is.
What it shows
Rising –DI = sellers in control
If this line is moving up, it shows that prices are falling with pressure behind the move.Bearish confirmation When –DI
is above +DI, it’s a sign the bears are winning.Bearish crossover A crossover where –DI
rises above +DI might suggest a new downtrend is forming.
How it’s figured out
It looks at whether the current low is lower than the previous low.
If that drop is bigger than any upward move, it’s marked.
Then it’s smoothed just like the +DI.
Average directional index (ADX)
This line measures how strong the trend is — without caring about which direction it's going.
What it shows
Rising ADX = strong trend
When ADX is moving up, it means the market is trending, either up or down.Falling ADX = weak or no trend
If the line is dropping or stays below 20, the market might be going sideways.It doesn’t care about direction ADX
doesn’t show whether the bulls or bears are in charge — just how strong the overall trend is.
How it’s figured out
It uses the gap between +DI and –DI.
The number is smoothed to make the line easier to read.
The result is a trend strength line that helps confirm if a market move is worth following.
How to set up DMI indicator
Getting the DMI indicator onto your chart is simple. It’s already built into most trading platforms, and once it’s running, it helps you quickly see who’s in control — buyers or sellers — and how strong the trend really is.
Access the indicator
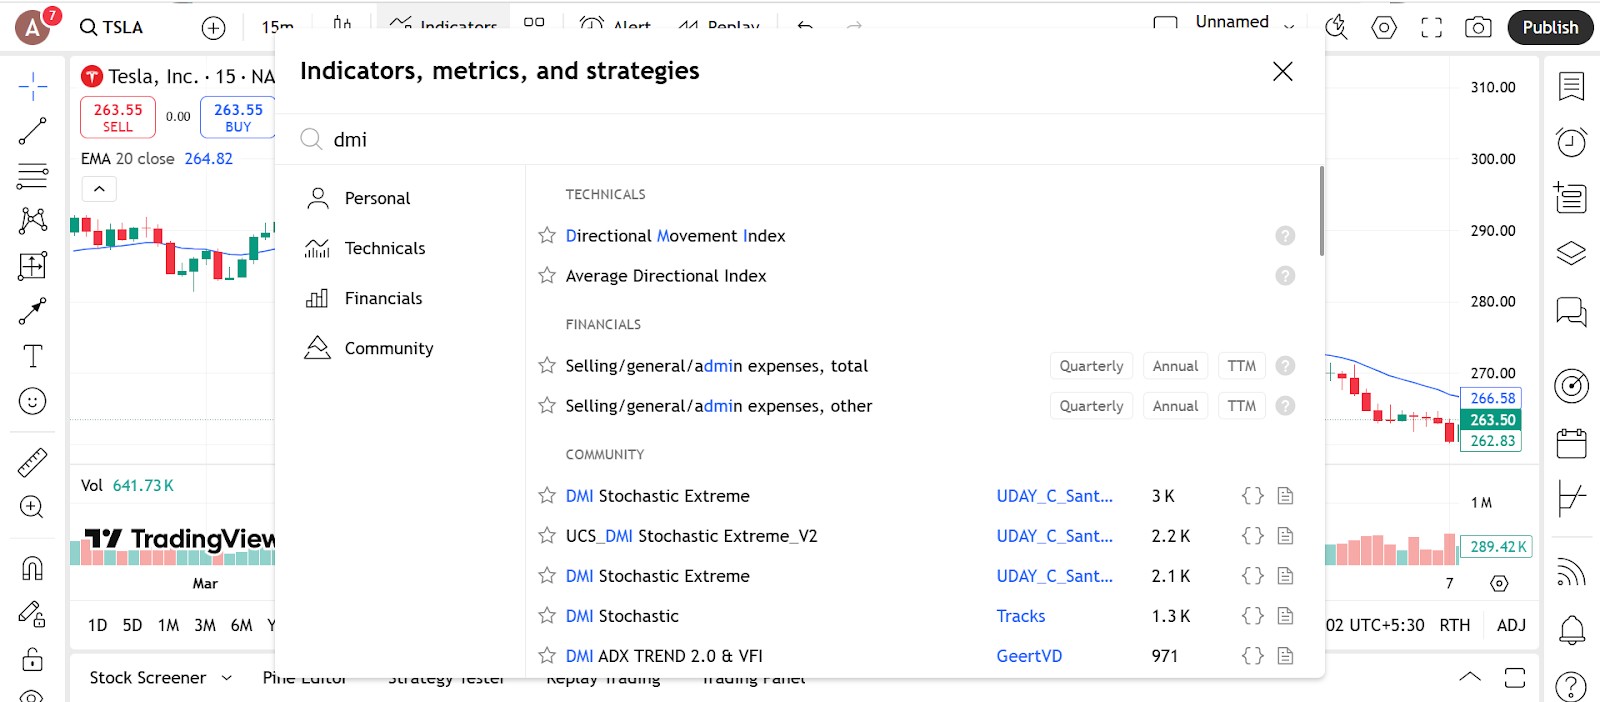
Here’s how to find and activate the DMI in your trading platform.
Steps to follow
Open the indicators menu
Type in “DMI,” “Directional Movement Index,” or even “ADX” depending on your platform.Click to add it to your chart
The indicator will show up in its own window below your price chart, with three lines: +DI, –DI, and ADX.Available on most platforms
You’ll see it on TradingView, MetaTrader, ThinkorSwim, and many others right out of the box.
Helpful setup tips
Save it to your favorites
If you plan to use it often, save it so you don’t have to search each time.Try different names if you can’t find it
Some platforms call it “ADX/DMI,” so try a few variations if needed.
Configure the parameters
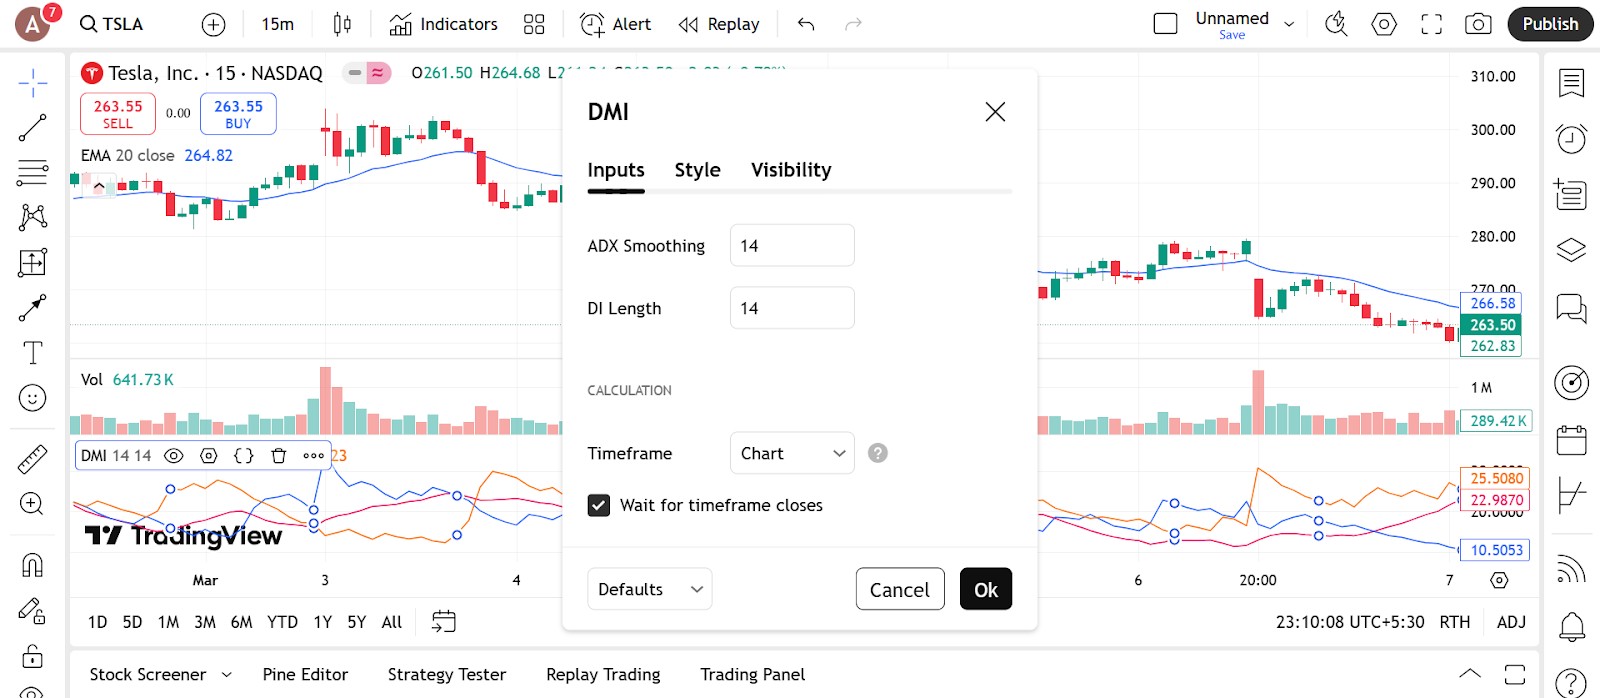
You don’t need to change much — but a few tweaks can help make it more useful for your trading style.
Pick your period length
Default is 14
This is a good balance for most traders — not too slow, not too fast.Go shorter if you want quicker signals
Try 10 or even 7 if you’re trading on fast-moving charts. Just be aware it might get a bit noisy.Go longer for smoother signals
A setting of 20 or more can filter out smaller moves and help focus on bigger trends.
Make the lines easier to read
Use distinct colors
Set green for +DI, red for –DI, and something neutral for ADX. You want to be able to spot crossovers instantly.Thicken the lines
Especially helpful on mobile or when zoomed out.Add a level line for ADX
Put a line at 20 or 25 to help you see when trend strength is actually picking up.
Keep it simple
Stick with the default smoothing
Most platforms use Wilder’s method, which works well — no need to change it unless you’re testing something specific.Avoid clutter
DMI works well with clean charts. Don’t overload it with too many indicators.
Trading strategies using DMI indicator
The Directional Movement Index (DMI) offers a clear view of who’s dominating the market, whether it is buyers or sellers, and whether that strength is worth acting on. When applied correctly, it helps filter out weak setups, keeps you from entering during choppy conditions, and gives you the confidence to trade when momentum is clearly in your favor.
Trading DI crossovers
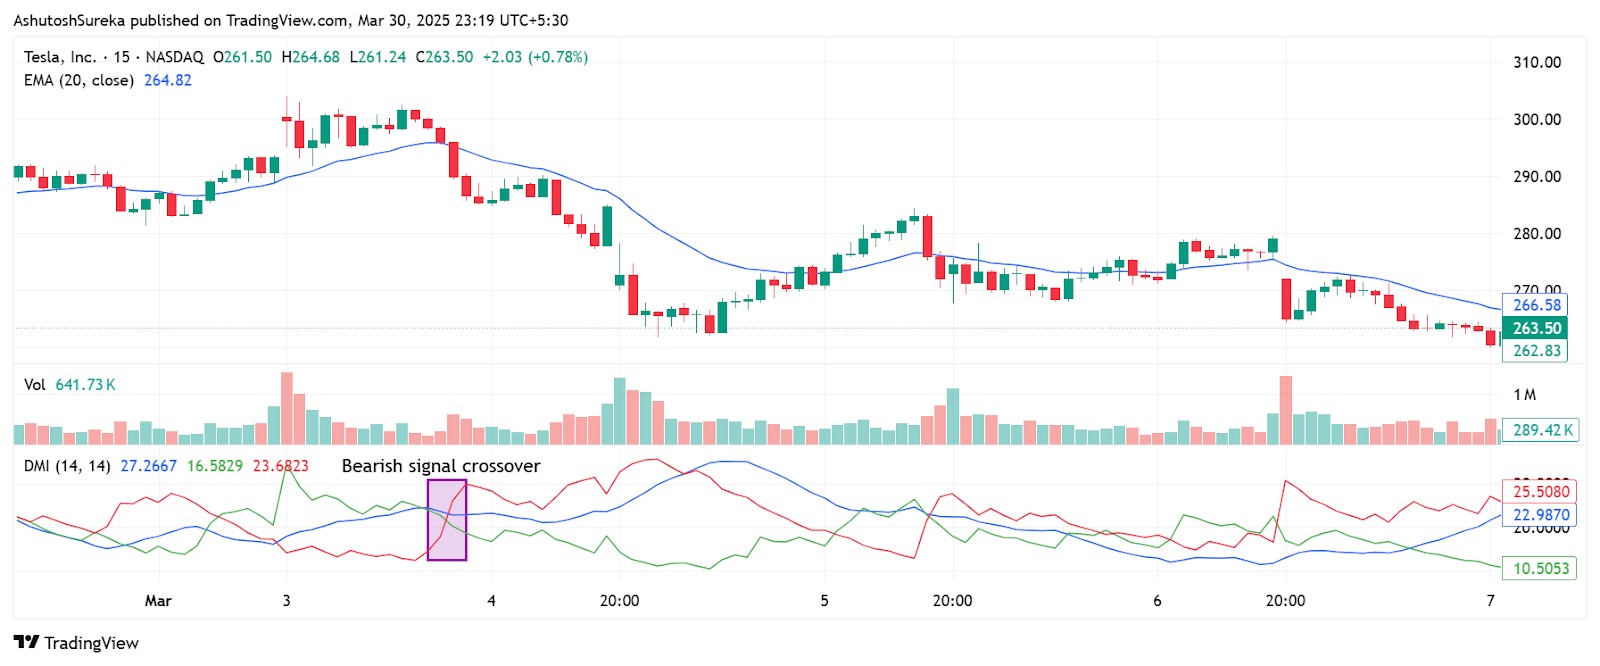
One of the simplest ways to use DMI is by watching for when the +DI and –DI lines cross each other.
What to look for
+DI crossing above –DI
Buyers are taking over — this could be the start of an uptrend.–DI crossing above +DI
Sellers are gaining control — possibly the start of a downtrend.
When to act
Enter after a crossover, if ADX is rising
You want momentum behind the move. Rising ADX confirms it’s not just a quick blip.Exit when lines cross again or flatten
That’s usually a sign the move is weakening.
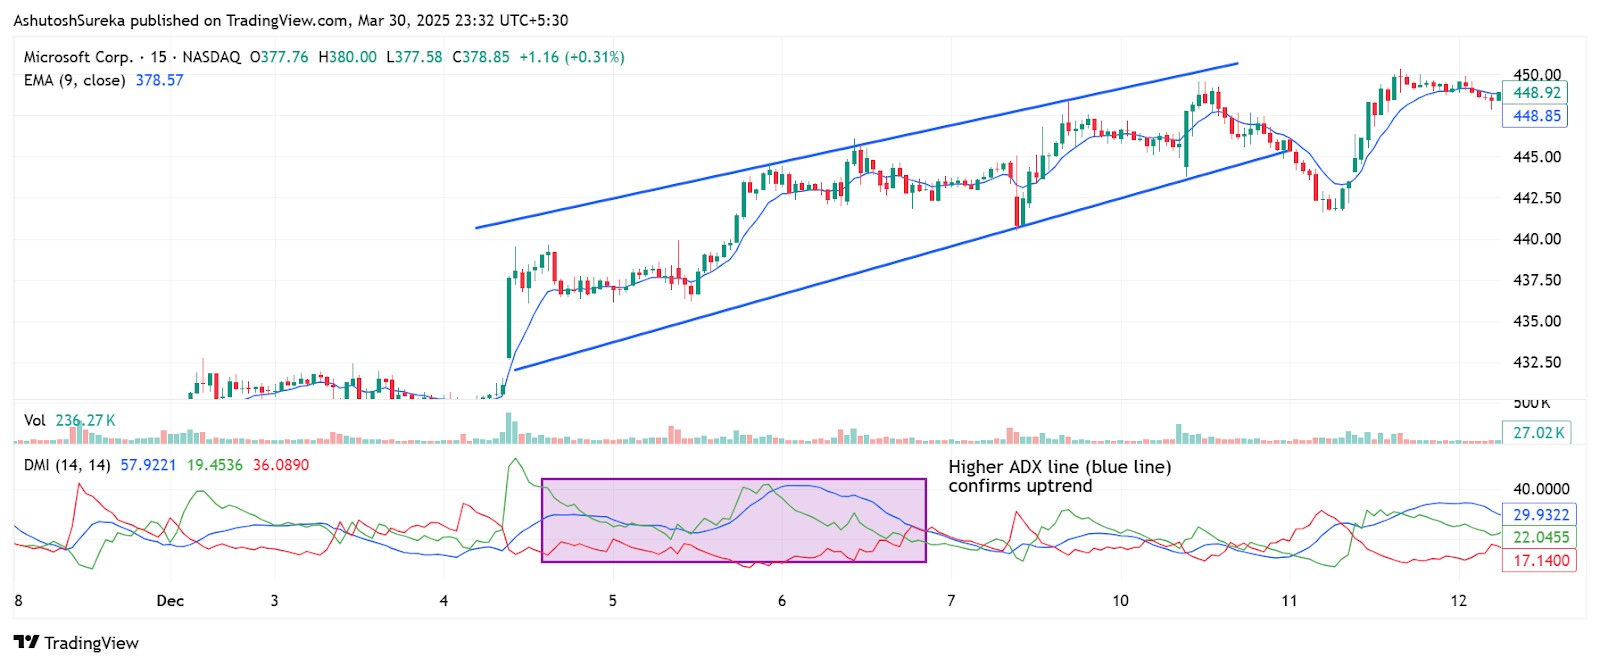
Using ADX to confirm trends
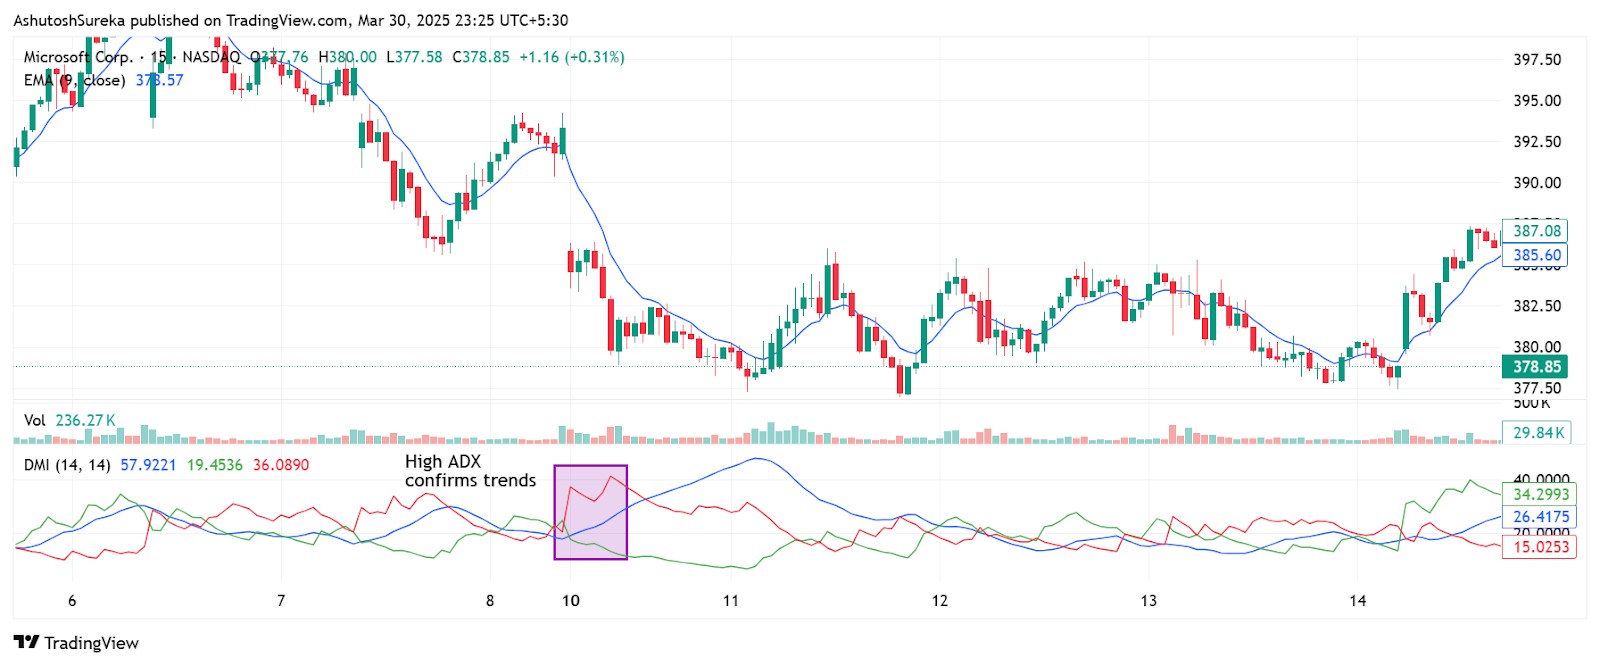
You don’t always need a crossover to trade — sometimes, ADX alone can guide your decisions.
What to do
Trade only when ADX is above 20–25
This shows the market has enough momentum for a potential trend to follow through.Stay out if ADX is low
Low ADX means the market is likely choppy or going sideways — not ideal for trend trades.
Breakout confirmation
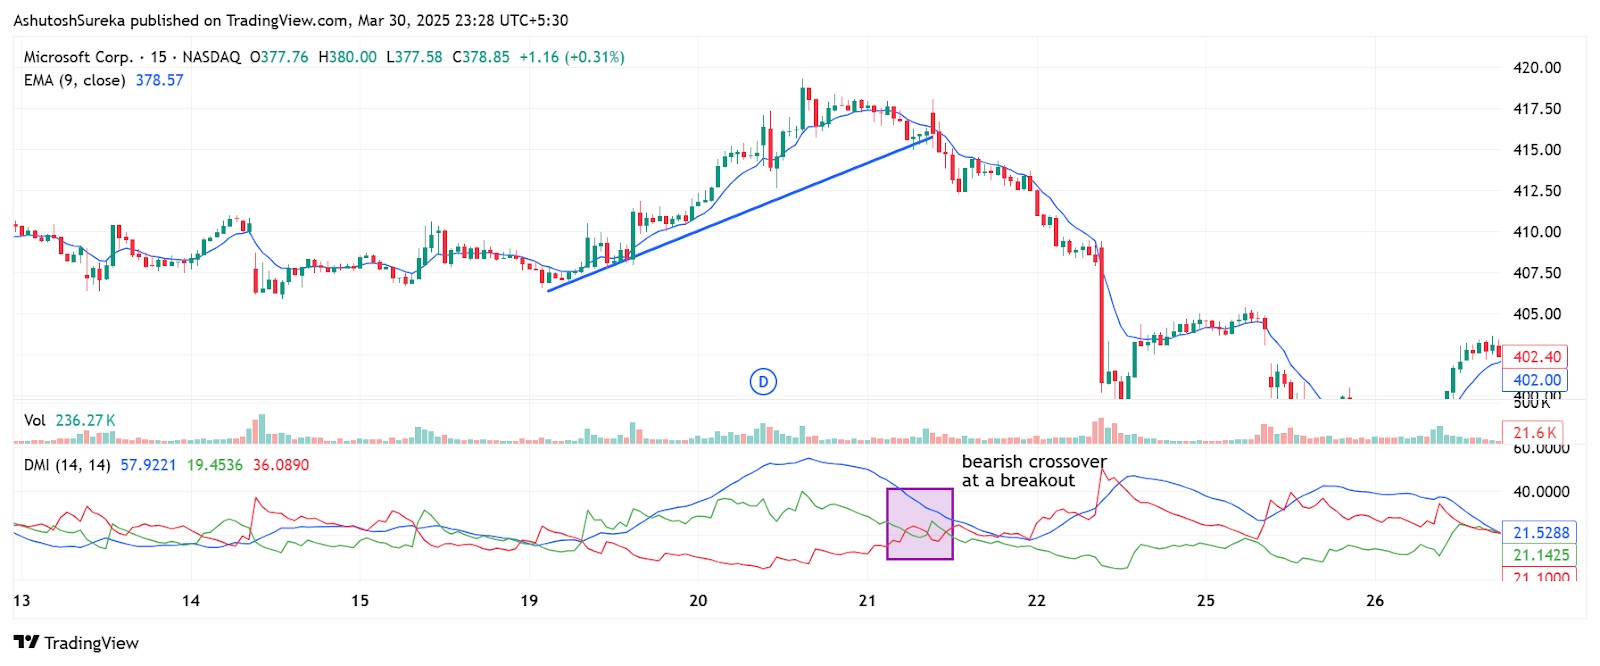
DMI is great for checking whether a breakout is worth trading or likely to fail.
How to use it
Find a breakout zone
Use resistance for bullish trades and support for bearish ones.Check if DMI backs it up
For bullish breakouts. +DI rising and ADX climbing.
For bearish breakouts. –DI rising and ADX climbing.Be cautious if DMI lines are flat
That might mean the breakout has no real momentum.
Catching pullbacks in strong trends
When the market is trending but pauses briefly, DMI can help you rejoin the move at a better price.
What to look for
ADX is rising, and one DI line stays dominant
This shows the trend is still strong, even during the pullback.Wait for price to bounce
Enter once price shows signs of resuming the trend — like a strong candle or bounce off a support zone.Use candles for timing
Look for clear patterns like pin bars, engulfing candles, or momentum bars in the direction of the trend.
We’ve selected a list of top brokers that offer reliable platforms to trade using the DMI indicator. Whether you’re a short-term trader or someone who holds positions longer, these brokers provide the tools, charts, and features needed to apply DMI effectively across multiple markets.
| Foundation year | Account min. | Demo | Deposit Fee | Withdrawal fee | Inactivity fee | Android | iOS | Regulation | TU overall score | Open an account | |
|---|---|---|---|---|---|---|---|---|---|---|---|
| 2007 | 50 | Yes | No | No | No | Yes | Yes | SEC, FINRA | 8.8 | Go to broker Your capital is at risk. |
|
| 2008 | EUR500 | Yes | No | No | No | Yes | Yes | CySEC, FCA, ASIC, FMA, FSCA, FSA Seychelles, EFSA, MAS, DFSA, SCB | 8.48 | Go to broker 80% of retail CFD accounts lose money. |
|
| 2007 | No | Yes | Not specified | Not specified | Not specified | Yes | Yes | FINRA, SIPC | 7.93 | Study review | |
| 2015 | No | No | No | No charge up to a limit | Not specified | Yes | Yes | FCA, SEC, FINRA | 8.6 | Study review | |
| 1978 | No | Yes | No | No | No | Yes | Yes | SEC, FINRA, SIPC, FCA, NSE, BSE, SEBI, SEHK, HKFE, IIROC, ASIC, CFTC, NFA | 8.53 | Study review |
Pros and cons of DMI indicators
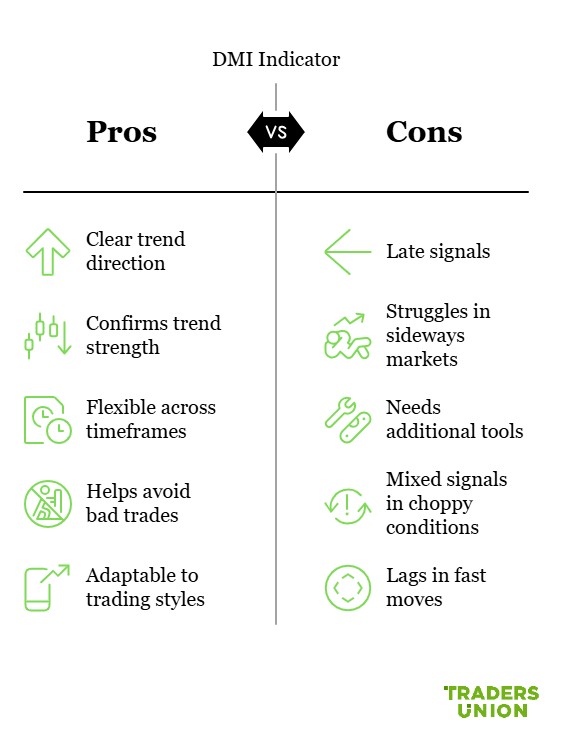
The DMI indicator gives you a clearer picture of who’s running the market — buyers or sellers — and how strong the trend really is. But like every tool, it has times when it works well and times when it doesn’t. Here’s a quick look at both sides.
Why traders like using DMI
The DMI takes the guesswork out of trend trading — it gives you structure and helps avoid emotional decisions.
It shows both direction and strength
+DI and –DI tell you who’s in control
When those lines cross, it’s easy to spot if buyers or sellers are leading.ADX confirms if the trend has power
This helps you avoid weak trends that fizzle out fast.
It’s flexible
Works on any timeframe
Whether you’re scalping or swing trading, the DMI adapts.Fits into different trading styles
You can use it for trend following, breakout trades, or even to avoid trades when there’s no clear direction.
It helps you avoid bad trades
Low ADX = sit tight
When there’s no trend, DMI helps you stay out of the market instead of forcing a trade.Confirms when to jump in
If direction and strength both line up, you’re more likely to be trading with the trend and not against it.
Where DMI can fall short
DMI is helpful, but it isn’t perfect. Sometimes it reacts too slowly or gives unclear signals in choppy conditions.
It can be a bit late
Signals often come after the move starts
DMI uses past data, so you might enter a little later than ideal.Crossovers can lag
The lines may take time to show a new trend, especially if the move starts quickly.
It struggles in sideways markets
Too many crossovers
In flat or low-volume conditions, +DI and –DI might keep crossing back and forth — giving mixed signals.ADX might stay low for too long
That can make it hard to tell when a real trend is just getting started.
It needs backup
Won’t tell you where to buy or sell
DMI gives trend direction and strength, but not exact entry points.Best used with other tools
Try pairing it with moving averages, trendlines, or candlestick patterns to get the full picture.
DMI helps you spot momentum early and exit before it fades

Most beginners treat DMI like just another signal generator but that misses the point. The real juice comes from spotting moments when momentum builds fast. Watch for +DI staying above -DI for a while and ADX picking up from the low twenties. When that slope turns sharp you are seeing buyers or sellers press harder. That is your edge. Spot that setup early and you are riding the meat of the move not chasing the tail end. Most tools react too late but DMI shows you where the pressure is ramping up before it is obvious.
Another way to use DMI that most people overlook is for exits not entries. Say you are in a good long and you start seeing ADX roll over and +DI losing ground toward -DI. That does not mean dump it instantly but it does mean the move is cooling off. This is key when you are already up and trying not to hold too long.
You do not need five indicators to tell you what is fading. Just read what DMI is saying about the pressure behind the move. If you listen to that you will start locking in profits while others are still waiting for a bounce that never comes.
Conclusion
The DMI is not some flashy tool and that is exactly why it works. It does not flash signals in your face. It helps you figure out when the market actually means it and when it is just drifting. If you are only using it to tell you who is in charge you are skipping over what it is really telling you. DMI shows you whether that pressure is building or fading and that is the stuff that counts. Once you learn to notice when the strength behind a move is changing you will stop second guessing and start making cleaner calls.
FAQs
How does the DMI indicator help in identifying trend direction?
The Directional Movement Index (DMI) helps identify trend direction by comparing the strength of upward and downward movements using the +DI and -DI lines. When +DI is above -DI, it signals an uptrend, and vice versa for a downtrend.
Can the DMI indicator be used for all types of financial instruments?
Yes, the DMI indicator can be used on stocks, forex, commodities, indices, and cryptocurrencies. Its flexibility makes it suitable across various asset classes and timeframes.
What are the recommended settings for the DMI indicator in short-term trading?
A 14-period setting is the standard for DMI and works well for short-term trading. Traders may fine-tune the period slightly to better match the volatility and behavior of specific instruments.
Are there any limitations to using the DMI indicator in volatile markets?
In highly volatile markets, the DMI can produce false signals or lag during quick reversals. It is more effective when paired with other indicators like ADX or moving averages to validate trends.
Editors' Top Picks and Insights

U.S. Bitcoin reserve: Trump’s unrealized crypto promise

Aiming for leadership: Payment giants prepare a new stablecoin

Proof of Reserves: the new standard for cryptocurrency exchanges

Three trends that could reshape the crypto market over the next decade

Trump financial disclosure: How the president's crypto income became a U.S. ethics issue

Code red: What's behind Bitcoin’s sharp selloff?
Related Articles
Team that worked on the article
Andrey Mastykin is an experienced author, editor, and content strategist who has been with Traders Union since 2020. As an editor, he is meticulous about fact-checking and ensuring the accuracy of all information published on the Traders Union platform.
Chinmay Soni is a financial analyst with more than 5 years of experience in working with stocks, Forex, derivatives, and other assets. As a founder of a boutique research firm and an active researcher, he covers various industries and fields, providing insights backed by statistical data.
Mirjan Hipolito is a journalist and news editor at Traders Union. She is an expert crypto writer with five years of experience in the financial markets.
Cryptocurrency is a type of digital or virtual currency that relies on cryptography for security. Unlike traditional currencies issued by governments (fiat currencies), cryptocurrencies operate on decentralized networks, typically based on blockchain technology.
CFD is a contract between an investor/trader and seller that demonstrates that the trader will need to pay the price difference between the current value of the asset and its value at the time of contract to the seller.
Swing trading is a trading strategy that involves holding positions in financial assets, such as stocks or forex, for several days to weeks, aiming to profit from short- to medium-term price swings or "swings" in the market. Swing traders typically use technical and fundamental analysis to identify potential entry and exit points.
Breakout trading is a trading strategy that focuses on identifying and profiting from significant price movements that occur when an asset's price breaches a well-defined level of support or resistance.
Scalping in trading is a strategy where traders aim to make quick, small profits by executing numerous short-term trades within seconds or minutes, capitalizing on minor price fluctuations.

-
 Afghanistan
-
 Albania
-
 Algeria
-
 Angola
-
 Argentina
-
 Armenia
-
 Australia
-
 Austria
-
 Azerbaijan
-
 Bahamas
-
 Bahrain
-
 Bangladesh
-
 Belarus
-
 Belgium
-
 Bolivia
-
 Botswana
-
 Brazil
-
 Brunei
-
 Bulgaria
-
 Cambodia
-
 Cameroon
-
 Canada
-
 Chile
Chile
-
 China
China
-
 Colombia
-
 Congo
Congo
-
 Costa Rica
-
 Cote d'Ivoire
-
 Croatia
-
 Cuba
Cuba
-
 Cyprus
-
 Czechia
-
 DR Congo
-
 Denmark
-
 Dominican Republic
-
 Ecuador
-
 Egypt
Egypt
-
 El Salvador
-
 Estonia
-
 Eswatini
-
 Ethiopia
-
 Finland
-
 France
-
 Georgia
-
 Germany
-
 Ghana
Ghana
-
 Greece
-
 Haiti
Haiti
-
 Hong Kong
-
 Hungary
-
 India
India
-
 Indonesia
-
 Iran, Islamic republic
-
 Iraq
Iraq
-
 Ireland
-
 Israel
-
 Italy
Italy
-
 Jamaica
-
 Japan
Japan
-
 Jordan
-
 Kazakhstan
-
 Kenya
Kenya
-
 Korea
Korea
-
 Kuwait
-
 Kyrgyzstan
-
 Laos
Laos
-
 Latvia
-
 Lebanon
-
 Lesotho
-
 Libya
Libya
-
 Lithuania
-
 Luxembourg
-
 Madagascar
-
 Malaysia
-
 Malta
Malta
-
 Mauritius
-
 Mexico
-
 Moldova
-
 Mongolia
-
 Montenegro
-
 Morocco
-
 Mozambique
-
 Myanmar
-
 Namibia
-
 Nepal
Nepal
-
 Netherlands
-
 New Zealand
-
 Nigeria
-
 North Macedonia
-
 Norway
-
 Oman
Oman
-
 Pakistan
-
 Palestine
-
 Panama
-
 Papua New Guinea
-
 Paraguay
-
 Peru
Peru
-
 Philippines
-
 Poland
-
 Portugal
-
 Puerto Rico
-
 Qatar
Qatar
-
 Reunion
-
 Romania
-
 Rwanda
-
 Saudi Arabia
-
 Serbia
-
 Singapore
-
 Slovakia
-
 Slovenia
-
 Somalia
-
 South Africa
-
 Spain
Spain
-
 Sri Lanka
-
 Sweden
-
 Switzerland
-
 Syria
Syria
-
 Taiwan
-
 Tajikistan
-
 Tanzania
-
 Thailand
-
 Trinidad and Tobago
-
 Tunisia
-
 Turkey
-
 UAE
UAE
-
 Uganda
-
 Ukraine
-
 United Kingdom
-
United States
-
 Uruguay
-
 Uzbekistan
-
 Venezuela
-
 Vietnam
-
 Yemen
Yemen
-
 Zambia
-
 Zimbabwe
- Forex
- Crypto
