Best MACD Indicator Strategies In 2025


Editorial Note: While we adhere to strict Editorial Integrity, this post may contain references to products from our partners. Here's an explanation for How We Make Money. None of the data and information on this webpage constitutes investment advice according to our Disclaimer.
Best MACD indicator strategies:
Strategy 1. The Crossover Strategy
Strategy 2. The Histogram Reversal Strategy
Strategy 3. The Zero Crosses Strategy
Strategy 4. The Divergence Trading Strategy
The MACD indicator helps traders generate signals from moving averages but how does it work? In this article, we’ll explain everything you need to know about trading with MACD and provide you with some of the most successful trading strategies that can help strengthen your trading system.
Top 4 MACD strategies to learn
There are many ways to employ MACD, but most traders will adopt one of the following four, core strategies. These are (a) the crossover strategy (b) the histogram reversal strategy (c) the zero crosses strategy, and (d) the divergence trading strategy.
Strategy 1 – The crossover strategy
The crossover strategy uses the crossover between a MACD line and a signal line to determine buying and selling signals. A buying signal is realised when the MACD line crosses above the signal line. A sell signal is realised when the MACD line crosses below the signal line.
When using the crossover strategy, it is important to be aware that when market trends are weak, prices might already reach a point of reversal by the time a signal has been generated, resulting in a false signal.
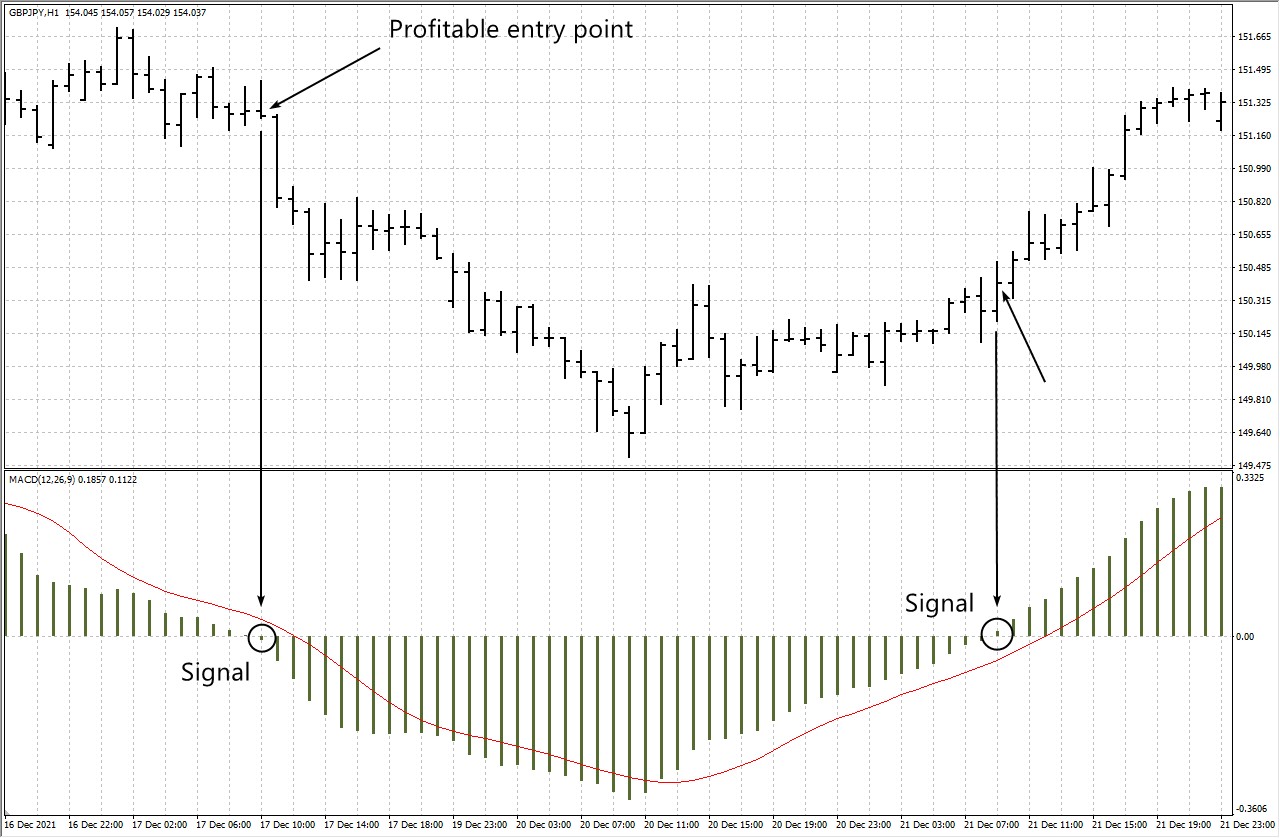
Strategy 2 – The histogram reversal strategy
The histogram reversal strategy is a very popular strategy used by traders. This strategy takes existing trends and then places positions based on those trends. The bars on a histogram represent the difference between the MACD and the signal line.
When the histogram bars shrink, it indicates that the market price is moving slowly. When the bars increase in height it indicates that the market price is moving in a particular direction more strongly. Traders employ this strategy to make more profitable trades and mitigate losing trades.
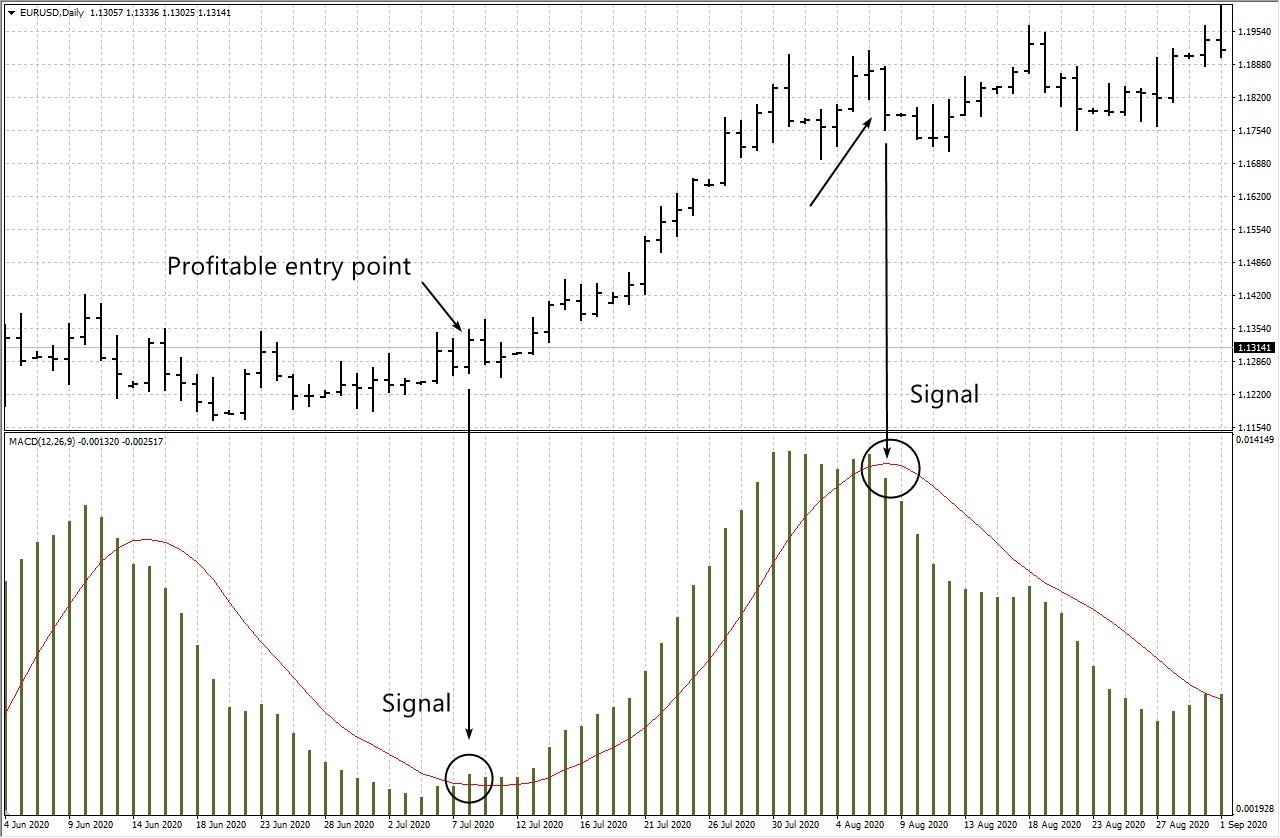
Strategy 3 – The zero crosses strategy
The zero crosses strategy looks at when EMAs cross the zero line to determine the emergence of new uptrends and downtrends. When the MACD crosses the zero line from below it indicates the emergence of an uptrend. When the MACD crosses the zero line from above it indicates the emergence of a downtrend.
Traders use this strategy to buy and close positions at the optimum times. For example, the aim is to buy a short position when the MACD crosses above the zero line and sell a long position when the MACD crosses below the zero line.
Strategy 4 – The divergence trading strategy
Divergence trading is a very common trading strategy used most commonly for Forex trading. Divergence trading looks at when the price of an asset is moving in the opposite direction of the indicator and takes this signal as an indication that price trends are weakening or heading towards a change in direction. Because of this, the strategy is often used as a way for traders to determine if a trend is getting weaker and heading towards a trend reversal.
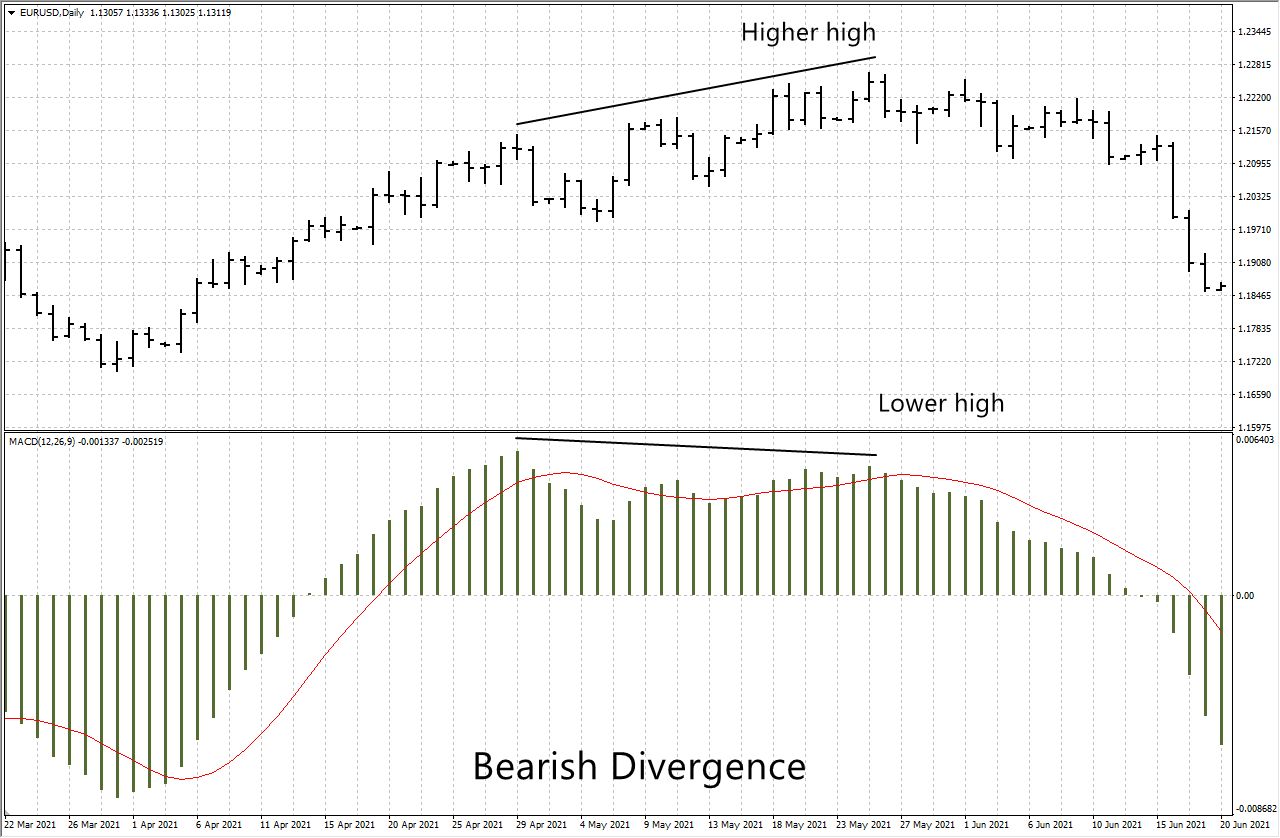
There are two principal types of divergence.
Bullish divergence – the price moves lower as the indicator points up.
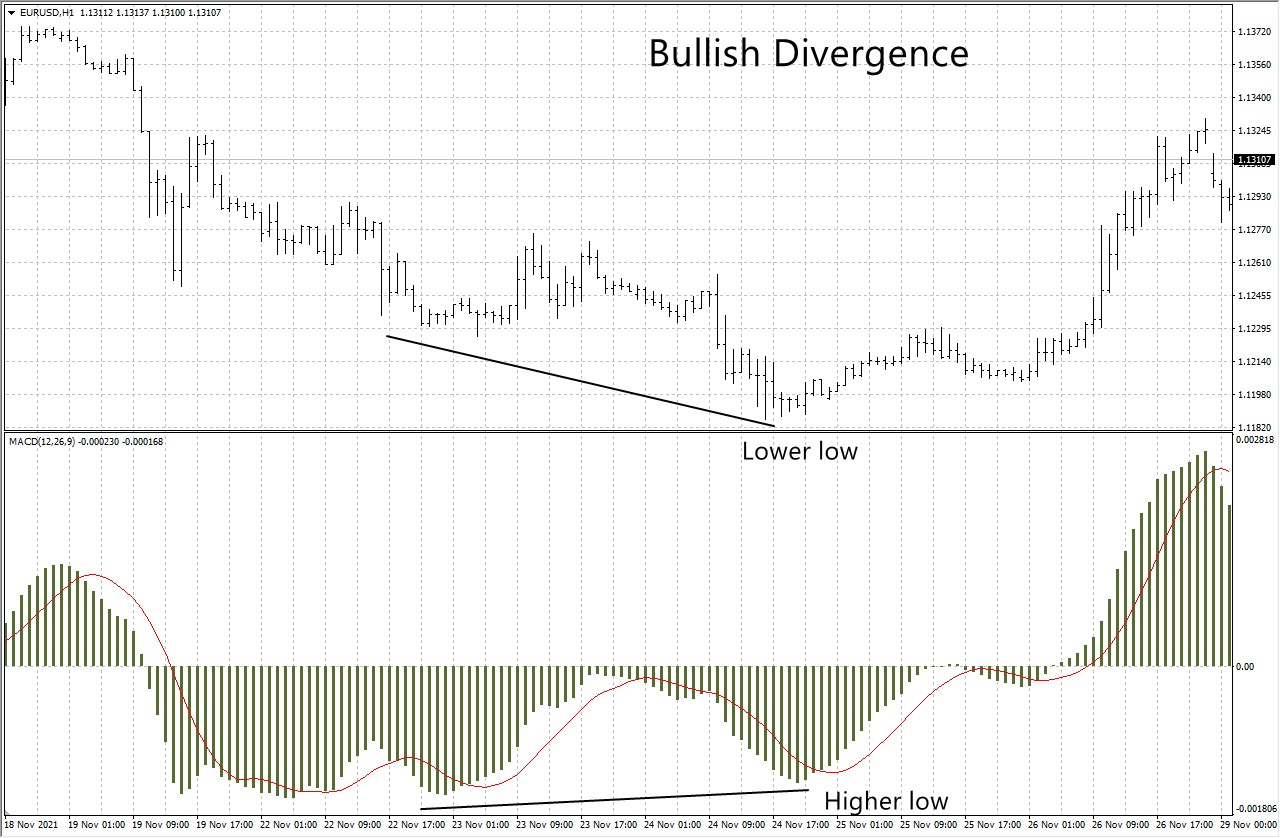
Bearish divergence – the price moves higher as the indicator points down.
What is a MACD indicator?
MACD, short for Moving Average Convergence Divergence, is a technical trading indicator created in 1979 by Gerald Appel. It is designed to track trends and measure momentum in the markets over time. This indicator shows the relationship between moving averages of stock prices and offers multiple ways to analyze market behavior, such as tracking upward or downward momentum, crossovers, and divergences. On a chart, the MACD appears as two oscillating lines, with trading signals generated when these lines cross each other.
How does MACD work?
The moving average convergence divergence (MACD) is a popular technical analysis tool that helps traders identify changes in trend strength, direction, momentum, and duration. It works by analyzing the relationship between two moving averages of a security’s price.
Key components of MACD:
MACD line. Represents the difference between the 12-period and 26-period exponential moving averages (EMAs).
Signal Line. A 9-period EMA of the MACD line, used to identify potential buy or sell signals.
Histogram. Visualizes the difference between the MACD line and the signal line, helping to track momentum changes.
Interpreting MACD:
Signal line crossovers. When the MACD line crosses above the signal line, it generates a bullish signal, suggesting a potential buying opportunity. If the MACD line crosses below the signal line, it indicates a bearish signal, suggesting a sell.
Zero line crossovers. If the MACD line moves above the zero line, it signals a bullish trend. A move below the zero line indicates a bearish trend.
Divergences. If the price of a security moves in the opposite direction of the MACD, it can signal a trend reversal. For example, rising prices with a falling MACD could indicate a potential downturn.
MACD pros and cons
Below are some pros and cons of the MACD:
- Pros of using MACD
- Cons of using MACD
Trend and momentum identification. Helps traders identify market trends and assess momentum effectively.
Buy and sell signals. Provides clear entry and exit signals based on MACD line and signal line crossovers.
Versatility. Can be used across various timeframes and trading strategies.
Enhancement with other indicators. Performs better when combined with other trading tools for confirmation.
Potential for misinterpretation. MACD signals, such as divergence and reversals, may not always indicate actual market movement.
Lagging indicator. As a trend-following tool, it may react slower to rapid price changes, leading to delayed signals.
False signals. In choppy or range-bound markets, MACD can generate misleading buy and sell signals.
How to read MACD signals
There are many MACD signals that can be read to determine market trends. Traders interpret MACD in a few different ways. Principally, MACD is read in terms of buying/selling, market trending (up-trending or down-trending), bullish/bearish, and convergence/divergence.
Let’s take a look at each of these in more detail below.
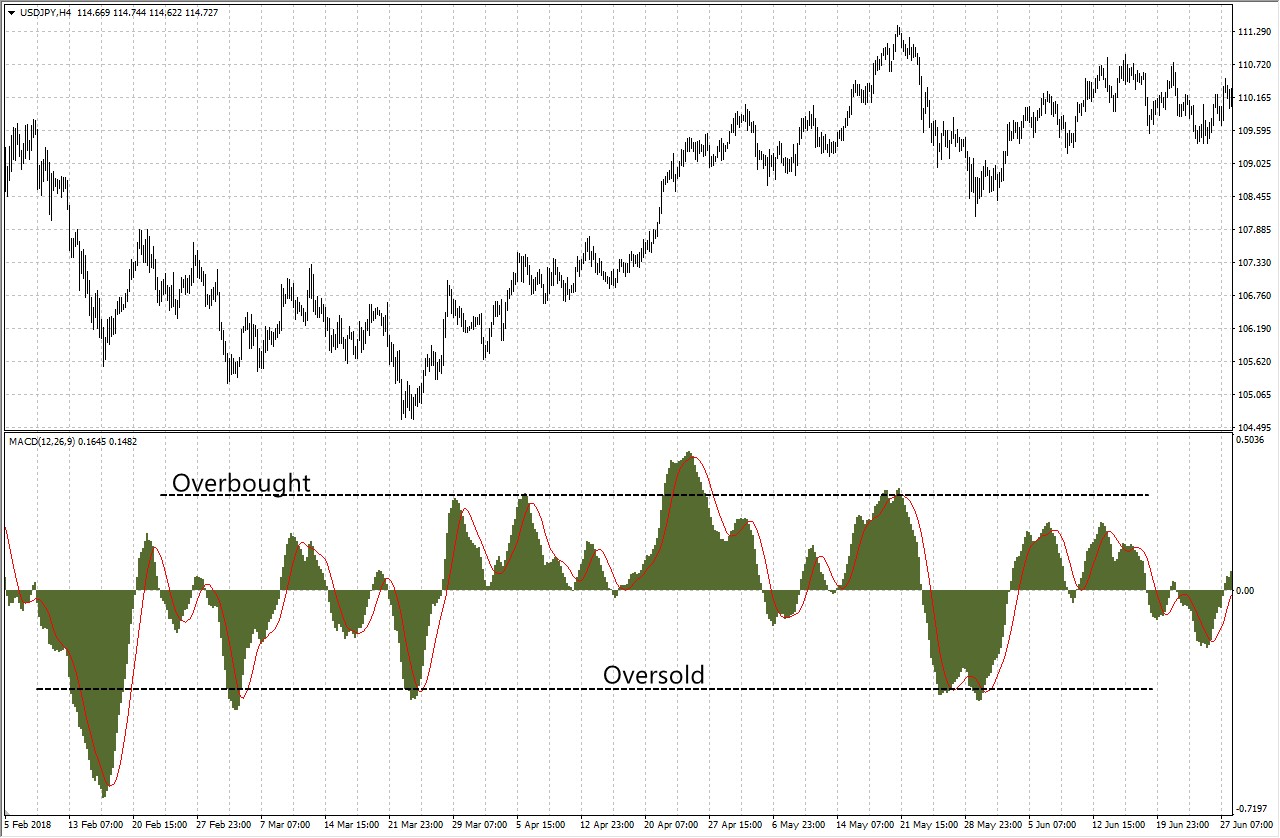
Overbought/oversold
When MACD peaks it indicates that a tradeable asset is in overbought status. When MACD troughs it indicates that the tradeable asset is oversold. This gives traders an indication of when the price of a tradable asset might be due to increase and/or decrease.
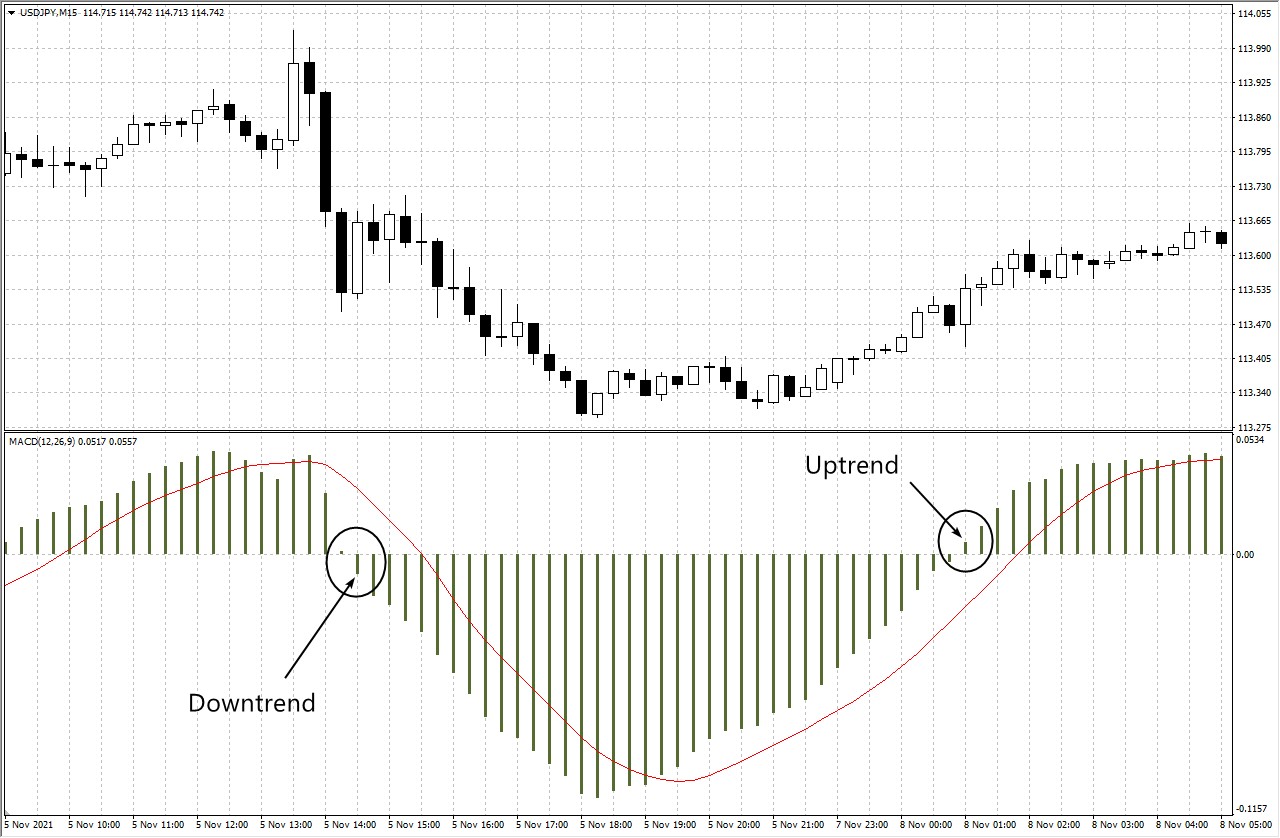
Uptrend/downtrend
When the MACD falls above the zero line it indicates that the price of a tradeable asset is increasing (in an uptrend). When the MACD falls below the zero line, it indicates that the price is decreasing (in a downtrend). This information allows traders to assess the health of the market and buy at optimum times, according to their particular trading strategy.
For example, traders employing a trend following strategy would want to buy when MACD is experiencing an uptrend. Traders employing a mean revision strategy would sell at this time.
Bullish/bearish
When MACD crosses above zero it is generally termed bullish. In trading terms, bullish just refers to an optimistic stock price outlook. When MACD crosses below zero, it is generally considered to be bearish. Bearish is the opposite of bullish. This term refers to a pessimistic stock price outlook (aka a predicted stock price drop).
Convergence/divergence
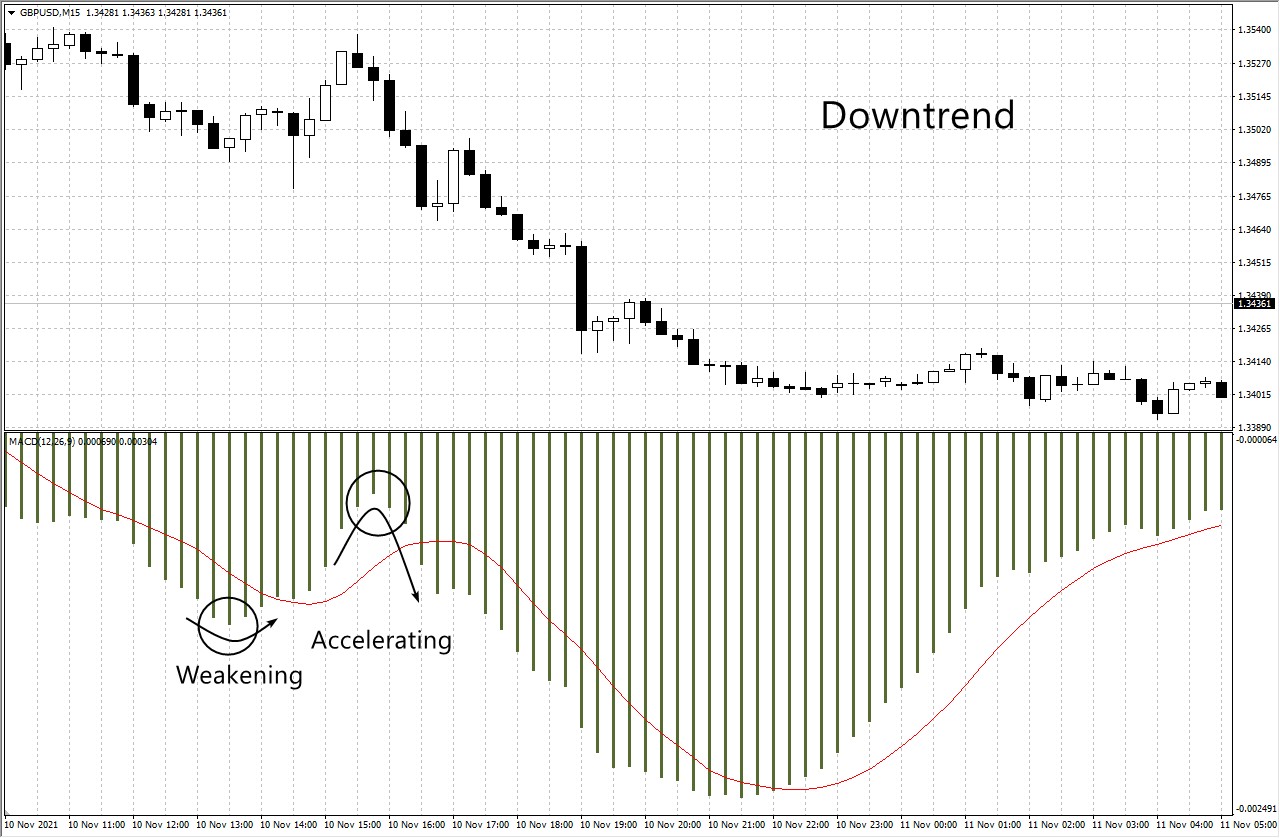
When a MACD histogram shrinks in height it indicates convergence. This means that the futures price and the cash price of the tradable asset are moving closer together over time. Oftentimes this occurs as the result of a slowdown.
On the opposite end of the spectrum, when a MACD histogram expands this indicates a divergence. The MACD is accelerating towards the market trend. This indicates that current price trends are starting to weaken and could signal that those prices will shortly change direction.
How to combine MACD with other signals
While MACD is useful, it has limitations like lagging signals, making it more effective when combined with other indicators. Here are some strategies to enhance MACD:
MACD + Relative Vigor Index (RVI). Combining MACD with the Relative Vigor Index helps identify overbought and oversold conditions more accurately. Traders wait for crossovers to align on both indicators before making buy or sell decisions, improving reliability.
MACD + Money Flow Index (MFI). Pairing MACD with the Money Flow Index, which accounts for volume and price, enhances overbought/oversold signals. For instance, a bearish MACD and an overbought MFI signal a short position, while the opposite signals a long position.
MACD + Triple Exponential Moving Average (TEMA). TEMA incorporates three moving averages to reduce lag. When MACD and TEMA provide conflicting signals, traders interpret it as a sign to exit positions.
MACD + TRIX indicator. Using MACD with TRIX, a momentum oscillator, adds precision. Traders enter the market when the TRIX crosses the zero line and MACD shows a crossover, confirming the trend's strength.
Top 3 tips for using MACD more effectively
Using MACD takes some getting used to but there are some strategies that can be employed to boost performance when using this popular trading indicator.
Follow these basic rules
If you’re new to using MACD, try to start by following these simple guidelines. Using the MACD crossover method is a great place to start. In general, that means taking long MACD signals when prices rise above a 200 period-moving average, buying when the MACD crosses the zero line, and selling when the MACD crosses below the zero line.
Use MACD in combination with other indicators
As we’ve mentioned, MACD isn’t always 100% accurate and can sometimes produce false signals. To overcome this, try to use MACD in tandem with other indicators.
Identify the best MACD settings for day trading
For regular day trading MACD is best employed using the default time settings of 12, 16, and 9 periods.
MACD indicator for day trading
Time and again, day traders find the MACD indicator practical due to its capacity to deliver quick signals for short-term trading. The MACD indicator can help you establish trends and potential entry and exit points. You can use the crossover and zero-cross strategies to identify rapid signals. You can also use shorter timeframes, including 10-minute or 1-hour charts, to make quick decisions according to MACD signals.
MACD limitations
While the MACD indicator is a valuable tool for traders, it has various limitations you should know. These include:
Market choppiness. Crossover signals can lead to whipsaws. Such a situation involves a quick price reversal after a signal is created. It can lead to false signals and trading losses.
Lagging indicator. The MACD signals depend on moving averages and may lag behind the current price. As a result, the indicator can fail to provide signals at the initial point of a trend or reversal, causing traders to miss out on opportunities.
It is not a standalone indicator. The MACD is most efficient when used alongside other indicators and technical analysis tools to reduce false alarms and confirm signals.
Best Forex brokers to use MACD strategy 2025
To maximize the potential of MACD trading strategies, selecting the right broker is crucial. We've compiled a list of trusted brokers that offer advanced charting tools, low spreads, and fast trade execution — features essential for trading with the MACD indicator effectively.
| Demo | Min. deposit, $ | Max. leverage | Min Spread EUR/USD, pips | Max Spread EUR/USD, pips | Withdrawal fee, % | Deposit fee, % | Max. Regulation Level | TU overall score | Open an account | |
|---|---|---|---|---|---|---|---|---|---|---|
| Yes | No | 1:500 | Not supported | Not supported | No | No | No | 9.2 | Open an account Your capital is at risk. |
|
| Yes | 5 | 1:1000 | 0,7 | 1,2 | No | No | Tier-1 | 9 | Open an account Your capital is at risk. |
|
| Yes | 10 | 1:2000 | 0,5 | 2 | 0-4 | No | Tier-3 | 8.9 | Open an account Your capital is at risk. |
|
| Yes | 10 | 1:2000 | 0,6 | 1,5 | No | No | Tier-1 | 8.7 | Open an account Your capital is at risk.
|
|
| Yes | 100 | 1:500 | 0,4 | 1,2 | 1-3 | No | Tier-1 | 8.69 | Open an account Your capital is at risk. |
For instance, using a 5-period EMA and a 35-period EMA can provide more tailored insights

To enhance your trading precision with the Moving Average Convergence Divergence (MACD) indicator, consider adjusting the default settings to better align with your specific trading style and the asset's volatility. For instance, using a 5-period EMA and a 35-period EMA can provide more tailored insights, especially in markets with unique behaviors. This customization allows the MACD to reflect the asset's price movements more accurately, offering signals that are more relevant to your trading strategy.
Another advanced approach involves combining the MACD with the Relative Vigor Index (RVI). The RVI measures the strength of a trend by comparing the closing price to the trading range, complementing the MACD's momentum analysis. By aligning signals from both indicators — such as waiting for both to confirm a bullish or bearish crossover — you can filter out false signals and make more informed trading decisions. This dual-indicator strategy enhances the reliability of your trades by ensuring that multiple aspects of market behavior are considered.
Conclusion
The MACD indicator is a versatile tool for traders, offering insights into market trends, momentum, and potential entry/exit points. Its strategies, such as crossovers, histogram reversals, zero-line crossings, and divergence trading, provide actionable signals across various timeframes. To maximize MACD’s effectiveness, consider combining it with other indicators like RSI or Bollinger Bands and adapting its settings to your preferred trading style. Consistent backtesting and strategy refinement can turn MACD into a valuable asset in your trading journey.
FAQs
When should I use MACD?
MACD can be used within any given time frame. Optimum time frames vary depending on the type of trade being executed.
Is MACD a Leading or a Lagging Indicator?
MACD is a lagging indicator, meaning that it is based on historic stock price action and data.
Is MACD reliable?
MACD is not 100% reliable and sometimes produces false signals, especially in sideways markets.
What are the two lines on MACD?
The MACD line indicates the difference between two moving averages. The EMA line is the moving average.
Related Articles
Team that worked on the article
Alamin Morshed is a contributor at Traders Union. He specializes in writing articles for businesses that want to improve their Google search rankings to compete with their competition. With expertise in search engine optimization (SEO) and content marketing, he ensures his work is both informative and impactful.
Chinmay Soni is a financial analyst with more than 5 years of experience in working with stocks, Forex, derivatives, and other assets. As a founder of a boutique research firm and an active researcher, he covers various industries and fields, providing insights backed by statistical data. He is also an educator in the field of finance and technology.
As an author for Traders Union, he contributes his deep analytical insights on various topics, taking into account various aspects.
Mirjan Hipolito is a journalist and news editor at Traders Union. She is an expert crypto writer with five years of experience in the financial markets. Her specialties are daily market news, price predictions, and Initial Coin Offerings (ICO).
Index in trading is the measure of the performance of a group of stocks, which can include the assets and securities in it.
A day trader is an individual who engages in buying and selling financial assets within the same trading day, seeking to profit from short-term price movements.
A Forex trading scam refers to any fraudulent or deceptive activity in the foreign exchange (Forex) market, where individuals or entities engage in unethical practices to defraud traders or investors.
A long position in Forex, represents a positive outlook on the future value of a currency pair. When a trader assumes a long position, they are essentially placing a bet that the base currency in the pair will appreciate in value compared to the quote currency.
Forex indicators are tools used by traders to analyze market data, often based on technical and/or fundamental factors, to make informed trading decisions.

-
 Afghanistan
-
 Albania
-
 Algeria
-
 Argentina
-
 Armenia
-
 Australia
-
 Austria
-
 Azerbaijan
-
 Bahamas
-
 Bahrain
-
 Bangladesh
-
 Belgium
-
 Botswana
-
 Brazil
-
 Brunei
-
 Bulgaria
-
 Burma
Burma
-
 Cambodia
-
 Cameroon
-
 Canada
-
 Chile
Chile
-
 China
China
-
 Colombia
-
 Costa Rica
-
 Cote d'Ivoire
-
 Croatia
-
 Cyprus
-
 Czech Republic
-
 Denmark
-
 Dominican Republic
-
 Ecuador
-
 Egypt
Egypt
-
 Estonia
-
 Eswatini
-
 Ethiopia
-
 Finland
-
 France
-
 Georgia
-
 Germany
-
 Ghana
Ghana
-
 Greece
-
 Haiti
Haiti
-
 Hong Kong
-
 Hungary
-
 India
India
-
 Indonesia
-
 Iran, Islamic republic
-
 Iraq
Iraq
-
 Ireland
-
 Israel
-
 Italy
Italy
-
 Jamaica
-
 Japan
Japan
-
 Jordan
-
 Kazakhstan
-
 Kenya
Kenya
-
 Korea
Korea
-
 Kuwait
-
 Kyrgyzstan
-
 Laos
Laos
-
 Latvia
-
 Lebanon
-
 Libyan Arab Jamahiriya
-
 Lithuania
-
 Luxembourg
-
 Macedonia
-
 Madagascar
-
 Malaysia
-
 Malta
Malta
-
 Mauritius
-
 Mexico
-
 Moldova
-
 Mongolia
-
 Montenegro
-
 Morocco
-
 Mozambique
-
 Namibia
-
 Nepal
Nepal
-
 Netherlands
-
 Nigeria
-
 Norway
-
 Oman
Oman
-
 Pakistan
-
 Palestine
-
 Papua New Guinea
-
 Peru
Peru
-
 Philippines
-
 Poland
-
 Portugal
-
 Puerto Rico
-
 Qatar
Qatar
-
 Romania
-
 Rwanda
-
 Saudi Arabia
-
 Serbia
-
 Singapore
-
 Slovakia
-
 Slovenia
-
 Somalia
-
 South Africa
-
 Spain
Spain
-
 Sri Lanka
-
 Sweden
-
 Switzerland
-
 Syrian Arab Republic
-
 Taiwan
-
 Tajikistan
-
 Tanzania, United Republic Of
-
 Thailand
-
 Trinidad and Tobago
-
 Tunisia
-
 Turkey
-
 UAE
UAE
-
 Uganda
-
 Ukraine
-
 United Kingdom
-
 United States
-
 Uzbekistan
-
 Venezuela
-
 Vietnam
-
 Yemen
Yemen
-
 Zambia
-
 Zimbabwe
- Forex
- Crypto
