How To Use The Triple Exponential Moving Average


Editorial Note: While we adhere to strict Editorial Integrity, this post may contain references to products from our partners. Here's an explanation for How We Make Money. None of the data and information on this webpage constitutes investment advice according to our Disclaimer.
The Triple Exponential Moving Average (TEMA) helps traders spot trends faster and more clearly by smoothing price action while reacting quickly to real momentum shifts. Unlike simple or exponential moving averages that lag, TEMA cuts through noise and stays close to price, giving early warnings of real breakouts. It is perfect for fast-moving markets or for anyone who wants to catch trend changes early without getting caught in fake signals. TEMA gives speed without sacrificing clarity.
The triple exponential moving average (TEMA) is more than just a cleaner line on your chart. It is a quick-reacting trend tracker that keeps up with price faster while staying close to the real move. Unlike basic averages that lag behind, TEMA moves with price like it sees ahead. It gets rid of the extra signals that make other moving averages look messy. If you are trading something that moves fast or want to catch trend changes early, TEMA helps you feel that momentum shift before the rest of the chart starts showing it. In this article, we will take a detailed look into TEMA as a technical indicator, discuss its origin, calculation, and top trading strategies.
Introduction to TEMA
TEMA is a trend-following indicator designed to reduce lag while smoothing out price data. Unlike a simple or exponential moving average, TEMA reacts more quickly to price changes without getting whipsawed by small market noise. This makes it especially useful for traders who want fast signals with more accuracy.
TEMA was developed to give clearer trend direction while minimizing delay, making it a reliable tool for short-term momentum trades and longer-term trend tracking alike. It’s commonly used in strategies that require quick response to price shifts, especially in volatile markets.
What makes TEMA effective
Reacts faster to price action compared to traditional moving averages.
Smooths out erratic price swings without missing major moves.
Useful for identifying entries, exits, or trailing stop levels.
Can be used alone or with confirmation tools like RSI, MACD, or volume.
The origin and concept behind TEMA
TEMA was created by Patrick Mulloy and introduced in the 1990s through the journal Technical Analysis of Stocks and Commodities. His goal was to address the limitations of single and double exponential moving averages, which tend to lag behind real price movements.
By combining multiple exponential averages into one formula, Mulloy created a tool that responds faster without becoming too sensitive to minor fluctuations. The result was TEMA, a smarter moving average that balances speed and smoothness.
How it differs from EMA and SMA
The simple moving average (SMA) takes the average of closing prices across a fixed period. It treats all price data equally and often lags during fast market moves.
The exponential moving average (EMA) reworks on this by giving higher weight to more recent prices, making it more sensitive. However, EMAs still lag in strong trending markets and may give late entries or exits.
TEMA takes it a step further by using a blend of one EMA, a second EMA of the first, and a third EMA of the second, then applying a formula to reduce the lag. It smooths the curve while reacting faster, making it more practical for real-time trading decisions.
Quick comparison
SMA is slowest, with equal weight across all periods.
EMA gives more weight to recent price but still lags.
TEMA offers the fastest response with less lag and smoother output.
Understanding the components of TEMA
TEMA might look like a regular moving average on the chart, but it’s built using a layered calculation that combines three exponential moving averages (EMAs). This unique structure is what gives TEMA its speed and smoothness.
By blending these components in a specific formula, TEMA filters out noise while staying closely aligned with real-time price action.
The three core components of TEMA
1. EMA 1 – First exponential moving average
This is the standard EMA calculated from the closing prices over the chosen period.
It responds quickly to price changes and forms the base of the TEMA calculation.
2. EMA 2 – EMA of the first EMA
The second EMA is applied to the result of EMA 1.
This step starts smoothing out the sharp movements while maintaining sensitivity.
It acts as a correction layer to reduce overreactions.
3. EMA 3 – EMA of the second EMA
The third layer is applied to EMA 2.
It adds more smoothing to the line and prepares it for final adjustment in the formula.
This layer helps to balance responsiveness with stability.
Final TEMA formula
This formula reduces the lag that typically comes with using just one EMA or even a double EMA. The result is a line that stays closer to the price while remaining smooth enough to cut through noise.
Why this matters
TEMA is more responsive than other moving averages.
It filters out small, unimportant fluctuations.
Helps traders enter and exit trades more efficiently without delay.
How to apply TEMA on a trading chart
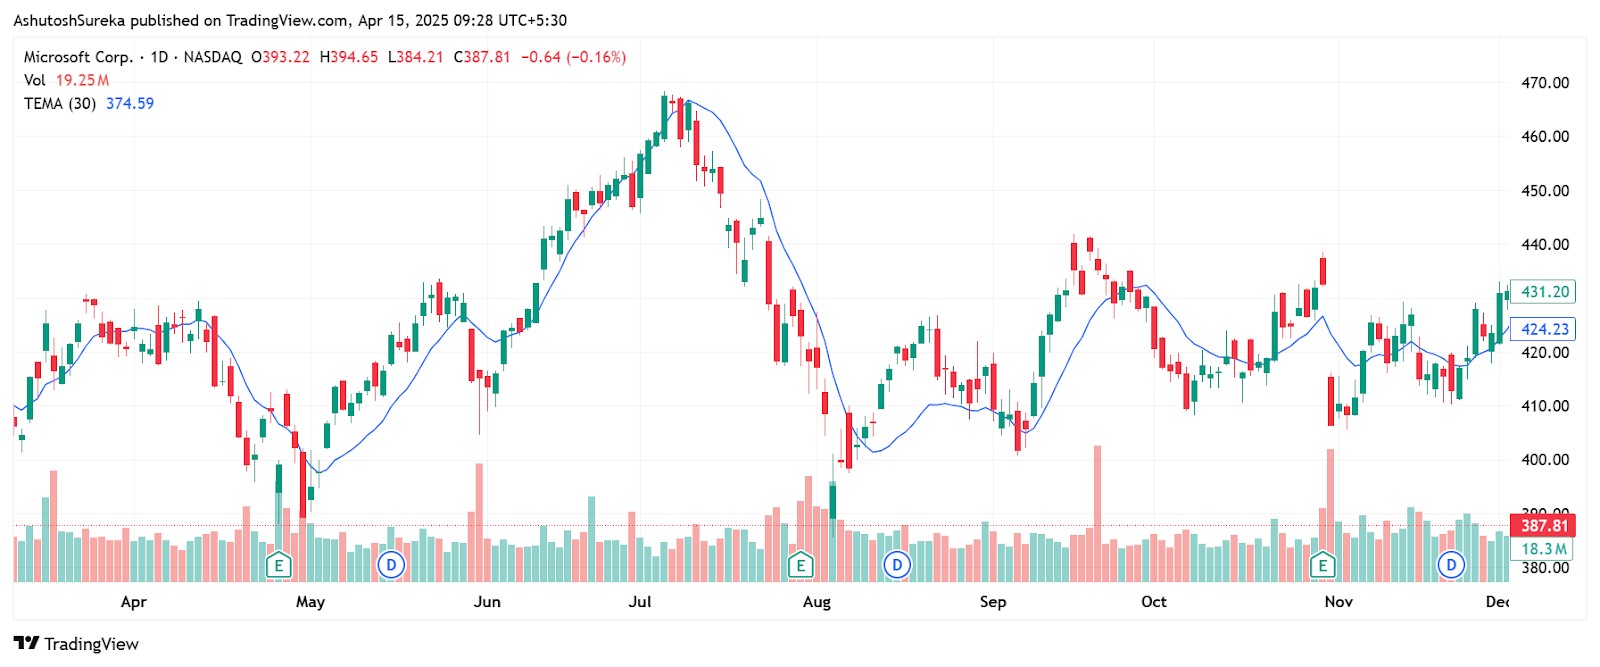
TEMA is a built-in indicator on many platforms and takes just a few clicks to apply. Once added to your chart, you can adjust its settings to suit your trading style, whether you’re looking for short-term momentum or long-term trend signals.
Search and apply TEMA
Setting up TEMA on your chart is simple and quick.
Here’s how to do it
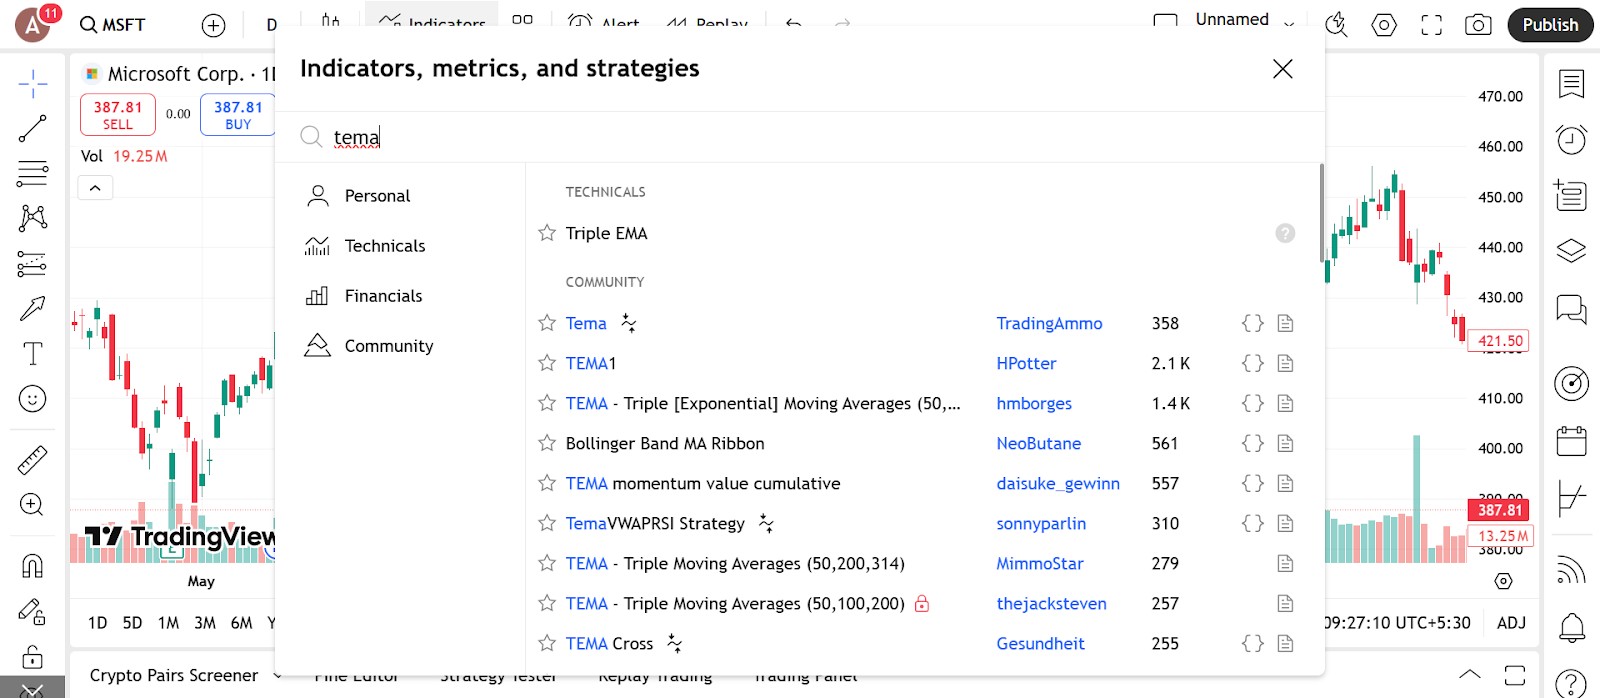
Open the indicators section on your trading platform.
Search for "TEMA" or "Triple Exponential Moving Average."
Select it, and it will display in a separate panel below your main price chart.
Where you can find it
TEMA comes built-in on popular platforms like TradingView, MetaTrader 4 and 5, and ThinkorSwim. No extra downloads or installations are needed to start using it.
Configure the parameters
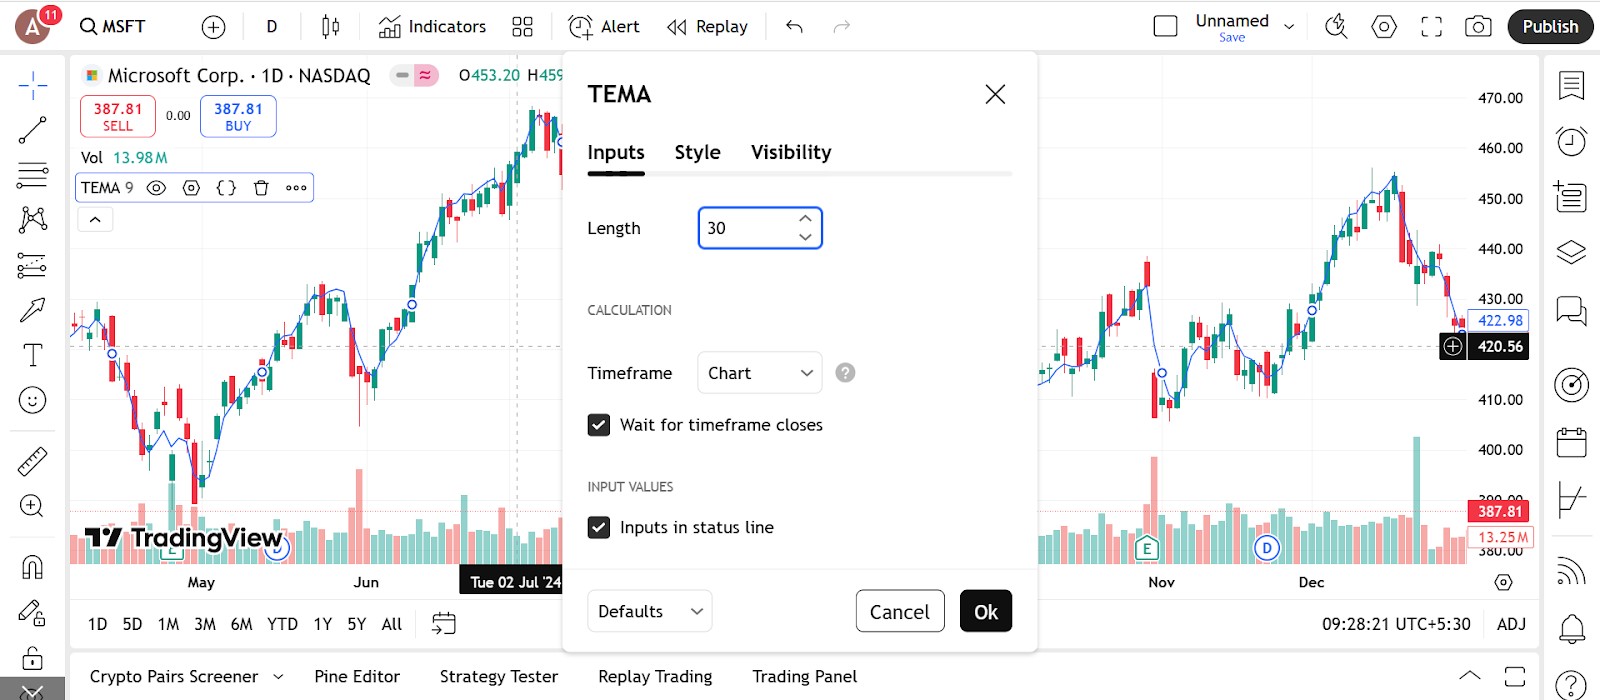
Once added, you can adjust the TEMA settings to make it more responsive or smoother, depending on your trading needs.
What you can adjust
Period length This defines how many candles are used in the calculation. Shorter values (like 9 or 14) make the line respond faster but can be noisier. Longer values (like 30 or 50) smooth out the trend.
Source Choose whether to base the TEMA on closing price, opening price, or another value like median or weighted close.
Line style and color Adjust the line thickness and color to make it easier to see on your chart
Tips for setup
Use a shorter period for faster entries in active markets.
Use a longer period to track big-picture trends.
Combine TEMA with other tools like RSI, MACD, or price action for confirmation.
Trading strategies using TEMA
TEMA helps traders respond quickly to price movements while still filtering out minor market noise. Its fast response makes it ideal for identifying trend direction, spotting reversals, and generating trade signals. Here are the most popular trading strategies using TEMA.
TEMA crossover strategy
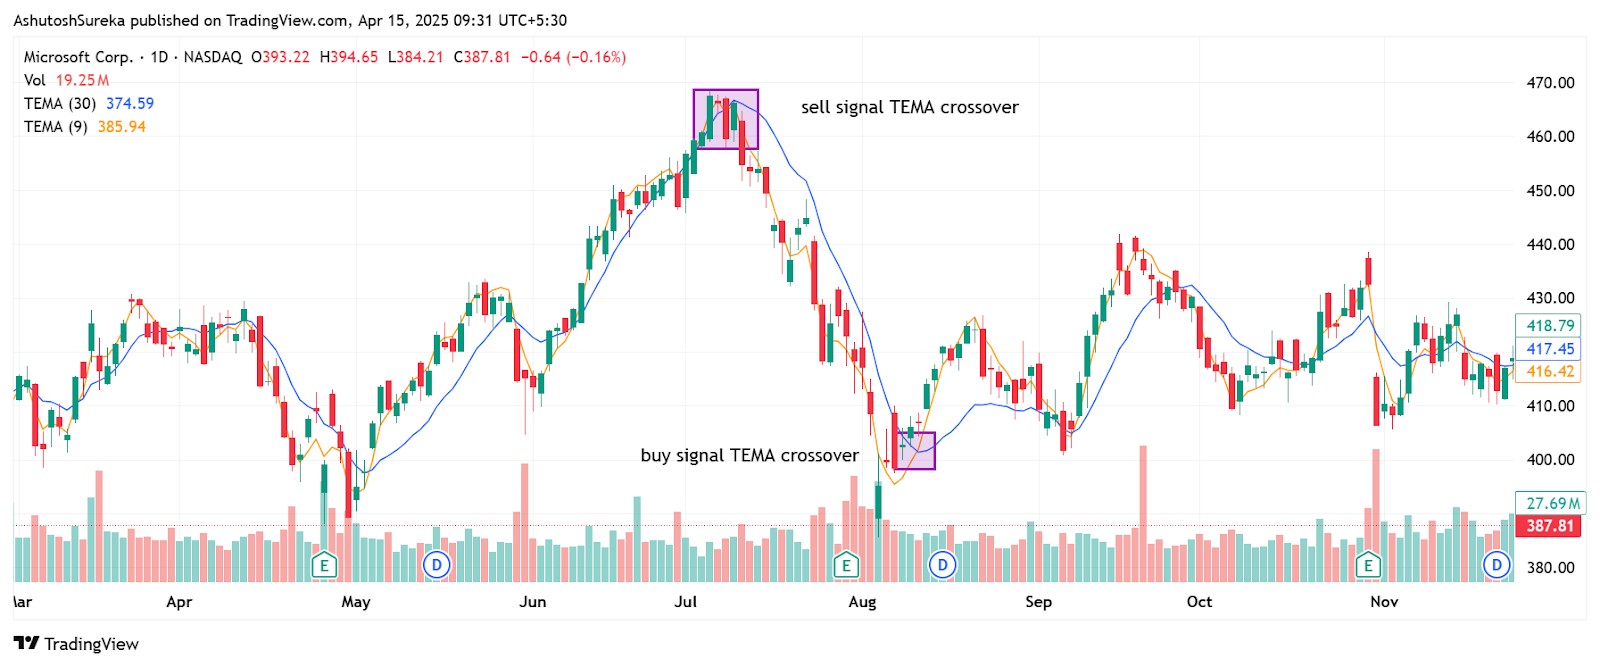
This strategy uses two TEMA lines, one fast and one slow, to identify shifts in market direction.
How to apply it
Add two TEMA indicators to your chart: one with a short period (like 9) and one with a longer period (like 30).
A buy signal occurs when the short-period TEMA crosses above the long-period TEMA.
A sell signal happens when the short TEMA crosses below the long one.
Use support or resistance for confirmation.
Why it works
Offers a clear visual entry and exit method.
Reacts faster than standard EMA crossovers.
Helps catch new trends early.
TEMA and price crossover strategy
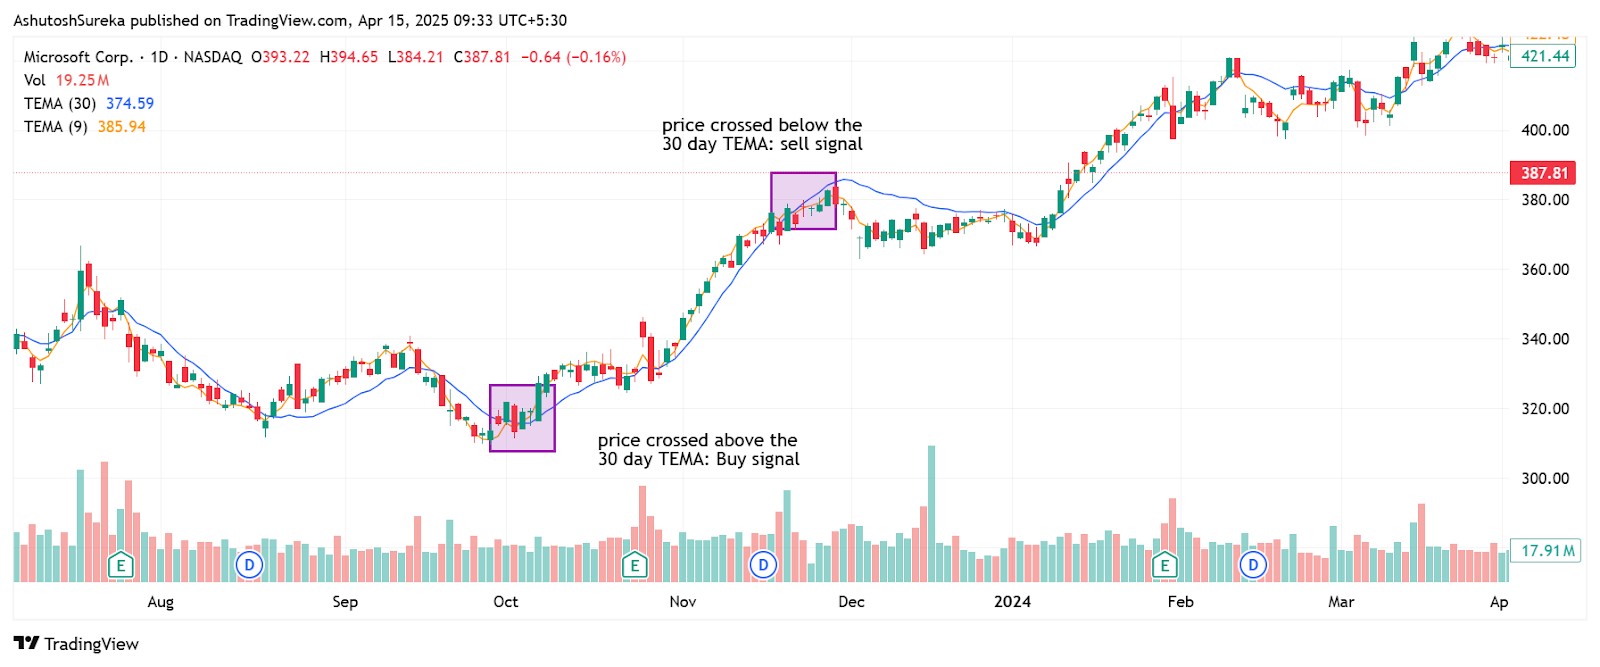
This strategy uses a single TEMA line and compares it to price action to spot entries. 9-day TEMA can be used to confirm entry and exit signals and filter out noise.
How to apply it
Plot a single TEMA (e.g., 20-period).
When the price closes above the TEMA, look for buy setups.
When the price closes below the TEMA, look for sell setups.
Add a confirmation indicator like RSI or MACD for extra support. You may also use 9-day TEMA for the same.
Why it works
Helps you follow momentum without lag.
Reduces false entries compared to SMA or EMA signals
Keeps trades in sync with current price direction.
If your trading relies on using several technical indicators, it is important to choose a broker that supports platforms like TradingView, MT5, or cTrader. These platforms offer a comprehensive set of tools and indicators to match almost any trading approach. In the table below, we have listed the best brokers that provide access to these platforms, helping you quickly compare your options and select the one that fits your trading style.
| Currency pairs | Crypto | Stocks | Min. deposit, $ | Max. leverage | TradingView | MT5 | cTrader | Regulation | TU overall score | Open an account | |
|---|---|---|---|---|---|---|---|---|---|---|---|
| 120 | Yes | Yes | 1 | 1:30 | Yes | Yes | Yes | CNMV | 5.35 | Study review | |
| 90 | Yes | Yes | No | 1:500 | Yes | Yes | Yes | ASIC, FCA, DFSA, BaFin, CMA, SCB, CySec | 9.25 | Go to broker Your capital is at risk.
|
|
| 90 | Yes | Yes | 1 | 1:500 | Yes | Yes | Yes | ASIC, VFSC, FSA | 9.2 | Go to broker Your capital is at risk. |
|
| 70 | Yes | Yes | 100 | 1:500 | No | Yes | Yes | FCA, CYSEC, FSCA, SCB, FSA (Seychelles) | 9 | Go to broker Your capital is at risk. |
|
| 61 | Yes | Yes | 200 | 1:5000 | Yes | Yes | Yes | FSA (Seychelles) | 8.25 | Go to broker Your capital is at risk. |
15+ years of independent market analysis 140+ evaluation criteria, reviewed by 50+ experts Data-driven reviews of 200+ platforms, updated regularly 20+ industry awards & a wide network of global media partners Learn more about our methodology and editorial policies.Why trust us


Pros and cons of TEMA
- Pros
- Cons
Faster response to price movement. TEMA is designed to reduce lag, which helps traders respond to price shifts earlier than with a standard EMA or SMA. This quick reaction time is useful in fast-moving markets where timing is critical.
Smooth and less noisy. Despite being fast, TEMA still delivers a smooth line. It avoids the choppiness that comes with using very short-term moving averages, which helps you see the trend more clearly without distraction.
Effective in trend-following strategies. TEMA adapts well to trend trading. Whether you’re riding a breakout or entering on a pullback, the indicator stays close to price and supports quick decision-making without missing the move.
Works well with other tools. You can easily pair TEMA with momentum indicators like RSI or MACD. It helps confirm trade direction, and because it stays visually clean, it doesn’t clutter the chart even when used with multiple indicators.
Useful across timeframes. Whether you’re scalping, swing trading, or analyzing longer-term trends, TEMA adapts to different periods without losing its core advantage: faster reaction with smoother output.
Still a lagging indicator. Despite its speed, TEMA is still based on past price data. It cannot predict reversals or breakouts in advance, so it may occasionally react just after the ideal entry point.
Can give false signals in ranging markets. In sideways or low-volatility markets, TEMA can produce whipsaws — frequent direction changes that lead to false trades. It works best when price is clearly trending.
Requires tuning for each strategy. The effectiveness of TEMA depends on the period you choose. If the setting is too short, it becomes overly reactive. If it’s too long, it may behave like a regular EMA. There’s no universal value that works in every market condition.
Not suitable as a standalone signal. While TEMA gives fast trend signals, it lacks context. You still need price action or another indicator to confirm entries and avoid relying on crossovers alone.
Not always available on every platform. TEMA is less commonly built-in than SMA or EMA. Some platforms may require importing it manually or using third-party libraries, especially on free charting tools.
TEMA is not about speed, it is about clarity in volatility

Something newer traders often assume with TEMA is that it is just a quicker EMA. But what makes it stand out is not speed, it is how clearly it reads through messy markets. In sideways chop where EMAs bounce around and throw people off, TEMA cuts through the noise and holds firm until the move is real. Try using it in range-bound setups and you will see how it stays flat when nothing is happening but quickly turns once the pressure shifts. You are not just getting a quicker line. You are getting a more intuitive one.
Another smart move with TEMA is watching its slope during tight consolidations. If price gets quiet and trades in a small range but TEMA keeps leaning one way, that is pressure quietly building. Even when candles look indecisive, the slope tells you what the market really wants to do. And when the move breaks out, you already have early confirmation. It is not about crosses or patterns. It is about whether the line holds its ground or bends. Treat TEMA like a tool to spot tension and you will find setups where others see nothing but clutter.
Conclusion
TEMA is not a big signal indicator. It is an accurate helper for traders who care about real moves not distractions. If you quit using it as a follow tool and start noticing how it reacts during tense markets, you will catch trends before they go obvious. The angle of the line tells you more than the position itself. When it flattens or holds steady, that says a lot. TEMA does not try to guess the move. It reflects how price is moving underneath. And when you learn to read that reflection early, it gets a lot easier to know when to step in or step out.
FAQs
How does TEMA compare to EMA and DEMA?
TEMA responds faster to price changes than EMA and DEMA while reducing lag. It smooths out noise better, making it more precise in trending conditions without sacrificing responsiveness.
Can I use the TEMA indicator in Forex trading?
Yes, TEMA is effective in Forex trading as it reacts quickly to market shifts. It's useful for identifying trend direction and entry or exit points across various currency pairs and timeframes.
Is TEMA suitable for use with other indicators like MACD or RSI?
TEMA works well with MACD, RSI, or volume-based indicators for added confirmation. Pairing it with momentum or trend filters helps reduce false signals and improves trade accuracy.
Is TEMA suitable for day trading or long-term investing?
TEMA can be used for both day trading and long-term investing depending on the period setting. Shorter settings suit intraday trades, while longer settings help capture broader trends.
Editors' Top Picks and Insights

AI without limits: How dangerous are neural networks?

Worldcoin on Wall Street: From iris scans to ETF

Mark Cuban's wealth philosophy: Why stocks matter more than salary or crypto

Dangerous but indispensable: Why the crypto market needs bridges

Markus Levin: DePIN could power the AI agent economy

Pokémon cards for $2,500: How collectibles became a new form of gambling
Related Articles
Team that worked on the article
Anton Kharitonov is an active trader and analyst. He employs both short- and long-term trading strategies, primarily based on fundamental factors, supported by technical indicators and intermarket analysis.
Chinmay Soni is a financial analyst with more than 5 years of experience in working with stocks, Forex, derivatives, and other assets. As a founder of a boutique research firm and an active researcher, he covers various industries and fields, providing insights backed by statistical data.
Mirjan Hipolito is a journalist and news editor at Traders Union. She is an expert crypto writer with five years of experience in the financial markets.
Day trading involves buying and selling financial assets within the same trading day, with the goal of profiting from short-term price fluctuations, and positions are typically not held overnight.
Scalping in trading is a strategy where traders aim to make quick, small profits by executing numerous short-term trades within seconds or minutes, capitalizing on minor price fluctuations.
Trend trading is a trading strategy where traders aim to profit from the directional movements of an asset's price over an extended period.
Xetra is a German Stock Exchange trading system that the Frankfurt Stock Exchange operates. Deutsche Börse is the parent company of the Frankfurt Stock Exchange.
Swing trading is a trading strategy that involves holding positions in financial assets, such as stocks or forex, for several days to weeks, aiming to profit from short- to medium-term price swings or "swings" in the market. Swing traders typically use technical and fundamental analysis to identify potential entry and exit points.

-
 Afghanistan
-
 Albania
-
 Algeria
-
 Angola
-
 Argentina
-
 Armenia
-
 Australia
-
 Austria
-
 Azerbaijan
-
 Bahamas
-
 Bahrain
-
 Bangladesh
-
 Belarus
-
 Belgium
-
 Bolivia
-
 Botswana
-
 Brazil
-
 Brunei
-
 Bulgaria
-
 Cambodia
-
 Cameroon
-
 Canada
-
 Chile
Chile
-
 China
China
-
 Colombia
-
 Congo
Congo
-
 Costa Rica
-
 Cote d'Ivoire
-
 Croatia
-
 Cuba
Cuba
-
 Cyprus
-
 Czechia
-
 DR Congo
-
 Denmark
-
 Dominican Republic
-
 Ecuador
-
 Egypt
Egypt
-
 El Salvador
-
 Estonia
-
 Eswatini
-
 Ethiopia
-
 Finland
-
 France
-
 Georgia
-
 Germany
-
 Ghana
Ghana
-
 Greece
-
 Haiti
Haiti
-
 Hong Kong
-
 Hungary
-
 India
India
-
 Indonesia
-
 Iran, Islamic republic
-
 Iraq
Iraq
-
 Ireland
-
 Israel
-
 Italy
Italy
-
 Jamaica
-
 Japan
Japan
-
 Jordan
-
 Kazakhstan
-
 Kenya
Kenya
-
 Korea
Korea
-
 Kuwait
-
 Kyrgyzstan
-
 Laos
Laos
-
 Latvia
-
 Lebanon
-
 Lesotho
-
 Libya
Libya
-
 Lithuania
-
 Luxembourg
-
 Madagascar
-
 Malaysia
-
 Malta
Malta
-
 Mauritius
-
 Mexico
-
 Moldova
-
 Mongolia
-
 Montenegro
-
 Morocco
-
 Mozambique
-
 Myanmar
-
 Namibia
-
 Nepal
Nepal
-
 Netherlands
-
 New Zealand
-
 Nigeria
-
 North Macedonia
-
 Norway
-
 Oman
Oman
-
 Pakistan
-
 Palestine
-
 Panama
-
 Papua New Guinea
-
 Paraguay
-
 Peru
Peru
-
 Philippines
-
 Poland
-
 Portugal
-
 Puerto Rico
-
 Qatar
Qatar
-
 Reunion
-
 Romania
-
 Rwanda
-
 Saudi Arabia
-
 Serbia
-
 Singapore
-
 Slovakia
-
 Slovenia
-
 Somalia
-
 South Africa
-
 Spain
Spain
-
 Sri Lanka
-
 Sweden
-
 Switzerland
-
 Syria
Syria
-
 Taiwan
-
 Tajikistan
-
 Tanzania
-
 Thailand
-
 Trinidad and Tobago
-
 Tunisia
-
 Turkey
-
 UAE
UAE
-
 Uganda
-
 Ukraine
-
 United Kingdom
-
United States
-
 Uruguay
-
 Uzbekistan
-
 Venezuela
-
 Vietnam
-
 Yemen
Yemen
-
 Zambia
-
 Zimbabwe
- Forex
- Crypto
