Risk/Reward Ratio in Trading
When it comes to trading, we're all looking to make some profit - but every trade involves taking on risk as well. The key is to maximize your potential rewards while limiting your exposure to risk. Savvy traders use risk/reward ratios to achieve this. The risk/reward ratio simply compares how much you stand to gain versus how much you could lose on a given trade. A good ratio means your possible profit is higher than your potential loss. Analyzing risk/reward ratios helps inform smart trade decisions. You want to look for setups that skew the risk/reward in your favor. This article will examine how traders evaluate risk/reward and apply this analysis to make winning trades over the long haul. The goal is to consistently pick trades with the best profit potential versus downside risk.
What is the Risk/Reward (R/R) ratio?
Traders base their expectations on the calculation of the profit/loss ratio, also known as the risk/reward ratio. These are the key factors of each trade, where risk is the amount of potential loss that a trader can accept, and reward is the amount of potential profit that a trader can earn.
These are interdependent values, which means that the higher the amount a trader is willing to risk, the higher the potential profit from the trade, and vice versa, the smaller the amount a trader is willing to lose, the lower the potential profit. A trader can set a stop-loss order to determine the amount of allowable loss and a take-profit order to lock in the planned amount of profit based on this ratio.
How Does the Risk/Reward Ratio (R/R) Work in Trading?
The risk/reward ratio is a handy tool for traders to measure if a potential trade is worth the risk. It compares how much profit you expect to make versus how much you could lose.
Let's walk through an example.
Say you buy a stock at $50 and decide you'll sell it once it hits $55 for a profit of $5. But to limit potential losses, you set a stop-loss at $47, so you'd lose $3 if the stock drops that low.
To calculate the ratio, just divide the possible profit by the possible loss:
Possible Profit: $5
Possible Loss: $3
Risk/Reward Ratio = $5/$3 = 1.67
A higher ratio is generally better. A 1:2 or 1:3 ratio is commonly recommended, meaning you expect to make 2-3 times as much as you risk losing.
The risk/reward ratio isn't some magic number, but more of a guideline. It helps size your positions appropriately and evaluate if a trade is worth the risk. You can tweak the ratio by adjusting your profit target or stop-loss.
The ideal ratio depends on your trading style and market conditions. A scalper making many quick trades may use a lower ratio than a long-term position trader. The key is having a ratio that aligns with your strategy and ensures you have a decent chance of coming out ahead over many trades.
The Risk/Reward Ratio When Setting a Stop-Loss Order
Traders can simply proceed from their capabilities in terms of available capital to place a protective stop-loss order, or they can use the above risk/reward ratio formula to determine the optimal distance in points for the planned trade. For example, if an asset costs $100 and you expect to earn an $80 profit for $1 per point, the risk/reward ratio will be 1:2, and the stop-loss order should be set at a distance of 40 points ($40). An excellent example of such a protective stop-loss order is provided below:
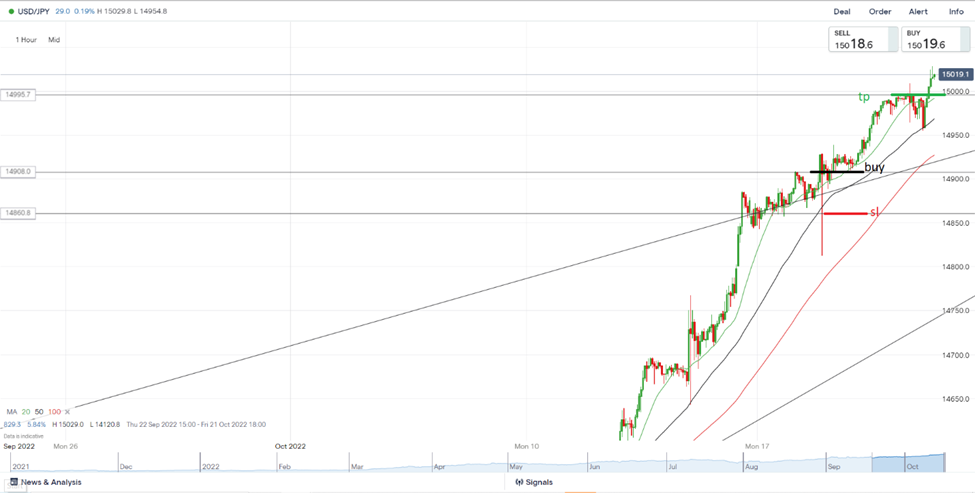
An example of a protective stop-loss order
It was possible to plan a trade here, expecting that if the price broke the resistance levels, the bulls for the USD/JPY pair would aim for the psychological level of 150.00. As this level is approaching, the likelihood of bulls' profit-taking and development of a downward correction increases, as it does at psychological levels.
In this case, the take profit order can be set somewhere near the 150.00 level, let’s say at 149.90. When you enter a position at the level of 149.10, the estimated profit should be 80 points, and a stop-loss order with a risk/reward ratio of 1:2 should be placed 40 points away (80:2), i.e., at the level of 148.70. As we can see, the trade would work perfectly in this case.
In this case, the price of the pair rose even higher, implying that the potential profit could have been even higher. However, as previously stated, the probability of a rebound from such a level was quite high, so it's best not to be greedy again and consider this factor when planning a trade.
Trading Strategies With the Best R/R
One of the most optimal strategies with the best risk/reward ratio is the breakout strategy, an example of which is listed above. The optimal ratio is achieved because a trader can plan a sufficiently powerful movement and, as a result, a large profit due to the momentum that the price of the instrument can receive as a result of the triggering of stop-loss orders and the entry of additional participants into the market. At the same time, a protective stop-loss order can be placed below the previous local low or above the previous local high, with the distance to such a low or highbeing at least three times less than the distance to the potential level where the profit will be locked.
Another strategy with the best risk/reward ratio is trading within the range, i.e., when the instrument, in the absence of a pronounced trend, moves in the flat. During the consolidation phase within a long-term trend, either before continuing the movement or before a reversal, the instrument can trade within a wide range for an extended period, allowing traders to profit from price fluctuations between the top and bottom edges of the range.
Using support or resistance levels, you can trade moving averages (MA). MA connections with periods of 20, 50, 100, or 50, 100, 200 are used with a steady trend, depending on its scale. MA 20 can be used as support or resistance in short-term trends, while MA 50 or MA 100 can be used in longer-term trends. In the latter case, when the price approaches MA 200, it can also be used as support or resistance.
Therefore,, when opening a position, a protective stop-loss order is set slightly below or above the moving average below which the price of the instrument is placed, and in these cases, traders can also follow the trend and take a fairly large-scale movement with a relatively small stop-loss order in terms of distance.
Examples of Opening Positions and Setting a Stop With the Right R/R Ratio
An example of trading on a level's breakout, in this case, the resistance level:
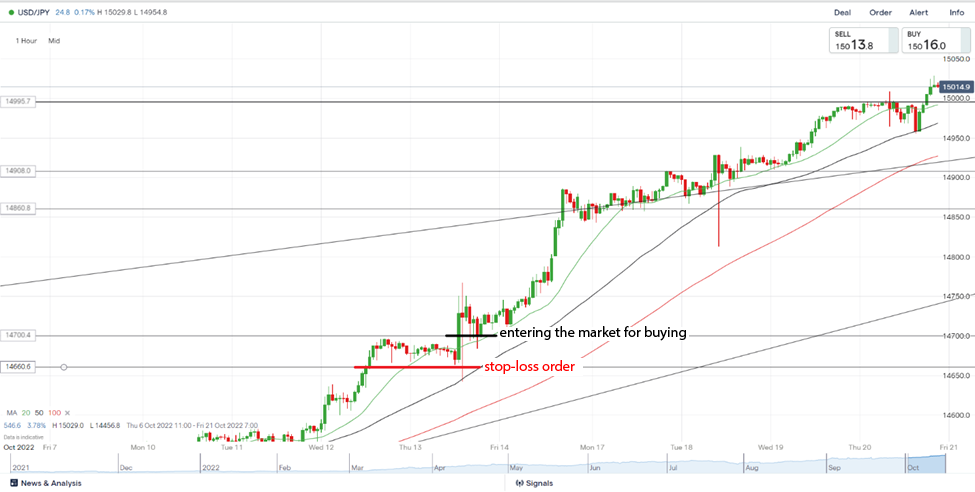
An example of trading on a level's breakout
The expected opening of a position at a resistance breakout at around 147.00 on this chart implies a buy from 147.10 with a protective stop-loss order below the previous local low, i.e., at the level of 146.60 (-40 points). As we can see, the prospective profit on the trend could be at least 280 points, if we assume the testing of the psychological level of 150.00 by the bulls (take profit at the level of 149.90). And in this case, the risk/reward ratio is 1:7 (280:40 = 7), which is simply ideal for any trader.
In this case, a protective stop-loss order is placed near each of the edges, depending on whether you enter a long or short position. Of course, it is pointless to put it right below or above the edge because a protective order could be triggered is the price shortly exits the range and then moves back into the range with a subsequent decrease to the opposite side.
An example of a trading strategy within a consolidation range:
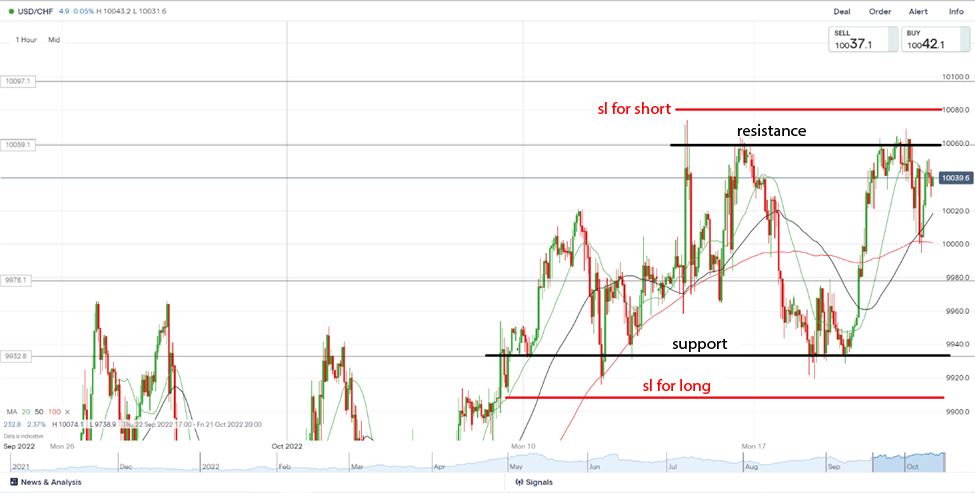
An example of a trading strategy within a consolidation range
This screenshot shows the USD/CHF pair consolidating inside a fairly wide trading range within a long-term trend, where traders sell from the resistance line (the top edge of the range) and buy from the support line (the bottom edge of the range). In both cases, a protective stop-loss order is set approximately at a distance of 25 points, while the width of the range from resistance to support is approximately 125 points. As a result, by selling from the resistance line and buying from the support line with a stop-loss order of -25 points, we get a risk/reward ratio of 1:5 (125:25 = 5), which is also perfect.
The following is an example of placing a stop-loss order above MA 100 on a long-term downtrend for EUR/USD:
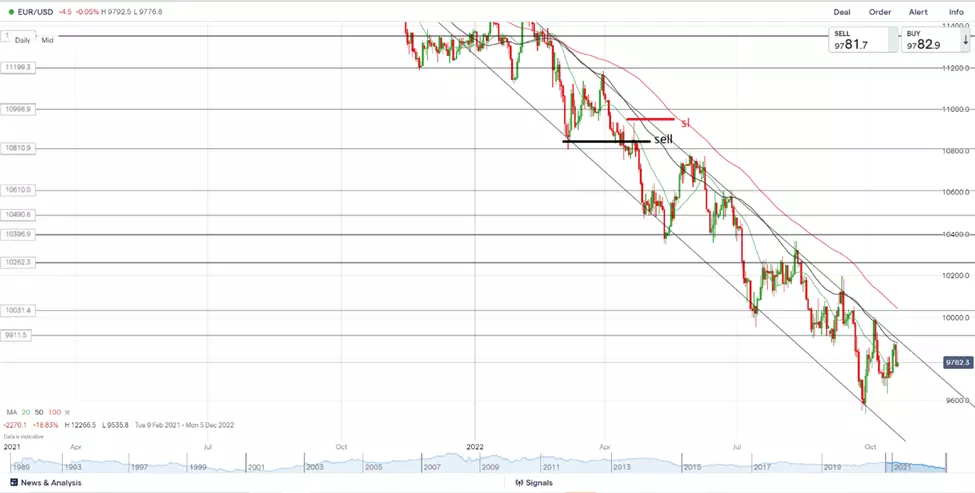
An example of placing a stop-loss order above MA 100 on a long-term downtrend for EUR/USD
According to it, the sale of EUR/USD at the breakout of the next support is expected to begin at the level of 1.0850 with a stop above MA 50, approximately at the level of 1.0950, implying a loss of -100 points. The chart shows that the price passed 400 points before the next strong support, which can be considered a potential profit. As a result, we get a risk/reward ratio of 1:400 (400:100 = 4), which is also an excellent option.
Summary
In this article, we learned about such an important tool for risk management as the risk/reward ratio, which can be effectively used to determine take profit levels and levels for placing protective stop-loss orders.
However, this method of increasing trading efficiency is not the holy grail because, everyone can see the beautiful opportunities the past in the picture, whereas in real-life trading, traders are forced to predict opportunities using various tools, and unfortunately, their forecasts don't always come true.
In addition, it is necessary to take into account the variability of markets, trends, volatility, publication of news and events; and under the influence of different situations, traders will be forced to decide to close the position prematurely, either with a profit less than planned, or with a relatively small loss. Therefore, even after calculating the likely effectiveness of the trade, you should monitor the market situation and try to respond to its changes in time.
FAQ
What is the risk/reward ratio?
The risk/reward ratio is a tool that determines the prospective reward for each dollar that a trader risks by opening a position.
What is the risk/reward ratio calculation formula?
Risk/Reward Ratio = Potential Profit / Potential Loss
What is the optimal risk/reward ratio when placing a stop-loss order?
The optimal ratio is 1:3 or anything better than that
What are the strategies with the optimal risk/reward ratio?
Breakout trading, range trading in the flat, and trading moving averages.
Glossary for novice traders
-
1
Trading
Trading involves the act of buying and selling financial assets like stocks, currencies, or commodities with the intention of profiting from market price fluctuations. Traders employ various strategies, analysis techniques, and risk management practices to make informed decisions and optimize their chances of success in the financial markets.
-
2
Broker
A broker is a legal entity or individual that performs as an intermediary when making trades in the financial markets. Private investors cannot trade without a broker, since only brokers can execute trades on the exchanges.
-
3
Take-Profit
Take-Profit order is a type of trading order that instructs a broker to close a position once the market reaches a specified profit level.
-
4
Index
Index in trading is the measure of the performance of a group of stocks, which can include the assets and securities in it.
-
5
Volatility
Volatility refers to the degree of variation or fluctuation in the price or value of a financial asset, such as stocks, bonds, or cryptocurrencies, over a period of time. Higher volatility indicates that an asset's price is experiencing more significant and rapid price swings, while lower volatility suggests relatively stable and gradual price movements.
Related Articles


Team that worked on the article

Oleg Tkachenko is an economic analyst and risk manager having more than 14 years of experience in working with systemically important banks, investment companies, and analytical platforms. He has been a Traders Union analyst since 2018. His primary specialties are analysis and prediction of price tendencies in the Forex, stock, commodity, and cryptocurrency markets, as well as the development of trading strategies and individual risk management systems. He also analyzes nonstandard investing markets and studies trading psychology.

Olga Shendetskaya has been a part of the Traders Union team as an author, editor and proofreader since 2017. Since 2020, Shendetskaya has been the assistant chief editor of the website of Traders Union, an international association of traders. She has over 10 years of experience of working with economic and financial texts. In the period of 2017-2020, Olga has worked as a journalist and editor of laftNews news agency, economic and financial news sections. At the moment, Olga is a part of the team of top industry experts involved in creation of educational articles in finance and investment, overseeing their writing and publication on the Traders Union website.