Cardano price struggles below $0.74 as bearish pressure mounts
 Cardano price chart showing resistance at $0.81 and support at $0.7
Cardano (ADA/USDT) is trading at $0.7355, reflecting a 4.45% decline over the last session as bearish sentiment prevails. The cryptocurrency has been consistently rejected at key resistance levels, reinforcing a downward trajectory.
The $1.16 resistance level has proved difficult to break, with a secondary supply zone emerging around $0.9 - $1. On the downside, $0.7 serves as immediate support, but a breakdown below this level could see ADA decline further to $0.51, aligning with historical accumulation zones.
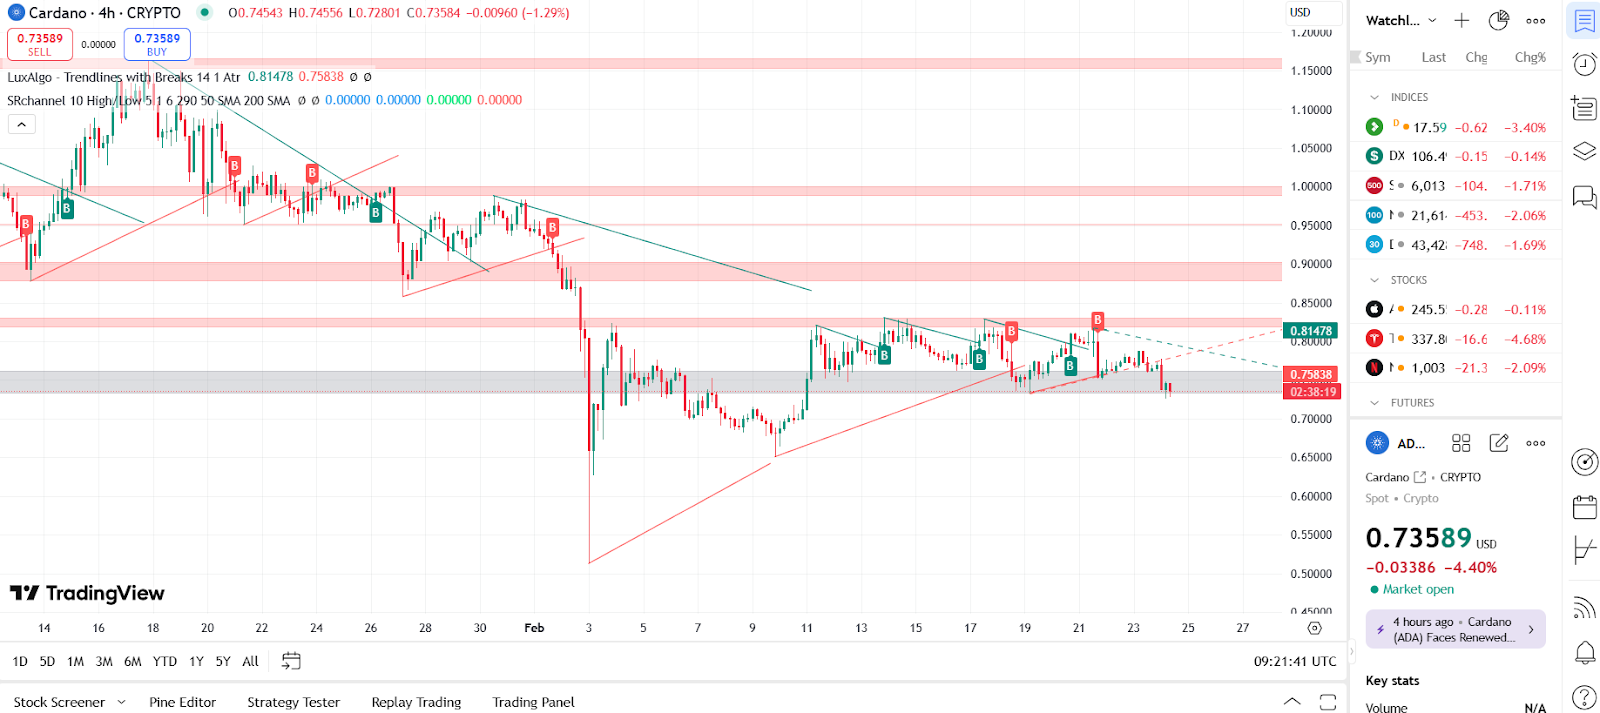
Cardano price analysis (January 2025 - February 2025) Source: TradingView.
Technical indicators confirm a bearish trend
Cardano’s price action follows a descending channel pattern, confirming a bearish outlook unless a breakout occurs. The formation of lower highs and lower lows supports the ongoing downtrend, while a potential bullish reversal remains unlikely unless ADA manages to break above $0.81 - $0.82, which coincides with a long-term descending trendline resistance.
Moving averages also indicate sustained selling pressure, with ADA trading below all key moving averages—20 EMA at $0.76, 50 EMA at $0.77, 100 EMA at $0.78, and 200 EMA at $0.82. The price must reclaim these levels for a trend reversal to materialize. Meanwhile, Bollinger Bands show the price nearing the lower band, suggesting increased volatility and a possible drop towards $0.7 - $0.68.
Momentum indicators further confirm the downward pressure. The MACD line at -0.00387 and signal line at -0.00863 show a widening negative gap, indicating growing bearish momentum. Additionally, the RSI at 37.34 suggests ADA is approaching oversold conditions, but with room for further downside before a potential rebound.
Outlook: Critical levels to watch
The bearish trend remains dominant, with Cardano likely to test the $0.7 support level if selling pressure persists. A break below this threshold could drive ADA toward $0.51 - $0.52, where demand has historically increased. Conversely, a bullish breakout remains unlikely unless ADA surpasses $0.81, a move that could push prices toward $0.9 - $1. Given the overall technical structure, traders should closely monitor $0.70, as its failure could trigger further declines, while a bounce may offer a short-term trading opportunity.
As previously discussed ADA remains in a bearish structure, with critical resistance at $0.81 - $0.82 and key support at $0.7.


