Cardano price prediction: oversold conditions hint at a rebound
 Cardano trades near $0.60 as bears dominate, with resistance at $0.65 - $0.74
Cardano (ADA) has been on a downward trajectory, currently trading around $0.59 - $0.60 after shedding nearly 7.25% in the past 24 hours. The price reached a daily high of $0.6074 and a low of $0.5798, indicating strong bearish sentiment.
Despite ADA approaching oversold conditions, a lack of strong buying momentum keeps the cryptocurrency vulnerable to further losses.
ADA has been forming lower highs and lower lows, following a downward-sloping trendline that suggests sustained bearish momentum. The immediate resistance lies at $0.65, while stronger resistance is positioned at $0.70 - $0.74. A breakout above these levels could push the price toward the $0.78 - $0.80 range, a key February breakdown point. However, failure to maintain support above $0.60 could lead to further downside toward $0.55 or even $0.50.
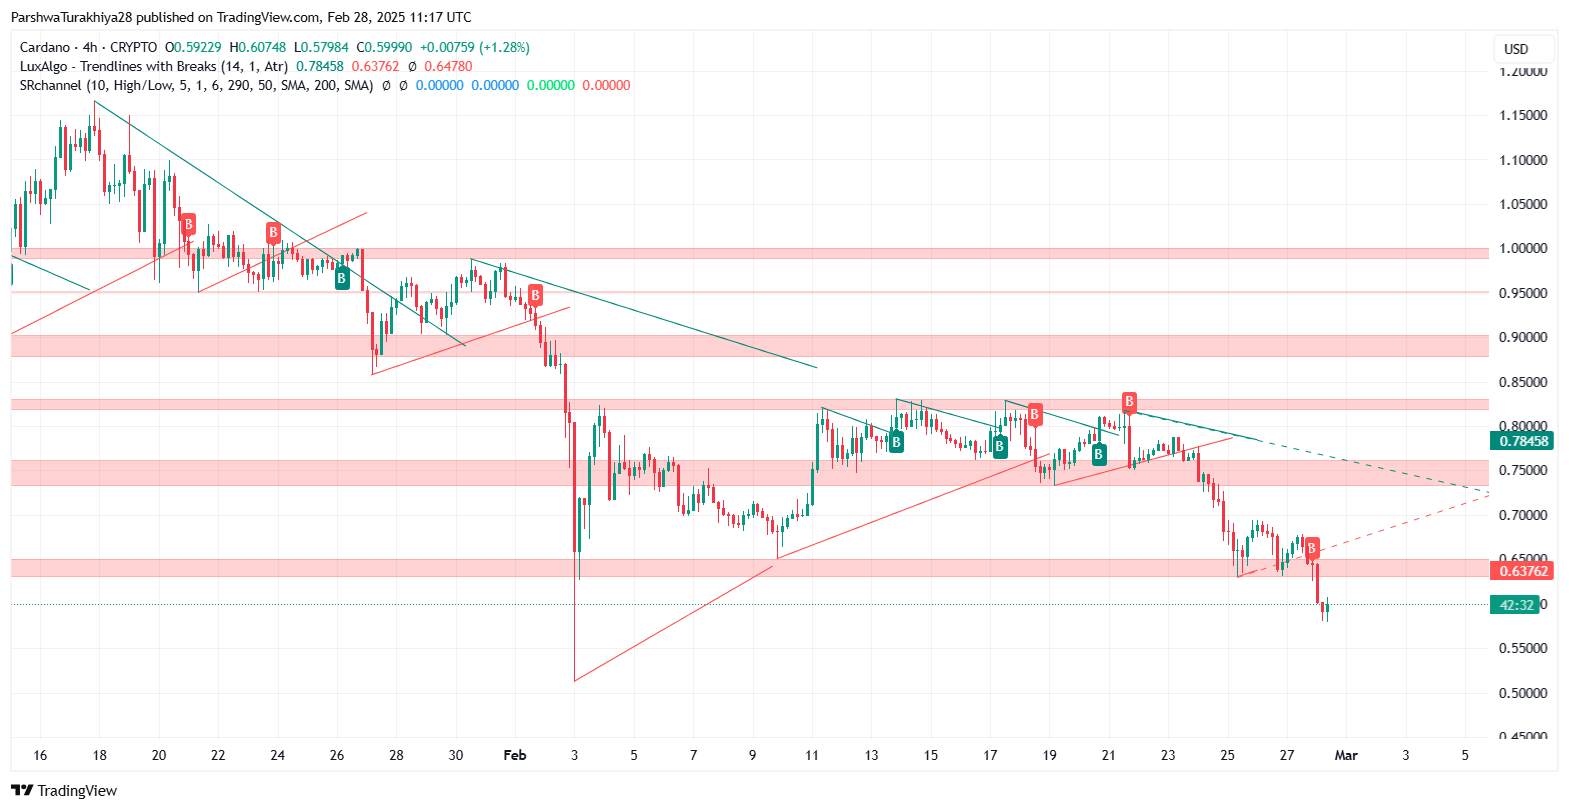
Cardano price dynamics (Jan 2025 - Feb 2025) Source: TradingView.
Technical indicators confirm ADA’s bearish structure
ADA is currently trading below all major Exponential Moving Averages (EMAs), reinforcing its bearish outlook. The 20 EMA, positioned at $0.6558, acts as a short-term resistance level, preventing any immediate recovery. The 50 EMA, which represents the medium-term trend, stands at $0.7001, further adding to the downward pressure. Meanwhile, the 100 EMA at $0.7363 and the 200 EMA at $0.7875, which indicate long-term market trends, remain well above the current price, confirming that ADA is struggling to regain bullish momentum.
A bearish crossover, where the 50 EMA has fallen below the 100 and 200 EMAs, further reinforces the extended weakness. Unless ADA reclaims $0.65 - $0.70, the downward trend is expected to continue.
The Relative Strength Index (RSI) is at 26.86, signaling oversold conditions. While this suggests that sellers may be exhausting, a move above 35-40 is necessary to confirm a potential rebound. Meanwhile, the MACD indicator remains negative, with the MACD line at -0.00434 and the signal line at -0.02593, confirming strong bearish momentum.
Potential support and resistance levels to watch
Bollinger Bands indicate increased volatility, with ADA trading near the lower band at $0.6169, while the middle band sits at $0.7416. A move back toward the middle band could signal a short-term bounce, though a close below the lower band could accelerate further declines.
From a Fibonacci retracement perspective, the next major resistance levels include $0.68 at the 38.2% retracement, acting as a short-term resistance, followed by $0.74 at the 50% retracement, which is a significant level in determining trend reversals. The 61.8% retracement at $0.80 serves as a major breakout zone, where a sustained move above this level could indicate a shift in momentum. If ADA manages to break above $0.65, it could challenge the $0.70 level and subsequently $0.74. However, failure to reclaim these resistance levels could lead to continued consolidation or further downward movement.
Outlook: ADA needs a breakout above $0.65 for a recovery
ADA remains bearish, but oversold indicators suggest that a short-term bounce is possible. The $0.60 level is critical, and a break below it could push ADA toward $0.55 - $0.50. On the other hand, reclaiming $0.65 - $0.70 would confirm a potential reversal, with further gains possible if ADA surpasses $0.74.
Traders should watch for confirmation signals such as increased volume and bullish candlestick formations before entering long positions. Stop-losses should be placed below $0.55 to manage downside risks.
As previously discussed, ADA continues its bearish trajectory, struggling to hold key support levels amid weak market sentiment.


