XRP price prediction: Bearish momentum persists as XRP struggles to hold support
 XRP price hovers near $2.02 as bearish sentiment dominates market action.
XRP remains under pressure, trading between $2.02 and $2.06, struggling to maintain support amid ongoing bearish sentiment. Over the past 24 hours, XRP has reached a high of $2.19 and a low of $1.95, signaling strong downside momentum.
The market outlook remains weak, with sellers dominating price action, preventing any significant recovery.
A well-defined downward-sloping trendline has kept XRP confined to a bearish trajectory, with strong resistance forming at $2.30–$2.40. This range previously served as a consolidation zone before the recent breakdown. If XRP manages to push above this level, the next resistance stands at $2.58–$2.60, aligning with past rejection points. However, failure to hold $2.00 could see the price drop toward $1.95, with further downside toward the $1.80–$1.85 range.
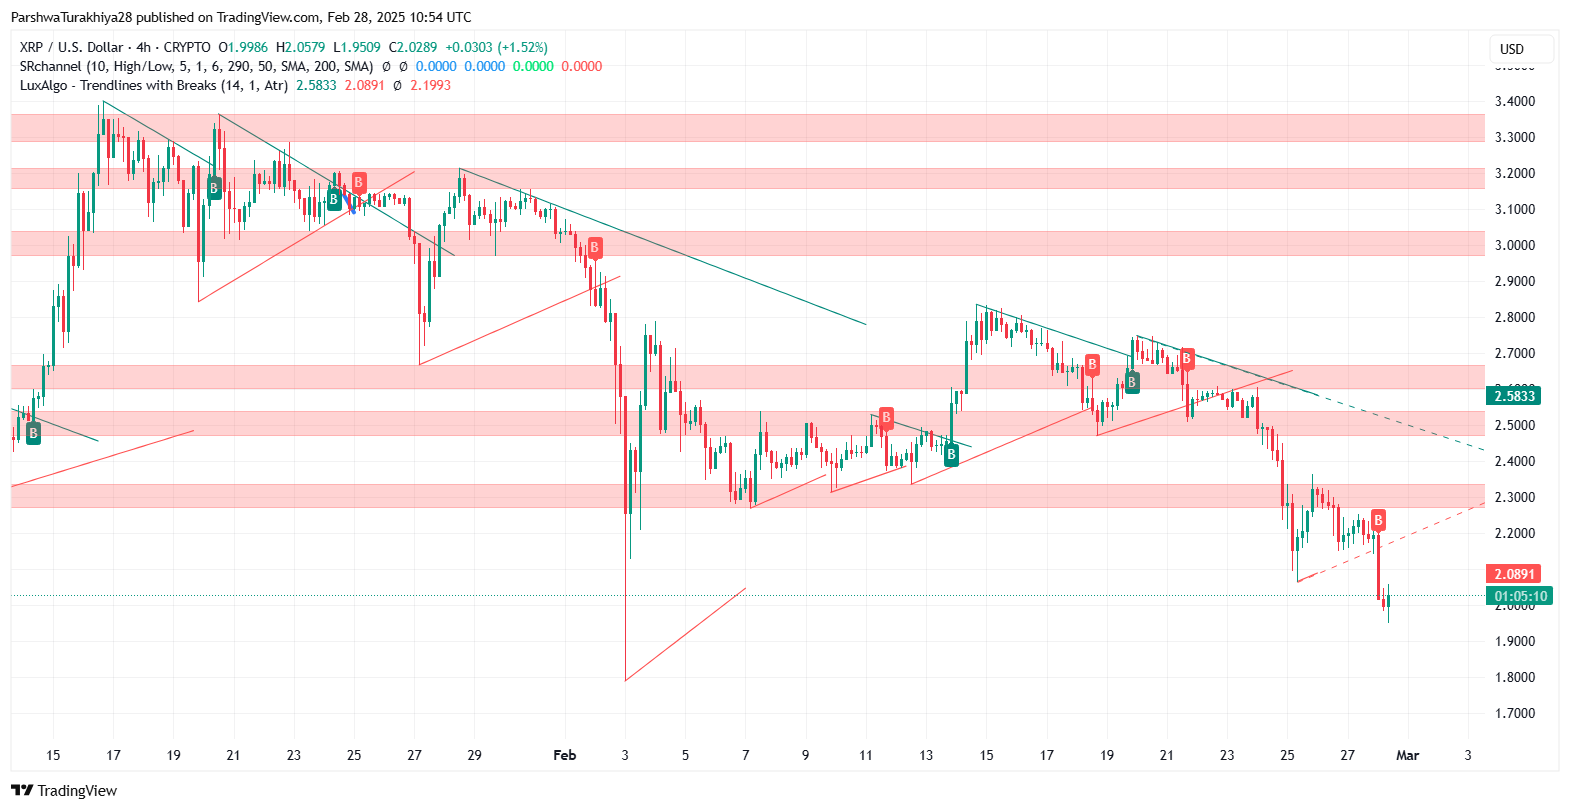
XRP/USD price dynamics (Jan 2025 - Feb 2025) Source: TradingView.
Technical indicators confirm bearish structure
XRP is trading below all major moving averages, reinforcing a prolonged downtrend. The 50-period EMA sits at $2.35, the 100-period EMA at $2.45, and the 200-period EMA at $2.54. A bearish crossover, where the 50 EMA has fallen below the 100 and 200 EMAs, confirms extended weakness. Until XRP reclaims these moving averages, bullish momentum remains absent.
The Relative Strength Index (RSI) has dropped to 28.13, placing XRP in oversold territory. Typically, an RSI below 30 suggests that an asset is heavily sold, often leading to a relief rally. However, XRP must climb above 32-35 to confirm a shift in momentum. Meanwhile, the MACD indicator remains negative, with the MACD line at -0.0122 and the signal line at -0.0854, confirming strong bearish momentum.
Bollinger Bands indicate that XRP is hugging the lower band near $2.01, reflecting intense selling pressure. The middle band, representing the 20-period SMA at $2.19, serves as an initial upside target if a mean reversion occurs. A decisive close below the lower Bollinger Band could accelerate further downside.
Key levels to watch for potential reversal
Fibonacci retracement analysis from the recent $3.00 high identifies resistance at the 38.2% retracement ($2.30), 50% retracement ($2.50), and 61.8% retracement ($2.70). These levels could act as resistance if XRP stages a rebound. Breaking above $2.30 could drive momentum toward $2.50, aligning with the 100 EMA. Further upside above $2.50 could push XRP toward $2.70.
Trading volume remains low, suggesting a lack of conviction behind any recovery attempts. If buying pressure increases near $1.95–$2.00, XRP may consolidate before attempting an upside move. However, a break below $1.95 could trigger a sell-off toward $1.85 or even $1.75.
Outlook: XRP remains in a downtrend
XRP’s bearish structure remains intact, with the asset struggling to reclaim key levels. While RSI and Bollinger Bands suggest a possible relief bounce, XRP needs to break above $2.20 to shift momentum. Holding above $2.00 is crucial, and a bullish breakout requires a clear move past resistance levels. Traders should watch for confirmation signals before entering positions, with a stop-loss below $1.85 to mitigate risks.
As previously discussed XRP continues to face selling pressure, struggling to recover key resistance levels.


