XRP price edges toward triangle breakout as key resistance at $2.50 holds
 XRP trades near $2.42, forming a symmetrical triangle across 4H chart ahead of potential breakout
XRP is showing signs of technical compression across multiple timeframes, with price coiling within a symmetrical triangle pattern that traders believe could precede a breakout. The cryptocurrency is currently trading near $2.42, caught between key support and resistance levels as broader market momentum stalls.
On the daily chart, XRP remains in a broader consolidation phase, holding above the higher low structure formed since January. However, the price continues to face headwinds from the long-term descending trendline and overhead supply zone between $2.80 and $3.00. The $1.90 level serves as critical support on the downside, having been tested multiple times this quarter.
On the 4-hour timeframe, XRP is shaping a well-defined symmetrical triangle with boundaries set between $2.50 and $2.34. Price action recently tested the lower trendline of the triangle, while volume has contracted significantly—often a precursor to sharp movement. The 50 and 100 EMAs are acting as immediate barriers near $2.42–$2.44, while the 200 EMA sits at $2.40, offering dynamic support. RSI is neutral at 51, suggesting a balanced battle between buyers and sellers, while MACD remains muted with no strong directional bias.
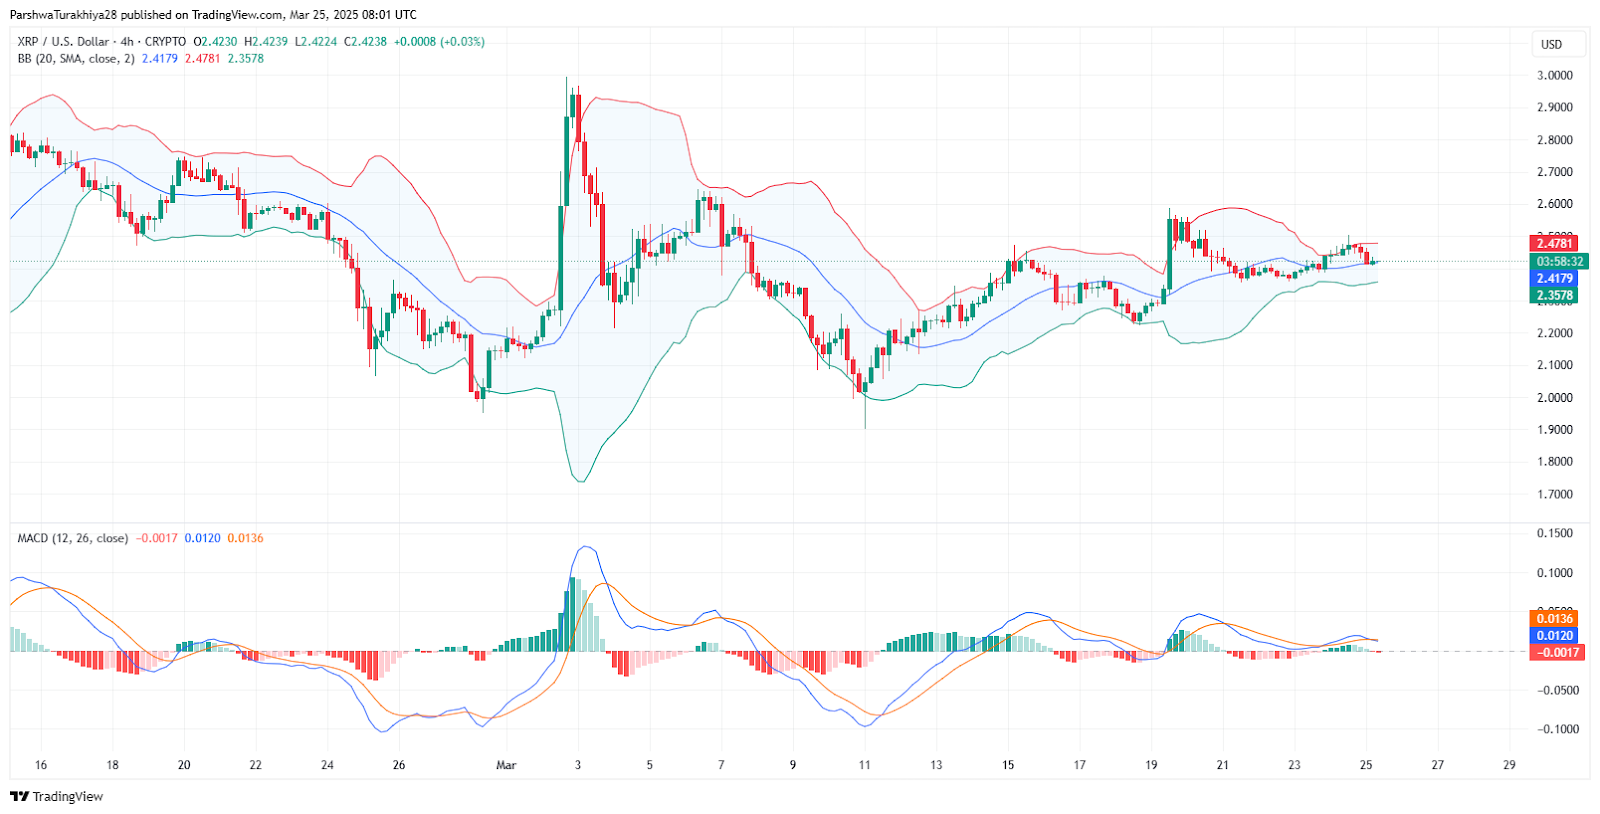
XRP price dynamics (Feb 2025 - Mar 2025) Source: TradingView.
Short-term weakness persists but broader breakout setup intact
Zooming into the 45-minute chart, XRP faced rejection at the $2.49 resistance and is now testing ascending trendline support formed on March 23. A red signal from LuxAlgo and a MACD crossover below the signal line indicate that short-term momentum favors bears. Bollinger Bands are also tightening, reflecting low volatility that often precedes large moves.
A confirmed breakout above $2.50 could trigger a rally toward the $2.85–$3.00 zone, while failure to hold above $2.34 may expose the $2.20–$2.00 levels. Traders are advised to watch for RSI breaks above 60 and increased volume as confirmation triggers.
In earlier analysis, we identified the $2.28–$2.50 range as the battleground for XRP’s next directional move. With the asset still trading within this zone and testing key technical thresholds, today’s coiling structure reinforces the view that a breakout or breakdown is imminent.


