XRP tumbles under $2.1 as bears take control, $1.9 support tested
 XRP struggles near $2.05 amid bearish technical signals and downtrend continuation
XRP remained under pressure Monday as the cryptocurrency extended its corrective slide, trading near $2.05 amid a broader market pullback and clear signs of technical weakness. The asset has been consistently posting lower highs and lower lows, with sellers dominating the trend following multiple failed attempts to reclaim the $2.6–$2.76 supply zone.
That area also aligns with the 0.236 Fibonacci retracement from the December rally, reinforcing its significance as overhead resistance.
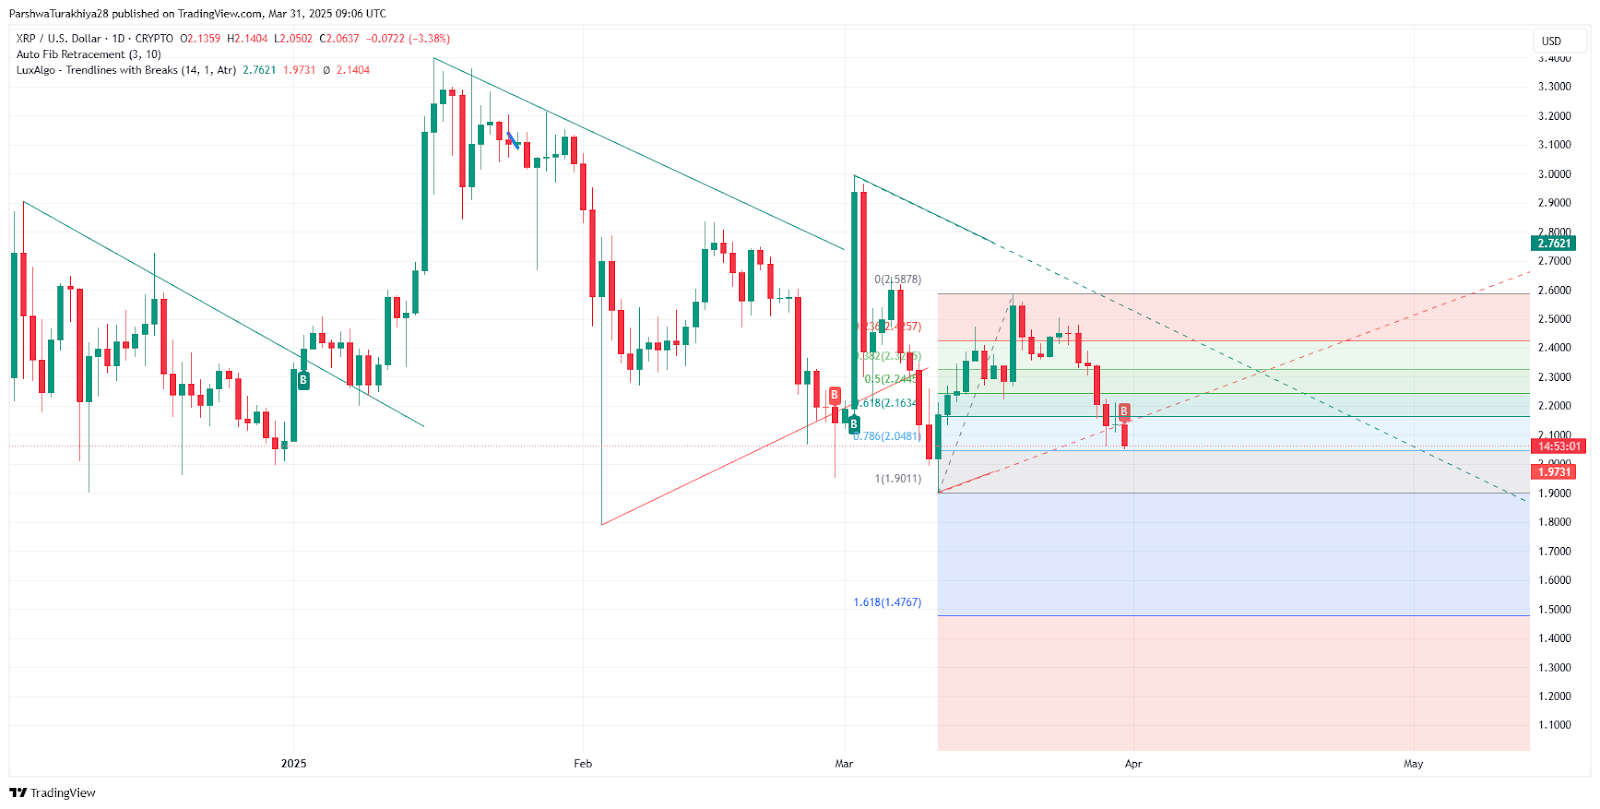
XRP/USD price analysis (Dec 2024 - Mar 2025) Source: TradingView.
Momentum and structure favor bears as key supports near breakdown
XRP's inability to defend the rising wedge breakout near $2.2 has triggered renewed selling interest. On the 4-hour chart, price action remains capped below all major EMAs—20, 50, 100, and 200—confirming that sellers are in control. The RSI on the 4H timeframe sits deep in oversold territory at 27.4, though lacking any bullish divergence that could hint at a recovery. Meanwhile, MACD on both 4H and daily charts shows no signs of reversal, with histogram bars expanding and MACD lines diverging further into bearish territory.
Bollinger Bands are flaring downward, with price hugging the lower band around $2.049—an indication of trending volatility rather than mean reversion. Until XRP reclaims the $2.1451 mid-band, downside pressure is likely to persist. Daily chart analysis reveals a broader descending channel guiding the current move lower, with immediate support seen at the 0.786 Fib level of $2.0481. A clean break below could trigger another leg down toward $1.9, a key psychological and structural support zone.
Outlook hinges on $2.05 support zone
XRP is now at a critical juncture. While oversold conditions may invite short-term relief bounces, the broader trend remains bearish unless bulls reclaim the $2.3–$2.5 zone with volume confirmation. Traders should monitor the $2.0481 Fibonacci level and $1.9 support for potential breakdown setups or reversal signals. Without a strong catalyst, the bias remains skewed to the downside.
Earlier analysis indicated that XRP’s failure to break above the $2.6 resistance and its drop below major EMAs signaled deteriorating strength. The breakdown from the wedge pattern now confirms bearish momentum, with risks tilted toward retesting $1.9 in the near term.


